Origin of Hydrophobicity in FIB-Nanostructured Si SurfacesAlberto Rota,*,†,‡ Manoj Tripathi,‡,§ GianCarlo Gazzadi,§ and Sergio Valeri†,‡,§
†Centro Interdipartimentale per la Ricerca Applicata e i Servizi nel settore della Meccanica Avanzata e della Motoristica - Universita diModena e Reggio Emilia, Via Vignolese, 905/b - 41125 Modena, Italy‡Dipartimento di Scienze Fisiche, Informatiche e Matematiche - Universita di Modena e Reggio Emilia, Via Campi 213/A − 41125Modena, Italy§CNR - Istituto di Nanoscienze, Centro S3, Via Campi 213/A − 41125 Modena, Italy
*S Supporting Information
ABSTRACT: Surface morphology has been demonstrated to influencethe tribological properties at different scales, but the phenomena whichoccur at the nanoscale have not been completely understood. The presentstudy reports on the effect of focused ion beam nanopatterning oncoefficient of friction (CoF) and adhesion of Si(001) surface covered bynative oxide. Regular arrays of nanogrooves reduce both CoF andadhesion, related to a hydrophobic character of the patterned surface, butthis effect disappears as soon as the separation among the nanostructuresapproaches the microscopic scale. The dependence of this hydrophobiceffect on the pitch is not linked to the corresponding contact area. It hasbeen found that each nanostructure is surrounded by a low-friction regionwhich extends some hundreds of nanometers from it. For pitches of 125and 250 nm these low-friction regions completely overlap, generating aconsistent decrease in CoF and adhesion, while for pitches of 500 and 1000 nm their effect is negligible. The low-friction regionswere not observed in humidity-free ambient, indicating that they are the origin of patterns of hydrophobicity.
I. INTRODUCTION
The present-day interest in nanotechnologies is mainly relatedto the different physical and chemical properties of materialswhen they are confined to the nanoscale. Also in the case oftribology, scaling the contact area and the applied load down tothe nanoscale, novel phenomena occur. These phenomena arestrictly dependent on adhesion between mating surfaces, whichis usually negligible for a load in the micro/macroscale, but thatplays a dominant role in the nanoscale load range. Thetopography has been demonstrated to play an important role inthe tribological properties of surfaces and most of the studiesfound a close connection between adhesion and contactarea.1−6 The modification of the surface morphology has beenapproached by different techniques, depending on the materialand on the size and geometry of the desired pattern:photolithography,2,4 replica molding,1,3,5 colloidal lithography,6
focused ion beam (FIB).7,8 The main conclusions that could bedrawn are: (1) adhesion and friction decrease with the contactarea,1−5(2) patterning is able to enhance the hydrophobicity inalready hydrophobic surfaces and hydrophilicity in alreadyhydrophilic ones,1,4 in agreement with the Wenzel model,9 and(3) in the nano-Newton load range, different tribologicalproperties appear with respect to micro/macro-Newton ones,2
related to the role played by adhesion.Many of the cited researches investigated the wettability of
the materials and its dependence on roughness, but a clearconnection between wettability and adhesion is still lacking. In
fact, in some works, wettability shows the same dependence onthe roughness observed for adhesion1−3,5 and in others itbehaves differently.4 In particular, in this last reference, theauthors show how wettability can be described by Wenzel,hemiwicking, or Cassie−Baxter models, depending on therelative values of the geometrical parameters.In apparent contrast with conclusion (1), in our previous
studies,7,8 we showed that adhesion and CoF reduction of thepatterned Si(001) surface does not depend on the contact area.In fact, through tests in air and in high vacuum, we concludedthat the lower adhesion and CoF of the patterned regions arerelated to a hydrophobic effect induced by nanopatterning.These conflicting results are probably related to a
nonexhaustive knowledge of tribology at the nanoscale and,in particular, of the relation among wettability, adhesion, andmorphology. The ambiguity probably has origins in thedifferent size and geometry of the studied patterns, whichsensibly change in the related literature. In their work, Pham etal.5 concluded that the lower wettability of patterned PMMAwith respect to pristine surface, as well as for adhesion, isrelated to the lower contact area. However, the authors alsoreported on an anisotropic behavior of wettability with respectto the orientation of the pattern, composed by parallel grooves.
Received: November 26, 2012Revised: March 28, 2013
A similar phenomenon was observed by others authors.6 Wethink that this anisotropy is an indication that wettabilitycannot be related only to the contact area and that othermorphology-dependent phenomena occur. In particular, wethink that the dimensions of the nanostructures that composethe pattern (i.e., depth/height ratio, width, pitch) are crucial forthe hydrophilic/hydrophobic properties of the surface.The present study aims to better define the borderline of
nanotribological effects and the role of surface nanostructuresin these phenomena. The system under investigation is an arrayof equally spaced parallel nanogrooves, 50 nm wide and somenm deep. Four different patterns were investigated, which differfrom each other in the pitch (i.e., 125, 250, 500 and 1000 nm).In our previous research,7,8 we focused on a 125 nm pitchpattern, showing that it induces a hydrophobic character to theSi(001), a typical hydrophilic material in standard conditionsdue to the presence of native oxide on the surface.10 Here, weshow that the periodicity of the pattern is crucial for itstribological behavior and that, at the nanoscale, the decrease inadhesion and CoF does not depend only on the contact area. Inour last study, we have observed that the presence of thenanogrooves induces a hydrophobic character to the surfaceand that this effect disappears when the geometrical dimensionof the array moves toward the microscale (i.e., increasing thepitch from 125 to 1000 nm). We have found that eachnanostructure acts as a local “source” of hydrophobicity, andthe interplay among all these structures leads to the resultanthydrophobicity on the patterns. Differently with respect tomost of previous studies, all tribological tests were performedusing a modified rounded Si tip, which better reproduces theoperating conditions of Micro-Electro-Mechanical Systems(MEMS) and Nano-Electro-Mechanical Systems (NEMS)devices, where the typical coupling structures are both madeof Si. This similarity should give more accurate information forthe future development of such devices.
II. EXPERIMENTAL SECTIONA. Sample and Tip Preparation. Si(001) single crystal was used
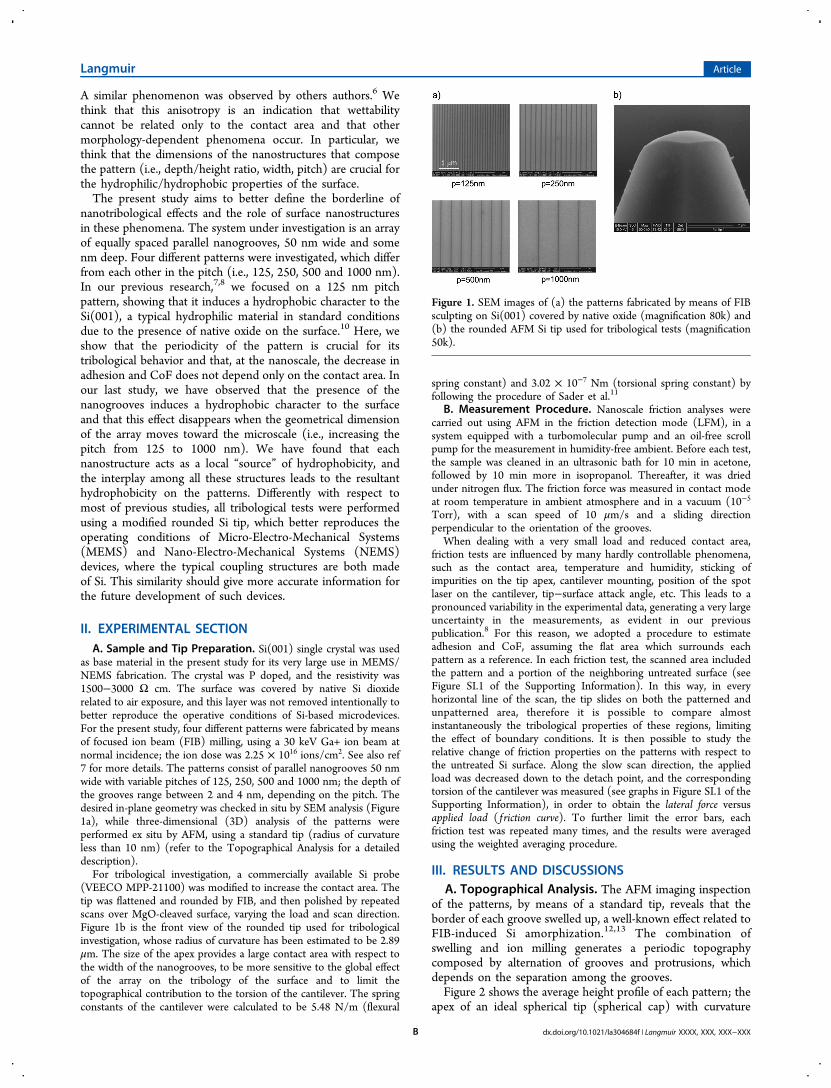
as base material in the present study for its very large use in MEMS/NEMS fabrication. The crystal was P doped, and the resistivity was1500−3000 Ω cm. The surface was covered by native Si dioxiderelated to air exposure, and this layer was not removed intentionally tobetter reproduce the operative conditions of Si-based microdevices.For the present study, four different patterns were fabricated by meansof focused ion beam (FIB) milling, using a 30 keV Ga+ ion beam atnormal incidence; the ion dose was 2.25 × 10¹⁶ ions/cm2. See also ref7 for more details. The patterns consist of parallel nanogrooves 50 nmwide with variable pitches of 125, 250, 500 and 1000 nm; the depth ofthe grooves range between 2 and 4 nm, depending on the pitch. Thedesired in-plane geometry was checked in situ by SEM analysis (Figure1a), while three-dimensional (3D) analysis of the patterns wereperformed ex situ by AFM, using a standard tip (radius of curvatureless than 10 nm) (refer to the Topographical Analysis for a detaileddescription).For tribological investigation, a commercially available Si probe
(VEECO MPP-21100) was modified to increase the contact area. Thetip was flattened and rounded by FIB, and then polished by repeatedscans over MgO-cleaved surface, varying the load and scan direction.Figure 1b is the front view of the rounded tip used for tribologicalinvestigation, whose radius of curvature has been estimated to be 2.89μm. The size of the apex provides a large contact area with respect tothe width of the nanogrooves, to be more sensitive to the global effectof the array on the tribology of the surface and to limit thetopographical contribution to the torsion of the cantilever. The springconstants of the cantilever were calculated to be 5.48 N/m (flexural
spring constant) and 3.02 × 10⁻⁷ Nm (torsional spring constant) byfollowing the procedure of Sader et al.11
B. Measurement Procedure. Nanoscale friction analyses werecarried out using AFM in the friction detection mode (LFM), in asystem equipped with a turbomolecular pump and an oil-free scrollpump for the measurement in humidity-free ambient. Before each test,the sample was cleaned in an ultrasonic bath for 10 min in acetone,followed by 10 min more in isopropanol. Thereafter, it was driedunder nitrogen flux. The friction force was measured in contact modeat room temperature in ambient atmosphere and in a vacuum (10−5
Torr), with a scan speed of 10 μm/s and a sliding directionperpendicular to the orientation of the grooves.
When dealing with a very small load and reduced contact area,friction tests are influenced by many hardly controllable phenomena,such as the contact area, temperature and humidity, sticking ofimpurities on the tip apex, cantilever mounting, position of the spotlaser on the cantilever, tip−surface attack angle, etc. This leads to apronounced variability in the experimental data, generating a very largeuncertainty in the measurements, as evident in our previouspublication.8 For this reason, we adopted a procedure to estimateadhesion and CoF, assuming the flat area which surrounds eachpattern as a reference. In each friction test, the scanned area includedthe pattern and a portion of the neighboring untreated surface (seeFigure SI.1 of the Supporting Information). In this way, in everyhorizontal line of the scan, the tip slides on both the patterned andunpatterned area, therefore it is possible to compare almostinstantaneously the tribological properties of these regions, limitingthe effect of boundary conditions. It is then possible to study therelative change of friction properties on the patterns with respect tothe untreated Si surface. Along the slow scan direction, the appliedload was decreased down to the detach point, and the correspondingtorsion of the cantilever was measured (see graphs in Figure SI.1 of theSupporting Information), in order to obtain the lateral force versusapplied load ( f riction curve). To further limit the error bars, eachfriction test was repeated many times, and the results were averagedusing the weighted averaging procedure.
III. RESULTS AND DISCUSSIONSA. Topographical Analysis. The AFM imaging inspection
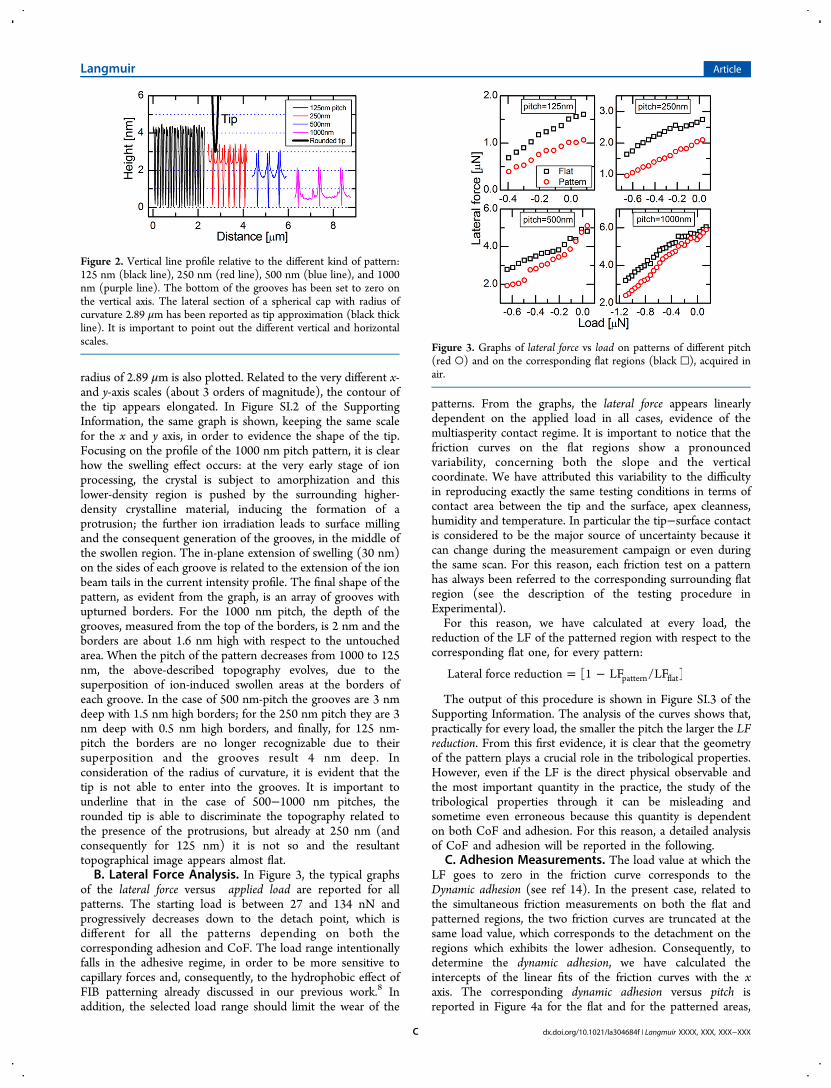
of the patterns, by means of a standard tip, reveals that theborder of each groove swelled up, a well-known effect related toFIB-induced Si amorphization.12,13 The combination ofswelling and ion milling generates a periodic topographycomposed by alternation of grooves and protrusions, whichdepends on the separation among the grooves.Figure 2 shows the average height profile of each pattern; the
apex of an ideal spherical tip (spherical cap) with curvature
Figure 1. SEM images of (a) the patterns fabricated by means of FIBsculpting on Si(001) covered by native oxide (magnification 80k) and(b) the rounded AFM Si tip used for tribological tests (magnification50k).
radius of 2.89 μm is also plotted. Related to the very different x-and y-axis scales (about 3 orders of magnitude), the contour ofthe tip appears elongated. In Figure SI.2 of the SupportingInformation, the same graph is shown, keeping the same scalefor the x and y axis, in order to evidence the shape of the tip.Focusing on the profile of the 1000 nm pitch pattern, it is clearhow the swelling effect occurs: at the very early stage of ionprocessing, the crystal is subject to amorphization and thislower-density region is pushed by the surrounding higher-density crystalline material, inducing the formation of aprotrusion; the further ion irradiation leads to surface millingand the consequent generation of the grooves, in the middle ofthe swollen region. The in-plane extension of swelling (30 nm)on the sides of each groove is related to the extension of the ionbeam tails in the current intensity profile. The final shape of thepattern, as evident from the graph, is an array of grooves withupturned borders. For the 1000 nm pitch, the depth of thegrooves, measured from the top of the borders, is 2 nm and theborders are about 1.6 nm high with respect to the untouchedarea. When the pitch of the pattern decreases from 1000 to 125nm, the above-described topography evolves, due to thesuperposition of ion-induced swollen areas at the borders ofeach groove. In the case of 500 nm-pitch the grooves are 3 nmdeep with 1.5 nm high borders; for the 250 nm pitch they are 3nm deep with 0.5 nm high borders, and finally, for 125 nm-pitch the borders are no longer recognizable due to theirsuperposition and the grooves result 4 nm deep. Inconsideration of the radius of curvature, it is evident that thetip is not able to enter into the grooves. It is important tounderline that in the case of 500−1000 nm pitches, therounded tip is able to discriminate the topography related tothe presence of the protrusions, but already at 250 nm (andconsequently for 125 nm) it is not so and the resultanttopographical image appears almost flat.B. Lateral Force Analysis. In Figure 3, the typical graphs
of the lateral force versus applied load are reported for allpatterns. The starting load is between 27 and 134 nN andprogressively decreases down to the detach point, which isdifferent for all the patterns depending on both thecorresponding adhesion and CoF. The load range intentionallyfalls in the adhesive regime, in order to be more sensitive tocapillary forces and, consequently, to the hydrophobic effect ofFIB patterning already discussed in our previous work.8 Inaddition, the selected load range should limit the wear of the
patterns. From the graphs, the lateral force appears linearlydependent on the applied load in all cases, evidence of themultiasperity contact regime. It is important to notice that thefriction curves on the flat regions show a pronouncedvariability, concerning both the slope and the verticalcoordinate. We have attributed this variability to the difficultyin reproducing exactly the same testing conditions in terms ofcontact area between the tip and the surface, apex cleanness,humidity and temperature. In particular the tip−surface contactis considered to be the major source of uncertainty because itcan change during the measurement campaign or even duringthe same scan. For this reason, each friction test on a patternhas always been referred to the corresponding surrounding flatregion (see the description of the testing procedure inExperimental).For this reason, we have calculated at every load, the
reduction of the LF of the patterned region with respect to thecorresponding flat one, for every pattern:
= −Lateral force reduction [1 LF /LF ]pattern flat
The output of this procedure is shown in Figure SI.3 of theSupporting Information. The analysis of the curves shows that,practically for every load, the smaller the pitch the larger the LFreduction. From this first evidence, it is clear that the geometryof the pattern plays a crucial role in the tribological properties.However, even if the LF is the direct physical observable andthe most important quantity in the practice, the study of thetribological properties through it can be misleading andsometime even erroneous because this quantity is dependenton both CoF and adhesion. For this reason, a detailed analysisof CoF and adhesion will be reported in the following.
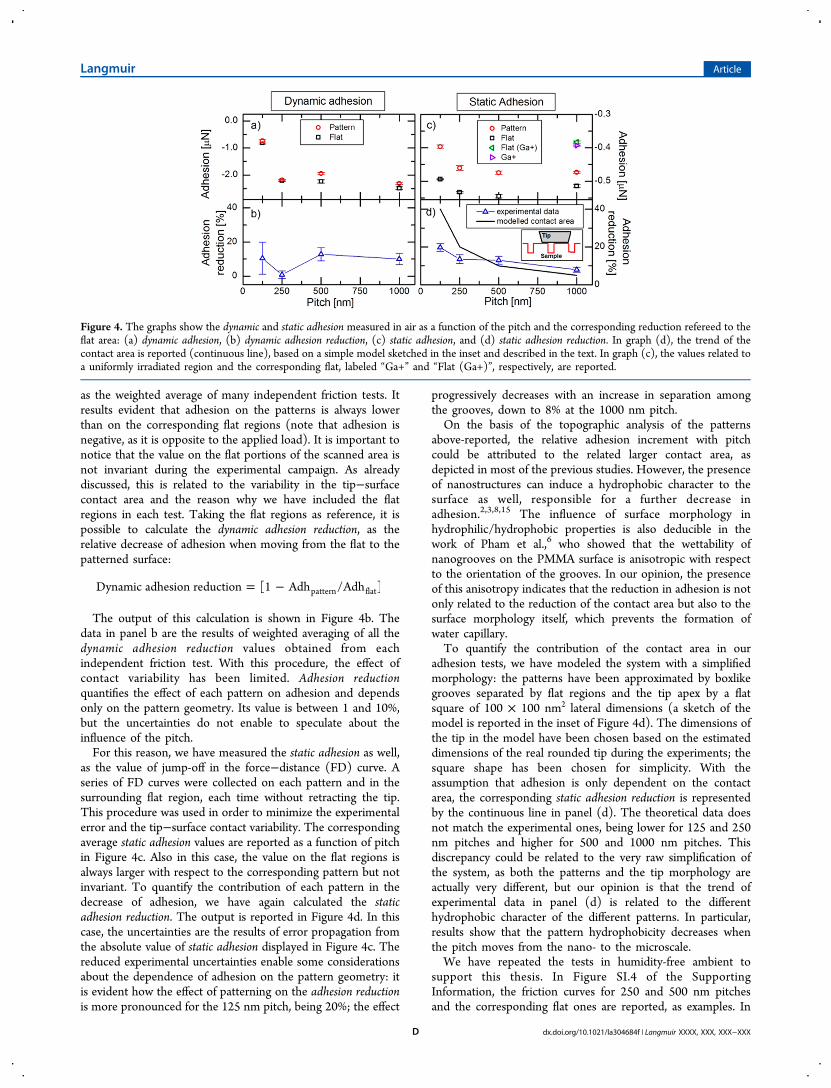
C. Adhesion Measurements. The load value at which theLF goes to zero in the friction curve corresponds to theDynamic adhesion (see ref 14). In the present case, related tothe simultaneous friction measurements on both the flat andpatterned regions, the two friction curves are truncated at thesame load value, which corresponds to the detachment on theregions which exhibits the lower adhesion. Consequently, todetermine the dynamic adhesion, we have calculated theintercepts of the linear fits of the friction curves with the xaxis. The corresponding dynamic adhesion versus pitch isreported in Figure 4a for the flat and for the patterned areas,
Figure 2. Vertical line profile relative to the different kind of pattern:125 nm (black line), 250 nm (red line), 500 nm (blue line), and 1000nm (purple line). The bottom of the grooves has been set to zero onthe vertical axis. The lateral section of a spherical cap with radius ofcurvature 2.89 μm has been reported as tip approximation (black thickline). It is important to point out the different vertical and horizontalscales. Figure 3. Graphs of lateral force vs load on patterns of different pitch
(red ○) and on the corresponding flat regions (black □), acquired inair.
as the weighted average of many independent friction tests. Itresults evident that adhesion on the patterns is always lowerthan on the corresponding flat regions (note that adhesion isnegative, as it is opposite to the applied load). It is important tonotice that the value on the flat portions of the scanned area isnot invariant during the experimental campaign. As alreadydiscussed, this is related to the variability in the tip−surfacecontact area and the reason why we have included the flatregions in each test. Taking the flat regions as reference, it ispossible to calculate the dynamic adhesion reduction, as therelative decrease of adhesion when moving from the flat to thepatterned surface:
The output of this calculation is shown in Figure 4b. Thedata in panel b are the results of weighted averaging of all thedynamic adhesion reduction values obtained from eachindependent friction test. With this procedure, the effect ofcontact variability has been limited. Adhesion reductionquantifies the effect of each pattern on adhesion and dependsonly on the pattern geometry. Its value is between 1 and 10%,but the uncertainties do not enable to speculate about theinfluence of the pitch.For this reason, we have measured the static adhesion as well,
as the value of jump-off in the force−distance (FD) curve. Aseries of FD curves were collected on each pattern and in thesurrounding flat region, each time without retracting the tip.This procedure was used in order to minimize the experimentalerror and the tip−surface contact variability. The correspondingaverage static adhesion values are reported as a function of pitchin Figure 4c. Also in this case, the value on the flat regions isalways larger with respect to the corresponding pattern but notinvariant. To quantify the contribution of each pattern in thedecrease of adhesion, we have again calculated the staticadhesion reduction. The output is reported in Figure 4d. In thiscase, the uncertainties are the results of error propagation fromthe absolute value of static adhesion displayed in Figure 4c. Thereduced experimental uncertainties enable some considerationsabout the dependence of adhesion on the pattern geometry: itis evident how the effect of patterning on the adhesion reductionis more pronounced for the 125 nm pitch, being 20%; the effect
progressively decreases with an increase in separation amongthe grooves, down to 8% at the 1000 nm pitch.On the basis of the topographic analysis of the patterns
above-reported, the relative adhesion increment with pitchcould be attributed to the related larger contact area, asdepicted in most of the previous studies. However, the presenceof nanostructures can induce a hydrophobic character to thesurface as well, responsible for a further decrease inadhesion.2,3,8,15 The influence of surface morphology inhydrophilic/hydrophobic properties is also deducible in thework of Pham et al.,6 who showed that the wettability ofnanogrooves on the PMMA surface is anisotropic with respectto the orientation of the grooves. In our opinion, the presenceof this anisotropy indicates that the reduction in adhesion is notonly related to the reduction of the contact area but also to thesurface morphology itself, which prevents the formation ofwater capillary.To quantify the contribution of the contact area in our
adhesion tests, we have modeled the system with a simplifiedmorphology: the patterns have been approximated by boxlikegrooves separated by flat regions and the tip apex by a flatsquare of 100 × 100 nm2 lateral dimensions (a sketch of themodel is reported in the inset of Figure 4d). The dimensions ofthe tip in the model have been chosen based on the estimateddimensions of the real rounded tip during the experiments; thesquare shape has been chosen for simplicity. With theassumption that adhesion is only dependent on the contactarea, the corresponding static adhesion reduction is representedby the continuous line in panel (d). The theoretical data doesnot match the experimental ones, being lower for 125 and 250nm pitches and higher for 500 and 1000 nm pitches. Thisdiscrepancy could be related to the very raw simplification ofthe system, as both the patterns and the tip morphology areactually very different, but our opinion is that the trend ofexperimental data in panel (d) is related to the differenthydrophobic character of the different patterns. In particular,results show that the pattern hydrophobicity decreases whenthe pitch moves from the nano- to the microscale.We have repeated the tests in humidity-free ambient to
support this thesis. In Figure SI.4 of the SupportingInformation, the friction curves for 250 and 500 nm pitchesand the corresponding flat ones are reported, as examples. In
Figure 4. The graphs show the dynamic and static adhesion measured in air as a function of the pitch and the corresponding reduction refereed to theflat area: (a) dynamic adhesion, (b) dynamic adhesion reduction, (c) static adhesion, and (d) static adhesion reduction. In graph (d), the trend of thecontact area is reported (continuous line), based on a simple model sketched in the inset and described in the text. In graph (c), the values related toa uniformly irradiated region and the corresponding flat, labeled “Ga+” and “Flat (Ga+)”, respectively, are reported.
this case, there is no effect of patterning on adhesion, as thecurves of patterned and unpatterned regions almost overlap.Anyway, adhesion is still present, as it is necessary to apply anegative force to detach the tip from the surface as well, for allthe patterns. This adhesion cannot be related to capillary forcesbecause the vacuum condition ensures the almost totaldesorption of water from the surface. As described above, thelinear fits of each friction curve and the correspondingintercepts with the x axis have been calculated to estimatethe dynamic adhesion.The results are reported in Figure 5a. Comparing the
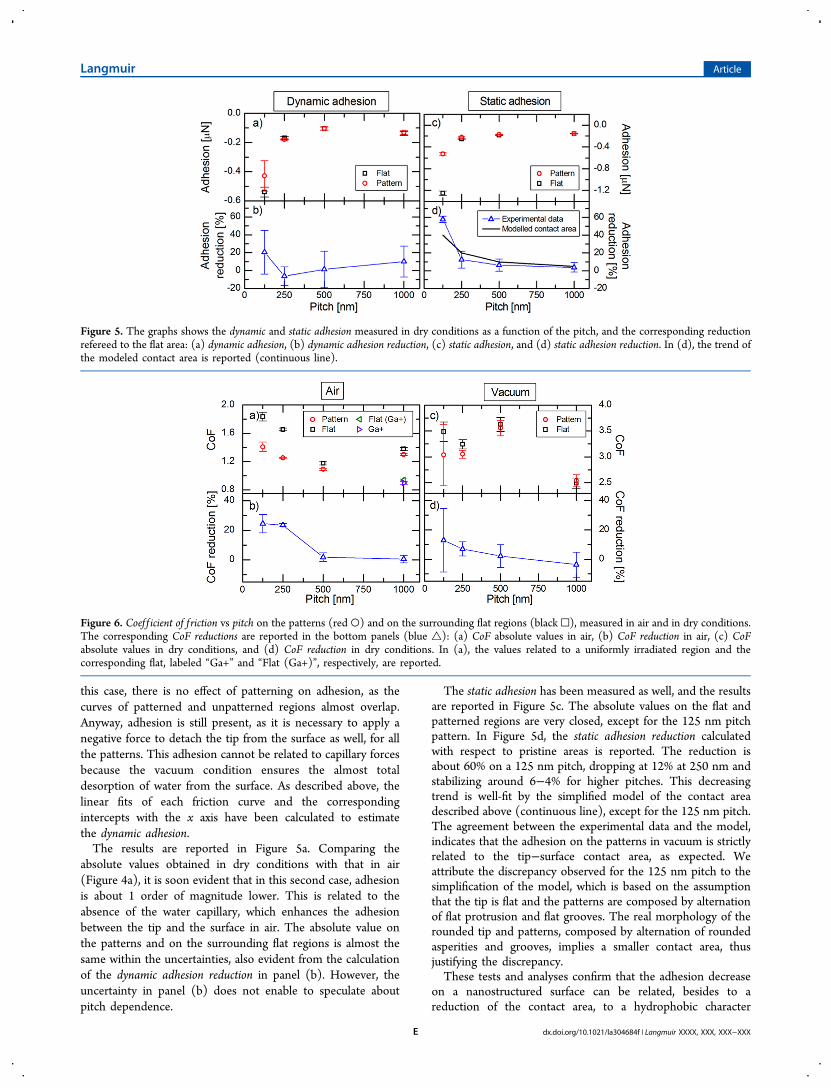
absolute values obtained in dry conditions with that in air(Figure 4a), it is soon evident that in this second case, adhesionis about 1 order of magnitude lower. This is related to theabsence of the water capillary, which enhances the adhesionbetween the tip and the surface in air. The absolute value onthe patterns and on the surrounding flat regions is almost thesame within the uncertainties, also evident from the calculationof the dynamic adhesion reduction in panel (b). However, theuncertainty in panel (b) does not enable to speculate aboutpitch dependence.
The static adhesion has been measured as well, and the resultsare reported in Figure 5c. The absolute values on the flat andpatterned regions are very closed, except for the 125 nm pitchpattern. In Figure 5d, the static adhesion reduction calculatedwith respect to pristine areas is reported. The reduction isabout 60% on a 125 nm pitch, dropping at 12% at 250 nm andstabilizing around 6−4% for higher pitches. This decreasingtrend is well-fit by the simplified model of the contact areadescribed above (continuous line), except for the 125 nm pitch.The agreement between the experimental data and the model,indicates that the adhesion on the patterns in vacuum is strictlyrelated to the tip−surface contact area, as expected. Weattribute the discrepancy observed for the 125 nm pitch to thesimplification of the model, which is based on the assumptionthat the tip is flat and the patterns are composed by alternationof flat protrusion and flat grooves. The real morphology of therounded tip and patterns, composed by alternation of roundedasperities and grooves, implies a smaller contact area, thusjustifying the discrepancy.These tests and analyses confirm that the adhesion decrease
on a nanostructured surface can be related, besides to areduction of the contact area, to a hydrophobic character
Figure 5. The graphs shows the dynamic and static adhesion measured in dry conditions as a function of the pitch, and the corresponding reductionrefereed to the flat area: (a) dynamic adhesion, (b) dynamic adhesion reduction, (c) static adhesion, and (d) static adhesion reduction. In (d), the trend ofthe modeled contact area is reported (continuous line).
Figure 6. Coef f icient of f riction vs pitch on the patterns (red ○) and on the surrounding flat regions (black □), measured in air and in dry conditions.The corresponding CoF reductions are reported in the bottom panels (blue △): (a) CoF absolute values in air, (b) CoF reduction in air, (c) CoFabsolute values in dry conditions, and (d) CoF reduction in dry conditions. In (a), the values related to a uniformly irradiated region and thecorresponding flat, labeled “Ga+” and “Flat (Ga+)”, respectively, are reported.
induced by surface morphology. In the presence of air, it is thissecond effect which dominates at the nanoscale and whichinduces a decrease in CoF and adhesion on the Si surface (seealso refs 7 and 8). The possibility to generate this hydro-phobicity probably depends on the chemical and crystallo-graphic characteristics of the pristine surface, and we cannotexclude that it can be influenced by the patterning technique.The dependence of the induced lower adhesion on theseparation among the nanostructures, indicates that thegeometrical characteristics of the pattern play a fundamentalrole. For the studied geometry, the smaller the pitch the higherthe hydrophobic effect. In fact, as soon as the pitch approachesthe micrometric dimension, this effect progressively disappears.With respect to most of previous findings, where the water-repellent effect of patterning was restricted to alreadyhydrophobic materials, the present study shows that it ispossible to inhibit the formation of a water capillary even onhydrophilic surfaces, such as native oxide-covered Si(001).D. Coefficient of Friction Analysis. The friction curves
reported in Figure 3 show the linear dependence of LF on theload. The angular coefficient of the linear fit represents theCoF. The CoFs are plotted as a function of the pitch with thosecorresponding to the flat regions (Figure 6a). Each value is theresult of the weighted-averaging statistical procedure ofindependent friction tests. The CoF of the patterned regionis 1.4 for the 125 nm pitch; it decreases for the 250 and 500 nmpitches, and it increases again up to about 1.3 for the 1000 nmpitch. In analyzing this trend, similar to the case of adhesion, itis important to observe that the values of the flat regionssensibly vary. On the basis of this consideration, the absolutevalue of the CoF has a relative meaning, as its value can sensiblychange in different experimental runs. Consequently, to bypassthis complication, we have calculated the CoF reduction of eachpattern with respect to the corresponding flat region, followingthe same approach used for LF and adhesion, for everyindividual friction test:
= −CoF reduction [1 CoF /CoF ]pattern flat
The output of this procedure is a series of single values ofCoF reduction, one for every independent friction test. Thesevalues have been averaged by means of a weighted-averagingprocedure, and the results are plotted in Figure 6b as a functionof the pitch. At the 125 and 250 nm pitches, the CoF reduction
is about 20−25%; the effect of patterning completely disappearsat 500 and 1000 nm, as the CoF of the patterns is similar tothat on the corresponding flat regions. This means that, similarto adhesion, the hydrophobic effect of patterning is strictlyrelated to the dimensionality of the texture, being dominantwhen the pitch is far from the microscopic scale. However,differently with respect to the adhesion case, the value of CoFreduction does not sensibly change from 125 to 250 nm, and itdrops at 500 nm around 0%, maintaining this value also for the1000 nm pitch. In this case, we can identify a discontinuity inthe CoF reduction between 250 and 500 nm, a sort of transitionfrom the nano- to the microscale. To the best of ourknowledge, this is the first time that the transition from thenano- to microtribology has been observed.Similar to that described above for adhesion, the effect of FIB
patterning on the CoF is absent in a humidity-free ambient. Infact, as evident from the friction curves in SI.3 of theSupporting Information, the slope related to the patterns isthe same for the corresponding flat regions. The measured CoFof the patterns in vacuum, plotted in Figure 6c, is between 2.9and 3.6, varying the pitch. The corresponding graph of the CoFreduction is shown in Figure 6d. Within the experimental error,the CoF reduction is almost absent and does not depend on thepitch in humidity-free ambient, supporting what was alreadydiscussed about the hydrophobic effect of patterning.This is further evidence of the fact that nanopatterning is able
to change the hydrophobic/hydrophilic properties of the SiO2−Si surface.
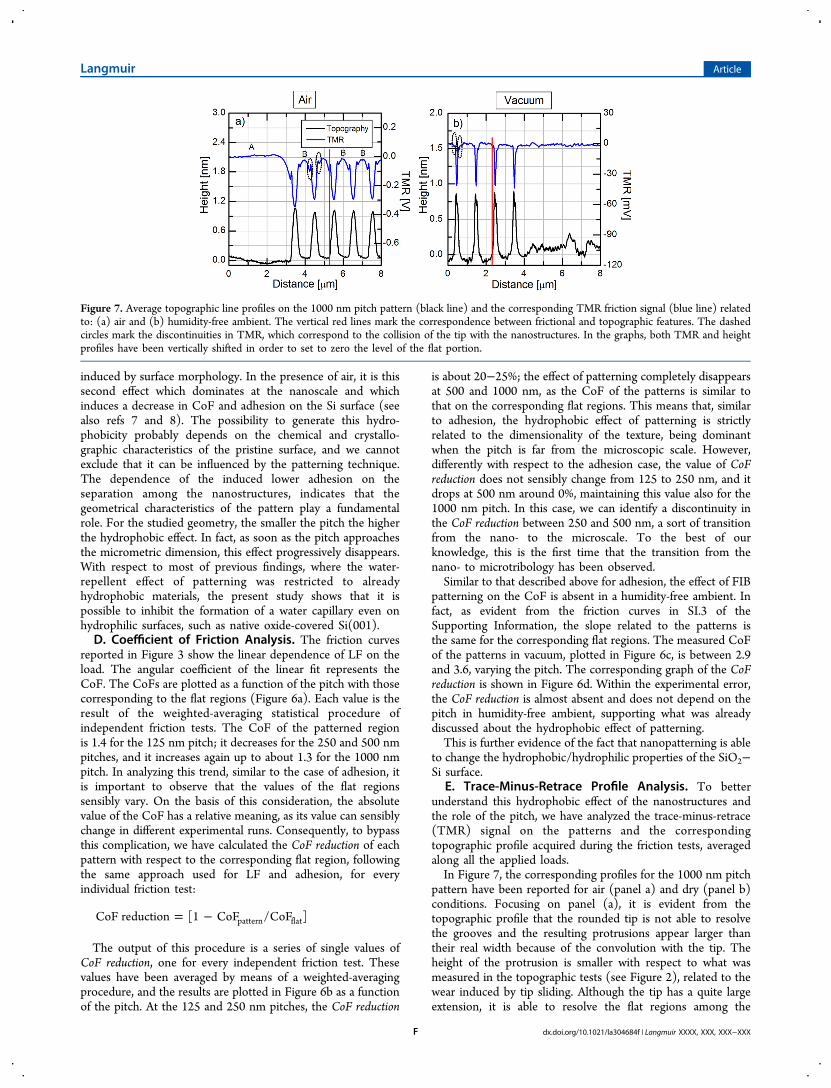
E. Trace-Minus-Retrace Profile Analysis. To betterunderstand this hydrophobic effect of the nanostructures andthe role of the pitch, we have analyzed the trace-minus-retrace(TMR) signal on the patterns and the correspondingtopographic profile acquired during the friction tests, averagedalong all the applied loads.In Figure 7, the corresponding profiles for the 1000 nm pitch
pattern have been reported for air (panel a) and dry (panel b)conditions. Focusing on panel (a), it is evident from thetopographic profile that the rounded tip is not able to resolvethe grooves and the resulting protrusions appear larger thantheir real width because of the convolution with the tip. Theheight of the protrusion is smaller with respect to what wasmeasured in the topographic tests (see Figure 2), related to thewear induced by tip sliding. Although the tip has a quite largeextension, it is able to resolve the flat regions among the
Figure 7. Average topographic line profiles on the 1000 nm pitch pattern (black line) and the corresponding TMR friction signal (blue line) relatedto: (a) air and (b) humidity-free ambient. The vertical red lines mark the correspondence between frictional and topographic features. The dashedcircles mark the discontinuities in TMR, which correspond to the collision of the tip with the nanostructures. In the graphs, both TMR and heightprofiles have been vertically shifted in order to set to zero the level of the flat portion.
protrusions, as expected from its radius of curvature. In viewingthe TMR profile (blue line), it is soon evident that incorrespondence with each protrusion, the signal shows areversed peak, which means a minimum in the friction force.What has to be noticed is that each TMR minimum is largerthan the width of the corresponding protrusion: in fact, inproximity of the nanostructure, but still on the untreatedsurface, the friction signal starts to decrease. On thenanostructure, the TMR further decreases down to itsminimum, which corresponds to the position where the tip isexactly on the groove. From this analysis, it follows that eachprotrusion is surrounded by a low-friction region which extendsin the flat area and that cannot be related to any geometricaleffect. The superposition of these regions generates a low-friction level, which extends along the entire pattern. In fact,looking at the TMR profile in panel (a), the level on theuntreated region on the very left (labeled A) is higher than thevalue found among the protrusions (labeled B). With carefulanalysis of each TMR reversed peak, a sort of discontinuity isevident at each left and right side (marked by the dottedcircles), which corresponds to a sudden increase of friction.This discontinuity occurs at the position where the tip hits theborder of the protrusion, generating the so-called “collisioneffect”,16 on the left during trace and on the right duringretrace. This is further evidence that the low-friction regionbetween two protrusion starts well before the tip encountersthe nanostructures. The extension of this region is about 700nm from the side of the swollen border. It is straightforwardthat when the pitch decreases, the coupling betweenneighboring low-friction regions becomes more and moreeffective, up to a saturation value that we expect not too farfrom what was observed for the 125 nm pitch pattern.The situation is different in the case of dry conditions,
reported in Figure 7b. In this case, the average topographicprofile still shows protrusions separated by flat regions, but inthe corresponding TMR profile there is no evidence of theabove-described low-friction regions surrounding the nano-structures. In this case, the lateral extremes of the reversedpeaks in TMR exactly correspond to those of the protrusionsand are related to the decrease in the contact area. In addition,the TMR level in the regions among the nanostructures is thesame as that in the untreated region. Also in this case, but lessevident due to the higher average friction, the discontinuityrelated to the collision effect is recognizable by the side of thereversed peaks.These detailed analyses of the TMR signal further support
the thesis which relates the lower friction on the pattern to ahydrophobic effect induced by the nanostructures, where thecontact area contribution is very limited.These results are not in contrast with what was already
reported regarding the ability of patterns in decreasing thewettability related to air pocketing and well-modeled byCassie−Baxter theory. However, we suggest that there areother phenomena that inhibit the adsorption of water and theformation of capillary layer at the surfaces. We have shown thatthese phenomena are strictly related to every singlenanostructure and that the combination of them in an arraycan lead to an evident change in the tribological properties ofmaterials. The physical−chemical phenomena which are at thebasis of this hydrophobic character of the SiO2−Si(011) surfaceare not known at the moment.We can exclude the influence of secondary effects related to
FIB patterning, such as ion implantation or ion-induced
swelling, based on some considerations and strongly supportedby dedicated experimental tests, which are described in thefollowing: (i) The observed low-friction regions extend somehundreds of nanometers from the swelled borders. In order todetermine if there is an effect of ion bombardment in a regionso far from the patterned area, we performed Monte Carlosimulations using the TRIM code and shooting 30 keV Ga ionsperpendicular to a Si surface. The results show that both ionimplantation and structural damage have lateral and in-depthextensions which do not exceed 40−50 nm in length, so theycannot be the origin of the observed low-friction regions. (ii) Inaddition, the implantation profile shows that ion concentrationat the surface is negligible, while it has a maximum at about25−30 nm below the surface. This suggests that the topmostlayers of the flat and of the patterned regions should presentsimilar chemical characteristics, being constituted by amor-phous SiO2. (iii) The swelled regions clearly reveal that theFIB-treated regions are characterized by different mechanicalproperties, as their material density is lower than the untouchedSi. However, as already described, the friction tests wereperformed in the adhesive regime, where the influence of themechanical properties of the surface on tribology should be lessimportant. (iv) If the different mechanical properties of thepatterns would influence the tribological properties, thisinfluence should be present both in air and in dry conditions.On the contrary, in dry conditions, both adhesion and CoF arethe same on the patterns and on the flat surface.To support these statements a 10 × 10 μm2 square area of Si
surface was uniformly irradiated at the same conditions used tofabricate the nanogrooves. The resulting surface consists of asquare depression about 3.5 nm deep, reported in Figure SI.5 ofthe Supporting Information with the corresponding averageline profile. The morphology of the treated area is almost flat(RMS = 0.4 nm), thus excluding any contribution oftopography on the tribological properties. With the use ofthe same procedure described in Measurement Procedure,adhesion and CoF have been estimated and compared to theflat Si surface. The results show that both CoF and adhesion onthe uniformly irradiated area do not differ with respect to theuntreated region (see markers labeled “Ga+” and “Flat (Ga+)”in Figures 4c and in 6a. The results of these tests exclude thefact that the hydrophobic properties ascribed to the patternscan be related to any kind of secondary FIB effect, like Gaimplantation or amorphization.To understand the origins of the observed phenomena
further investigations are necessary, consisting in the study ofthe tribological properties of patterns fabricated with a differenttechnique, such as Electron Beam lithography.
IV. CONCLUSIONSThe present study shows that regular arrays of FIB-patternednanostructures, consisting of parallel nanogrooves withupturned borders, are able to modify the tribological propertiesof the Si(001) surface, depending on the periodicity of thegrooves. In particular, when the separation among the groovesfalls in the nanometric scales (i.e., 125 and 250 nm), both CoFand adhesion are lower with respect to the flat surface. Thiseffect is related to a hydrophobic character of the patternedsurface, as it has not been observed in humidity-free ambient.Approaching the microscale (i.e., for the pitches of 500 and1000 nm), this effect disappears. In particular, for the CoF, thetransition from the nano- to the microregimes is abrupt andtakes place between 250 and 500 nm. The origin of these
effects is not related to the different contact area between thetip and the patterns but to the presence of low-friction regionswhich surround every single nanogroove, which disappears inhumidity-free ambient. These hydrophobic regions completelyoverlap for 125 and 250 nm pitches, inducing an evidentdecrease of the CoF and adhesion. Tests on a uniformly FIB-irradiated region, at the same conditions used for patterngeneration, exclude a detectable contribution from secondaryFIB effects, such as ion implantation or crystal amorphization.
■ ASSOCIATED CONTENT*S Supporting InformationFigure SI.1 shows the methodology used in the friction tests.Figure SI.2 represents the same graph reported in Figure 2, butthe x- and y-axis scales are the same. The shape of the sphericalcap, reported as tip approximation, is more appreciable. FigureSI.3 is the graph of the lateral force reduction versus load.Figure SI.4 reports the graphs of the lateral force versus load for250 and 500 nm pitches in dry conditions. Figure SI.5 reportsthe AFM image of the region uniformly irradiated by FIB andthe corresponding line profile. This material is available free ofcharge via the Internet at http://pubs.acs.org.
■ AUTHOR INFORMATIONCorresponding Author*E-mail: [email protected] ContributionsThe manuscript was written through contributions of allauthors. All authors have given approval to the final version ofthe manuscript. These authors contributed equally.NotesThe authors declare no competing financial interest.
■ ACKNOWLEDGMENTSThe present research was funded by Centro Interdipartimentaleper la Ricerca Applicata e i Servizi nel settore della MeccanicaAvanzata e della Motoristica - INTERMECH MO.RE., locatedat the Faculty of Engineering “Enzo Ferrari”, University ofModena and Reggio Emilia, and by Regione Emilia Romagna,Italy.
■ REFERENCES(1) Burton, Z.; Bhushan, B. Hydrophobicity, Adhesion, and FrictionProperties of Nanopatterned Polymers and Scale Dependence forMicro- and Nanoelectromechanical Systems. Nano Lett. 2005, 5 (8),1607−1613.(2) Wang, Y.; Wang, L.; Xue, Q.; Yuan, N.; Ding, J. A Facile Methodto Improve Tribological Properties of Silicon Surface by CombiningNanogrooves Patterning and Thin Film Lubrication. Colloids Surf., A2010, 372, 139−145.(3) Zhao, W.; Wang, L. Design and Fabrication of NanopillarPatterned Au Textures for Improving Nanotribological Performance.Q. Xue. ACS Appl. Mater. Interfaces 2010, 2 (3), 788−794.(4) Pham, D. C.; Na, K.; Piao, S.; Cho, I.-J.; Jhang, K.-Y.; Yoon, E.-S.Wetting Behaviour and Tribological Properties of Silicon Nano-patterns Combined with Diamond-Like Carbon and Perlfluoropoly-teher Films. Nanotechnology 2011, 22, 395303−395317.(5) Pham, D.-C.; Na, K.; Piao, S.; Yang, S.; Kim, J.; Yoon, E.-S.Hydrophobicity and Micro-/Nanotribological Properties of PolymericNanolines. Surf. Eng. 2011, 27 (4), 286−293.(6) Corbella, C.; Portal-Marco, S.; Rubio-Roy, M.; Bertran, E.;Oncins, G.; Vallve, M. A.; Ignes-Mullol, J.; Andujar, J. L. ModifyingSurface Properties of Diamond-Like Carbon Films via Nanotexturing.J. Phys. D: Appl. Phys. 2011, 44, 395301−395311.
(7) Marchetto, D.; Rota, A.; Calabri, L.; Gazzadi, G. C.; Menozzi, C.;Valeri, S. AFM Investigation of Tribological Properties of Nano-Patterned Silicon Surface. Wear 2008, 265, 577−582.(8) Marchetto, D.; Rota, A.; Calabri, L.; Gazzadi, G. C.; Menozzi, C.;Valeri, S. Hydrophobic Effect of Surface Patterning on Si Surface.Wear 2010, 268, 488−492.(9) Wenzel, R. N. Resistance of Solid Surfaces to Wetting by Water.Ind. Eng. Chem. 1936, 28, 988−994.(10) Maboudian, R.; Howe, R. T. Critical Review: Adhesion inSurface Micromechanic Structures. J. Vac. Sci. Technol., B 1997, 15 (1),1−20.(11) Sader, J. E.; Chown, J. W. M.; Mulvaney, P. Calibration ofRectangular Atomic Force Microscope Cantilevers. Rev. Sci. Instrum.1999, 70, 3967−3969.(12) Rota, A.; Contri, S. F.; Gazzadi, G. C.; Cottafava, S.; Gualtieri,E.; Valeri, S. Focused Ion Beam Induced Swelling in MgO(001). Surf.Sci. 2006, 600, 3718−3722.(13) Lugstein, A.; Basnar, B.; Hobler, G.; Bertagnolli, E. CurrentDensity Profile Extraction of Focused Ion Beams Based on AtomicForce Microscopy Contour Profiling of Nanodots. J. Appl. Phys. 2002,92 (7), 4037−4042.(14) Carpick, R. W.; Agraıt, N.; Ogletree, D. F.; Salmeron, M.Measurement of Interfacial Shear (Friction) with an UltrahighVacuum Atomic Force Microscope. J. Vac. Sci. Technol., B 1995, 14(2), 1289−1295.(15) Cheng, Y.-T.; Rodak, D. E. Is the Lotus Leaf Superhydrophobic?Appl. Phys. Lett. 2005, 86, 144101−144103.(16) Sundararajan, S.; Bhushan, B. Topography-Induced Contribu-tions to Friction Forces Measured Using an Atomic Force/FrictionForce Microscope. J. Appl. Phys. 2000, 88 (8), 4825−4831.