Enter-Vet Report 2007-2008 Centro di referenza nazionale per le salmonellosi C E N T R O D I R E F E R E N Z A N A Z I O N A L E SALMONELLOSI Istituto Zooprofilattico Sperimentale delle Venezie
Transcript
Enter-Vet Report 2007-2008
Centro di referenza nazionale per le salmonellosi
CEN
TRO D
I REFERENZA NAZION
ALE
SALMONELLOSIIstituto Zooprofilattico Sperimentale delle Venezie
Enter-Vet Report 2007-2008
CEN
TRO D
I REFERENZA NAZION
ALE
SALMONELLOSIIstituto Zooprofilattico Sperimentale delle Venezie
Centro di referenza nazionale per le salmonellosi
Enter-Vet Report 2007-2008
A cura di | EditorsAntonia Ricci, Marzia Mancin, Lisa Barco, Veronica Cibin
Centro di referenza nazionale per le salmonellosiIstituto Zooprofilattico Sperimentale delle VenezieViale dell’Università n. 10-35020 Legnaro (PD)Tel.: +39 049 8084296 – 283 – 293; fax: +39 049 8830268E-mail: [email protected]
Con la collaborazione tecnica di | With the collaboration of:Kety Antonello, Maria Cristina Dalla Pozza, Marafin Elisa, Claudio Minorello, Elena Ramon, Cristina Saccardin, Paola Zavagnin
Progetto grafico e impaginazione | Design & productionValentina BoscoloSC7 Comunicazione e conoscenza per la salute - IZSVe
I lettori che desiderano informazioni e aggiornamenti sulle attività dell’Istituto Zooprofilattico Sperimentale delle Venezie possono visitare il sito web www.izsvenezie.it
Enter-Vet Report 2007-2008
�
Prefazione
Il Report 2007-2008 ricalca in linea di massima il layout degli anni precedenti e si articola nelle se-guenti sezioni:
riepilogo delle notificheesiti di sierotipizzazioneesiti della fagotipizzazione di Salmonella Enteritidis e Salmonella Typhimurium,esiti della determinazione del profilo di antibioticoresistenza.
Quando disponibili sono riportati i dati raccolti nei precedenti anni di attività a titolo di confronto. Tuttavia deve essere prestata particolare attenzione nella comparazione di tali dati, dal momento che fluttuazioni nelle prevalenze potrebbero essere attribuibili a variazioni nel numero e nella tipo-logia di campioni esaminati.Per quanto riguarda la sorveglianza della resistenza agli antibiotici, dal momento che rappresen-ta una priorità per la Commissione Europea, anche nel presente report, come già fatto in quello precedente, si è ampliato il livello di dettaglio dei dati raccolti al fine di fornire un’informazione più esaustiva. Anche in questo report vengono forniti in dettaglio i dati relativi alla resistenza agli antimicrobici come previsto anche dalla direttiva 2003/99.A garanzia della qualità dei dati raccolti e delle prestazioni dei laboratori partecipanti il Centro di re-ferenza nazionale per le salmonellosi organizza annualmente circuiti interlaboratorio di isolamento di Salmonella spp. e sierotipizzazione a cui prendono parte i laboratori afferenti alla rete Enter-Vet.Si ricorda inoltre che i report annuali Enter-Vet, a partire dal 2004, sono disponibili anche on-line, accedendo al sito www.izsvenezie.it, quindi alle pagine dedicate al Centro di referenza nazionale per le salmonellosi (sezione Centri di eccellenza), alla voce “attività e servizi”. Consultando le pagine del Centro potrete inoltre scaricare le più recenti normative sulle salmonellosi e la documentazione relativa ai piani di monitoraggio e controllo attualmente in vigore.Nel ringraziare tutti coloro che hanno partecipato alla realizzazione di questo lavoro, e in partico-lare i colleghi degli Istituti Zooprofilattici che raccolgono e inviano i dati, saremmo lieti di ricevere da tutti coloro che utilizzano queste informazioni commenti e suggerimenti che possano aiutare a migliorare la nostra attività.
Antonia Riccidirettore del Centro di referenza nazionale e OIE per le salmonellosi
••••
Enter-Vet Report 2007-2008
�
Elenco dei laboratori di riferimentoEnter-Vet net Laboratories
Istituto Zooprofilattico Sperimentale Piemonte, Liguria e Valle d’AostaVia Bologna, 148 10154 TorinoReferente | Contact person: dott.ssa Lucia De CastelliLaboratorio controllo alimentiTel 011/2686303 | Fax 011/2473450e-mail: [email protected]
Istituto Zooprofilattico Sperimentale Lombardia ed Emilia RomagnaVia A. Bianchi, 9 25124 BresciaReferente | Contact person: dott.ssa Silvia Tagliabue Dipartimento di diagnostica specializzata – Reparto di batteriologia sSpecializzataTel 030/2290323 | Fax 030/2290570e-mail: [email protected]
Istituto Zooprofilattico Sperimentale Umbria e MarcheVia G. Salvemini, 1 06126 PerugiaReferente | Contact person: dott.ssa Stefania ScuotaLaboratorio di microbiologia degli alimentiTel 075/343269 | Fax 075/35047e-mail: [email protected]
Istituto Zooprofilattico Sperimentale Umbria e Marche (sezione di Macerata)Via dei Velini, 11 62100 MacerataReferente | Contact person: dott.ssa Monica StaffolaniTel 0733/262206 | Fax 0733/262069e-mail: [email protected]
Istituto Zooprofilattico Sperimentale Lazio e ToscanaVia Appia Nuova, 1411 00178 RomaReferente | Contact person: dott. Stefano BileiMicrobiologia degli alimenti Tel 06/79099423 | Fax 06/79340724e-mail: [email protected]
Istituto Zooprofilattico Sperimentale Lazio e ToscanaVia Appia Nuova, 1411 00178 RomaReferente | Contact person: dott. Antonio BattistiCentro di referenza nazionale per l’antibioticoresistenzaTel 06/79099469 | Fax 06/79340724e-mail: [email protected]
Istituto Zooprofilattico Sperimentale Abruzzo e MoliseCampo Boario, 64100 TeramoReferente | Contact person: dott.ssa Elisabetta Di GiannataleReparto di Igiene delle tecnologie alimentari e dell’alimentazione animaleTel 0861/332259 | Fax 0861/332251e-mail: [email protected]
Enter-Vet Report 2007-2008
�
Istituto Zooprofilattico Sperimentale del MezzogiornoVia Salute, 2 80055 Portici (Na)Referente | Contact person: dott.ssa. Maria Rosaria CarulloDipartimento di ispezione degli alimenti di origine animaleTel 081/7865213 | Fax 081/7766495e-mail: [email protected]
Istituto Zooprofilattico Sperimentale della SiciliaVia Gino Marinuzzi 3, 90129 PalermoReferente | Contact person: dott.ssa Annamaria di NotoArea di Microbiologia degli alimentiTel 091/6565226 | Fax 091/6565362e-mail: [email protected]
Istituto Zooprofilattico Sperimentale della SardegnaVia Duca degli Abruzzi, 8 07100 Sassari Referente | Contact person: dott. Antonio VidiliDipartimento Territoriale di OristanoLaboratorio di Diagnostica clinica e anatomia patologicaVia Atene-Zona Industriale 09170 OristanoTel 0783/351003 | Fax 0783/58931e-mail: [email protected]
Enter-Vet Report 2007-2008
�
Riepilogo delle notifiche
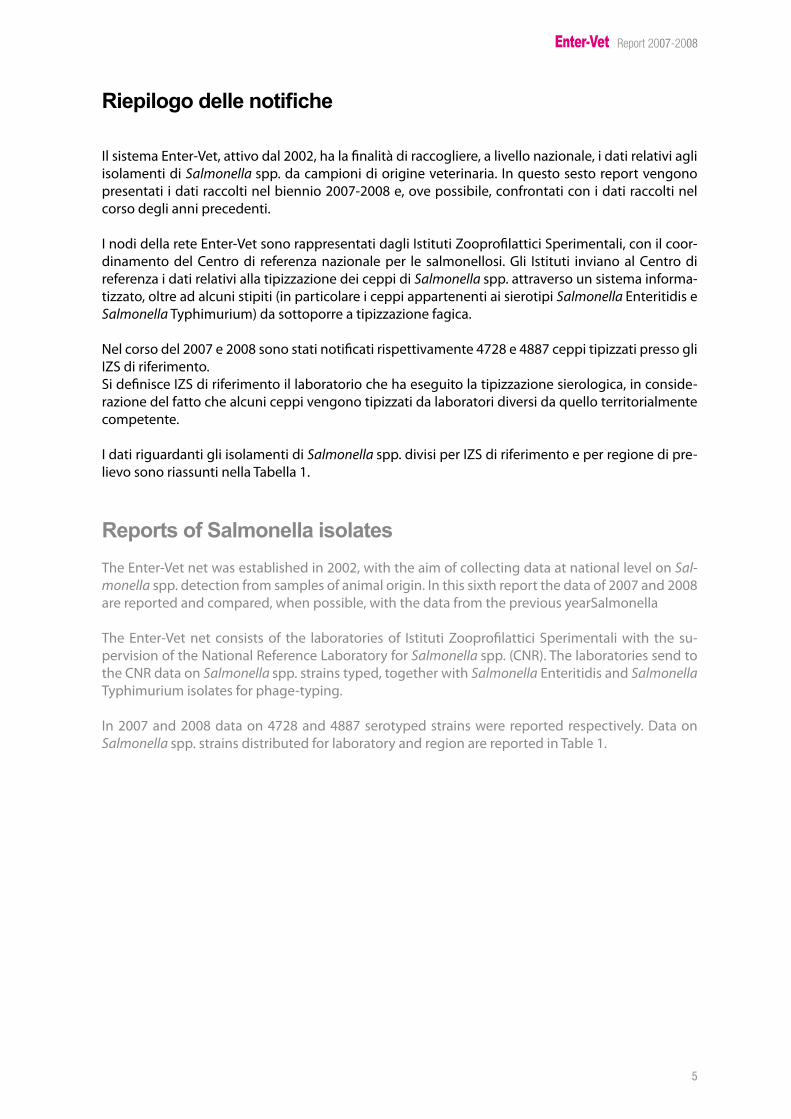
Il sistema Enter-Vet, attivo dal 2002, ha la finalità di raccogliere, a livello nazionale, i dati relativi agli isolamenti di Salmonella spp. da campioni di origine veterinaria. In questo sesto report vengono presentati i dati raccolti nel biennio 2007-2008 e, ove possibile, confrontati con i dati raccolti nel corso degli anni precedenti.
I nodi della rete Enter-Vet sono rappresentati dagli Istituti Zooprofilattici Sperimentali, con il coor-dinamento del Centro di referenza nazionale per le salmonellosi. Gli Istituti inviano al Centro di referenza i dati relativi alla tipizzazione dei ceppi di Salmonella spp. attraverso un sistema informa-tizzato, oltre ad alcuni stipiti (in particolare i ceppi appartenenti ai sierotipi Salmonella Enteritidis e Salmonella Typhimurium) da sottoporre a tipizzazione fagica.
Nel corso del 2007 e 2008 sono stati notificati rispettivamente 4728 e 4887 ceppi tipizzati presso gli IZS di riferimento. Si definisce IZS di riferimento il laboratorio che ha eseguito la tipizzazione sierologica, in conside-razione del fatto che alcuni ceppi vengono tipizzati da laboratori diversi da quello territorialmente competente.
I dati riguardanti gli isolamenti di Salmonella spp. divisi per IZS di riferimento e per regione di pre-lievo sono riassunti nella Tabella 1.
Reports of Salmonella isolates The Enter-Vet net was established in 2002, with the aim of collecting data at national level on Sal-monella spp. detection from samples of animal origin. In this sixth report the data of 2007 and 2008 are reported and compared, when possible, with the data from the previous yearSalmonella
The Enter-Vet net consists of the laboratories of Istituti Zooprofilattici Sperimentali with the su-pervision of the National Reference Laboratory for Salmonella spp. (CNR). The laboratories send to the CNR data on Salmonella spp. strains typed, together with Salmonella Enteritidis and Salmonella Typhimurium isolates for phage-typing.
In 2007 and 2008 data on 4728 and 4887 serotyped strains were reported respectively. Data on Salmonella spp. strains distributed for laboratory and region are reported in Table 1.
Enter-Vet Report 2007-2008
�
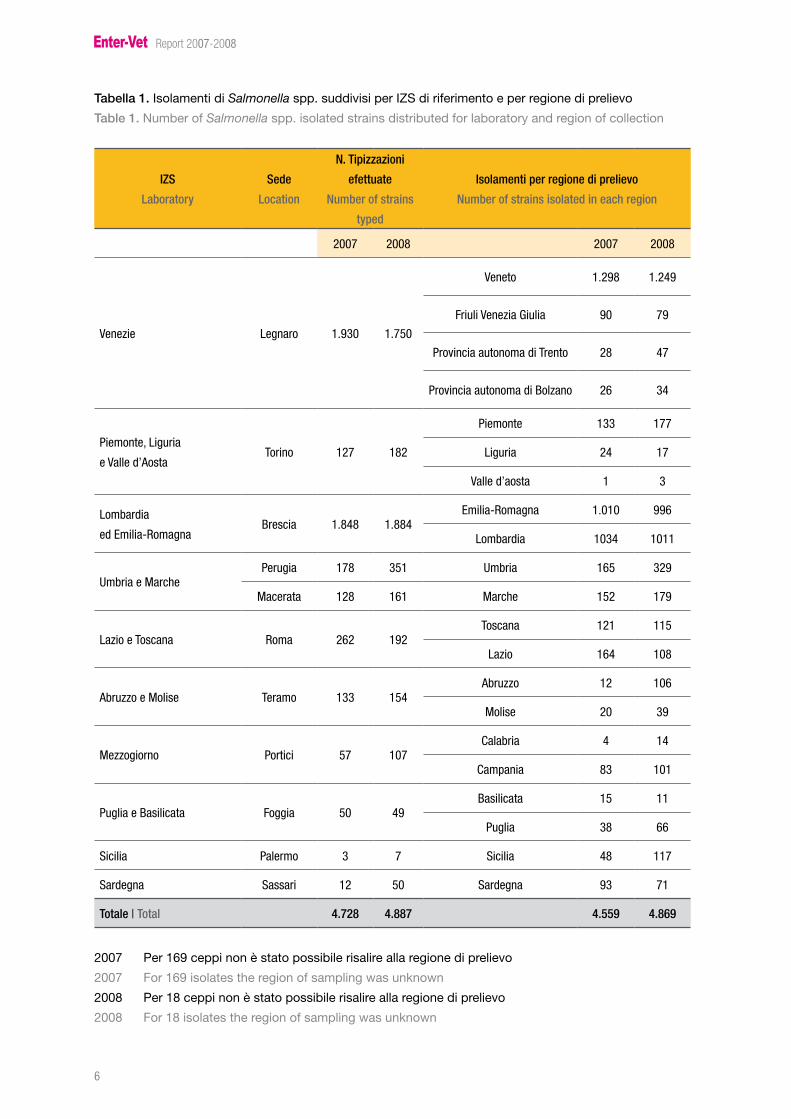
Tabella 1. Isolamenti di Salmonella spp. suddivisi per IZS di riferimento e per regione di prelievo
Table 1. Number of Salmonella spp. isolated strains distributed for laboratory and region of collection
IZS
Laboratory
Sede
Location
N. Tipizzazioni
efettuate
Number of strains
typed
Isolamenti per regione di prelievo
Number of strains isolated in each region
2007 2008 2007 2008
Venezie Legnaro �.9�0 �.7�0
Veneto �.298 �.2�9
Friuli Venezia Giulia 90 79
Provincia autonoma di Trento 28 �7
Provincia autonoma di Bolzano 2� ��
Piemonte, Liguria
e Valle d’AostaTorino �27 �82
Piemonte ��� �77
Liguria 2� �7
Valle d’aosta � �
Lombardia
ed Emilia-RomagnaBrescia �.8�8 �.88�
Emilia-Romagna �.0�0 99�
Lombardia �0�� �0��
Umbria e MarchePerugia �78 ��� Umbria ��� �29
Macerata �28 ��� Marche ��2 �79
Lazio e Toscana Roma 2�2 �92Toscana �2� ���
Lazio ��� �08
Abruzzo e Molise Teramo ��� ���Abruzzo �2 �0�
Molise 20 �9
Mezzogiorno Portici �7 �07Calabria � ��
Campania 8� �0�
Puglia e Basilicata Foggia �0 �9Basilicata �� ��
Puglia �8 ��
Sicilia Palermo � 7 Sicilia �8 ��7
Sardegna Sassari �2 �0 Sardegna 9� 7�
Totale | Total 4.728 4.887 4.559 4.869
2007 Per 169 ceppi non è stato possibile risalire alla regione di prelievo
2007 For 169 isolates the region of sampling was unknown
2008 Per 18 ceppi non è stato possibile risalire alla regione di prelievo
2008 For 18 isolates the region of sampling was unknown
Enter-Vet Report 2007-2008
7
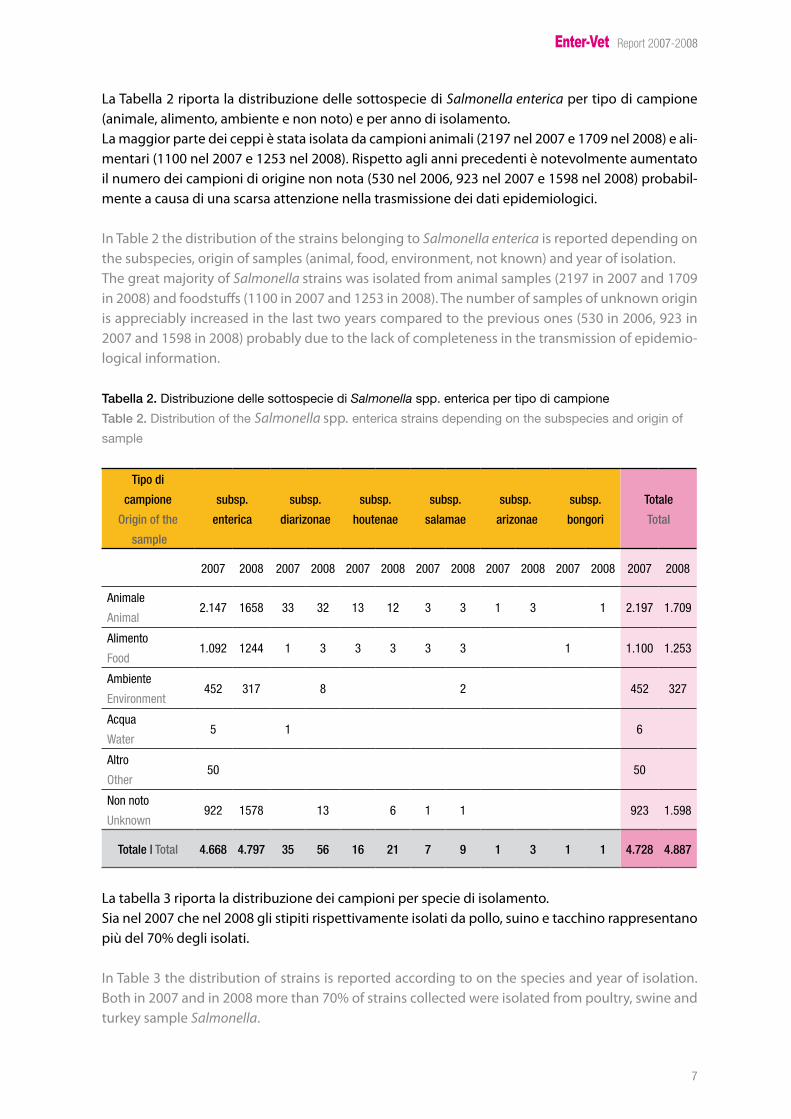
La Tabella 2 riporta la distribuzione delle sottospecie di Salmonella enterica per tipo di campione (animale, alimento, ambiente e non noto) e per anno di isolamento.La maggior parte dei ceppi è stata isolata da campioni animali (2197 nel 2007 e 1709 nel 2008) e ali-mentari (1100 nel 2007 e 1253 nel 2008). Rispetto agli anni precedenti è notevolmente aumentato il numero dei campioni di origine non nota (530 nel 2006, 923 nel 2007 e 1598 nel 2008) probabil-mente a causa di una scarsa attenzione nella trasmissione dei dati epidemiologici.
In Table 2 the distribution of the strains belonging to Salmonella enterica is reported depending on the subspecies, origin of samples (animal, food, environment, not known) and year of isolation.The great majority of Salmonella strains was isolated from animal samples (2197 in 2007 and 1709 in 2008) and foodstuffs (1100 in 2007 and 1253 in 2008). The number of samples of unknown origin is appreciably increased in the last two years compared to the previous ones (530 in 2006, 923 in 2007 and 1598 in 2008) probably due to the lack of completeness in the transmission of epidemio-logical information.
Tabella 2. Distribuzione delle sottospecie di Salmonella spp. enterica per tipo di campione
Table 2. Distribution of the Salmonella spp. enterica strains depending on the subspecies and origin of
Totale | Total 4.668 4.797 35 56 16 21 7 9 1 3 1 1 4.728 4.887
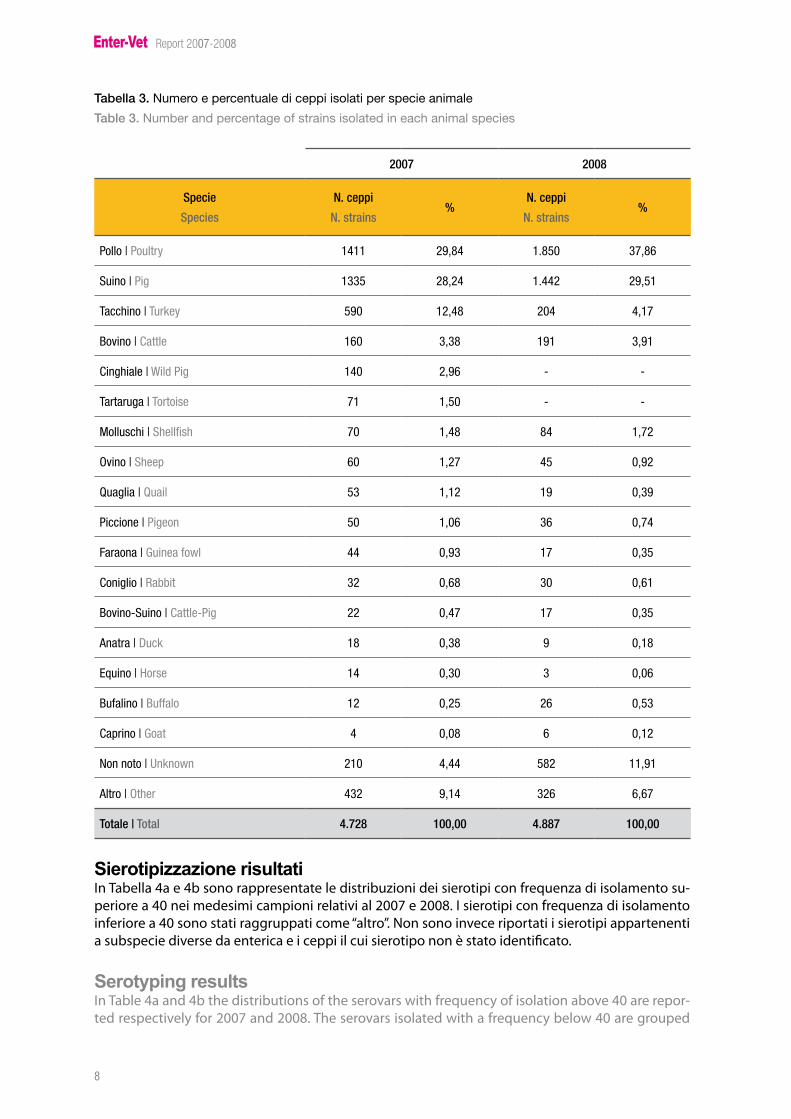
La tabella 3 riporta la distribuzione dei campioni per specie di isolamento. Sia nel 2007 che nel 2008 gli stipiti rispettivamente isolati da pollo, suino e tacchino rappresentano più del 70% degli isolati.
In Table 3 the distribution of strains is reported according to on the species and year of isolation. Both in 2007 and in 2008 more than 70% of strains collected were isolated from poultry, swine and turkey sample Salmonella.
Enter-Vet Report 2007-2008
8
Tabella 3. Numero e percentuale di ceppi isolati per specie animale
Table 3. Number and percentage of strains isolated in each animal species
2007 2008
Specie
Species
N. ceppi
N. strains%
N. ceppi
N. strains%
Pollo | Poultry ���� 29,8� �.8�0 �7,8�
Suino | Pig ���� 28,2� �.��2 29,��
Tacchino | Turkey �90 �2,�8 20� �,�7
Bovino | Cattle ��0 �,�8 �9� �,9�
Cinghiale | Wild Pig ��0 2,9� - -
Tartaruga | Tortoise 7� �,�0 - -
Molluschi | Shellfish 70 �,�8 8� �,72
Ovino | Sheep �0 �,27 �� 0,92
Quaglia | Quail �� �,�2 �9 0,�9
Piccione | Pigeon �0 �,0� �� 0,7�
Faraona | Guinea fowl �� 0,9� �7 0,��
Coniglio | Rabbit �2 0,�8 �0 0,��
Bovino-Suino | Cattle-Pig 22 0,�7 �7 0,��
Anatra | Duck �8 0,�8 9 0,�8
Equino | Horse �� 0,�0 � 0,0�
Bufalino | Buffalo �2 0,2� 2� 0,��
Caprino | Goat � 0,08 � 0,�2
Non noto | Unknown 2�0 �,�� �82 ��,9�
Altro | Other ��2 9,�� �2� �,�7
Totale | Total 4.728 100,00 4.887 100,00
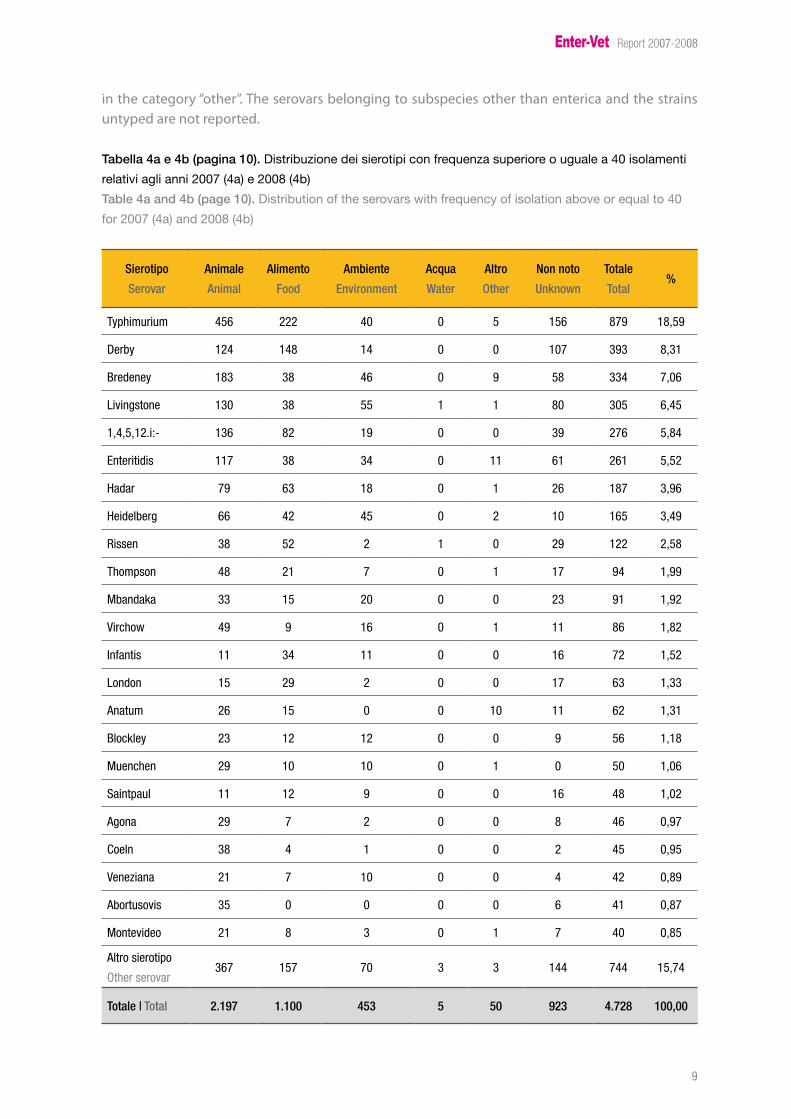
Sierotipizzazione risultati In Tabella 4a e 4b sono rappresentate le distribuzioni dei sierotipi con frequenza di isolamento su-periore a 40 nei medesimi campioni relativi al 2007 e 2008. I sierotipi con frequenza di isolamento inferiore a 40 sono stati raggruppati come “altro”. Non sono invece riportati i sierotipi appartenenti a subspecie diverse da enterica e i ceppi il cui sierotipo non è stato identificato.
Serotyping results In Table 4a and 4b the distributions of the serovars with frequency of isolation above 40 are repor-ted respectively for 2007 and 2008. The serovars isolated with a frequency below 40 are grouped
Enter-Vet Report 2007-2008
9
in the category “other”. The serovars belonging to subspecies other than enterica and the strains untyped are not reported.
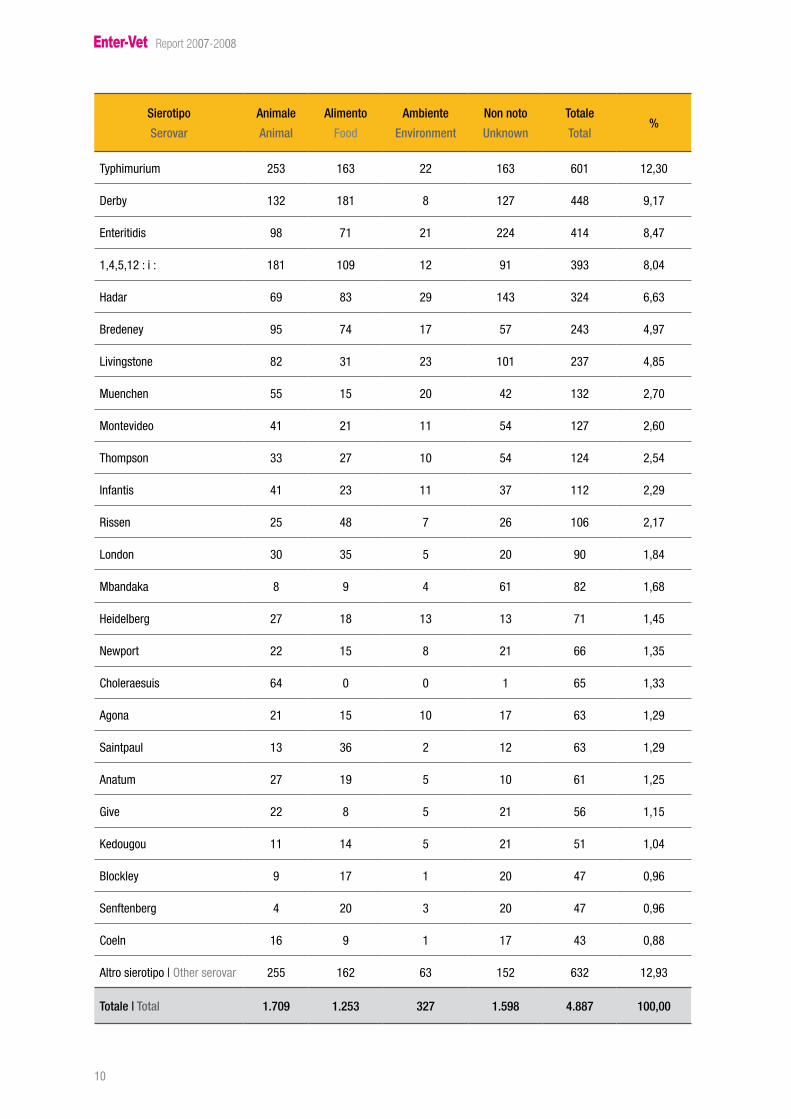
Tabella 4a e 4b (pagina 10). Distribuzione dei sierotipi con frequenza superiore o uguale a 40 isolamenti
relativi agli anni 2007 (4a) e 2008 (4b)
Table 4a and 4b (page 10). Distribution of the serovars with frequency of isolation above or equal to 40
for 2007 (4a) and 2008 (4b)
Sierotipo
Serovar
Animale
Animal
Alimento
Food
Ambiente
Environment
Acqua
Water
Altro
Other
Non noto
Unknown
Totale
Total%
Typhimurium ��� 222 �0 0 � ��� 879 �8,�9
Derby �2� ��8 �� 0 0 �07 �9� 8,��
Bredeney �8� �8 �� 0 9 �8 ��� 7,0�
Livingstone ��0 �8 �� � � 80 �0� �,��
�,�,�,�2.i:- ��� 82 �9 0 0 �9 27� �,8�
Enteritidis ��7 �8 �� 0 �� �� 2�� �,�2
Hadar 79 �� �8 0 � 2� �87 �,9�
Heidelberg �� �2 �� 0 2 �0 ��� �,�9
Rissen �8 �2 2 � 0 29 �22 2,�8
Thompson �8 2� 7 0 � �7 9� �,99
Mbandaka �� �� 20 0 0 2� 9� �,92
Virchow �9 9 �� 0 � �� 8� �,82
Infantis �� �� �� 0 0 �� 72 �,�2
London �� 29 2 0 0 �7 �� �,��
Anatum 2� �� 0 0 �0 �� �2 �,��
Blockley 2� �2 �2 0 0 9 �� �,�8
Muenchen 29 �0 �0 0 � 0 �0 �,0�
Saintpaul �� �2 9 0 0 �� �8 �,02
Agona 29 7 2 0 0 8 �� 0,97
Coeln �8 � � 0 0 2 �� 0,9�
Veneziana 2� 7 �0 0 0 � �2 0,89
Abortusovis �� 0 0 0 0 � �� 0,87
Montevideo 2� 8 � 0 � 7 �0 0,8�
Altro sierotipo
Other serovar��7 ��7 70 � � ��� 7�� ��,7�
Totale | Total 2.197 1.100 453 5 50 923 4.728 100,00
Enter-Vet Report 2007-2008
�0
Sierotipo
Serovar
Animale
Animal
Alimento
Food
Ambiente
Environment
Non noto
Unknown
Totale
Total%
Typhimurium 2�� ��� 22 ��� �0� �2,�0
Derby ��2 �8� 8 �27 ��8 9,�7
Enteritidis 98 7� 2� 22� ��� 8,�7
�,�,�,�2 : i : �8� �09 �2 9� �9� 8,0�
Hadar �9 8� 29 ��� �2� �,��
Bredeney 9� 7� �7 �7 2�� �,97
Livingstone 82 �� 2� �0� 2�7 �,8�
Muenchen �� �� 20 �2 ��2 2,70
Montevideo �� 2� �� �� �27 2,�0
Thompson �� 27 �0 �� �2� 2,��
Infantis �� 2� �� �7 ��2 2,29
Rissen 2� �8 7 2� �0� 2,�7
London �0 �� � 20 90 �,8�
Mbandaka 8 9 � �� 82 �,�8
Heidelberg 27 �8 �� �� 7� �,��
Newport 22 �� 8 2� �� �,��
Choleraesuis �� 0 0 � �� �,��
Agona 2� �� �0 �7 �� �,29
Saintpaul �� �� 2 �2 �� �,29
Anatum 27 �9 � �0 �� �,2�
Give 22 8 � 2� �� �,��
Kedougou �� �� � 2� �� �,0�
Blockley 9 �7 � 20 �7 0,9�
Senftenberg � 20 � 20 �7 0,9�
Coeln �� 9 � �7 �� 0,88
Altro sierotipo | Other serovar 2�� ��2 �� ��2 ��2 �2,9�
Totale | Total 1.709 1.253 327 1.598 4.887 100,00
Enter-Vet Report 2007-2008
��
Dalle Tabelle 4a e 4b si evince che il sierotipo più frequentemente isolato risulta essere Salmonella Typhimurium con una frequenza pari a 18,59% nel 2007 e 12,3% nel 2008, seguito da Salmonella Derby (frequenza pari a 8,31% nel 2007 e 9,17% nel 2008). Altri sierotipi isolati con frequenza eleva-ta risultano essere Salmonella Enteritidis (5,52% nel 2007 e 8,47% nel 2008) e il sierotipo monofasico 1,4,5,12:i:- (5,84% nel 2007 e 8,04% nel 2008). Nel 2008 si è registrato un leggero decremento rispet-to agli anni precedenti nelle percentuali di isolamento di Salmonella Bredeney (7,06% nel 2007 e 4,97% nel 2008,) e Salmonella Livingstone (6,45% nel 2007 e 4,85% nel 2008). Di rilievo inoltre il pro-gressivo incremento degli isolamenti di Salmonella Hadar (3,96% nel 2007 and 6,63% nel 2008).
Tables 4a and 4b show that the most common serovar is Salmonella Typhimurium (frequency equal to 18,59% in 2007 and 12,3% in 2008) followed by Salmonella Derby (frequency equal to 8,31% in 2007 and 9,17% in 2008). Other commonly isolated serovars are Salmonella Enteritidis (5,52% in 2007 and 8,47% in 2008) and the monophasic serovar 1,4,5,12:i:- (5,84% in 2007 and 8,04% in 2008). In 2008 a decrease in the isolation of Salmonella Bredeney (7,06% in 2007 and 4,97% in 2008) and Salmonella Livingstone (6,45% in 2007 and 4,85% in 2008) was reported. On the other hand the increased number of Salmonella Hadar isolates reported in 2008 is noteworthy (3,96% in 2007 and 6,63% in 2008).
Enter-Vet Report 2007-2008
�2
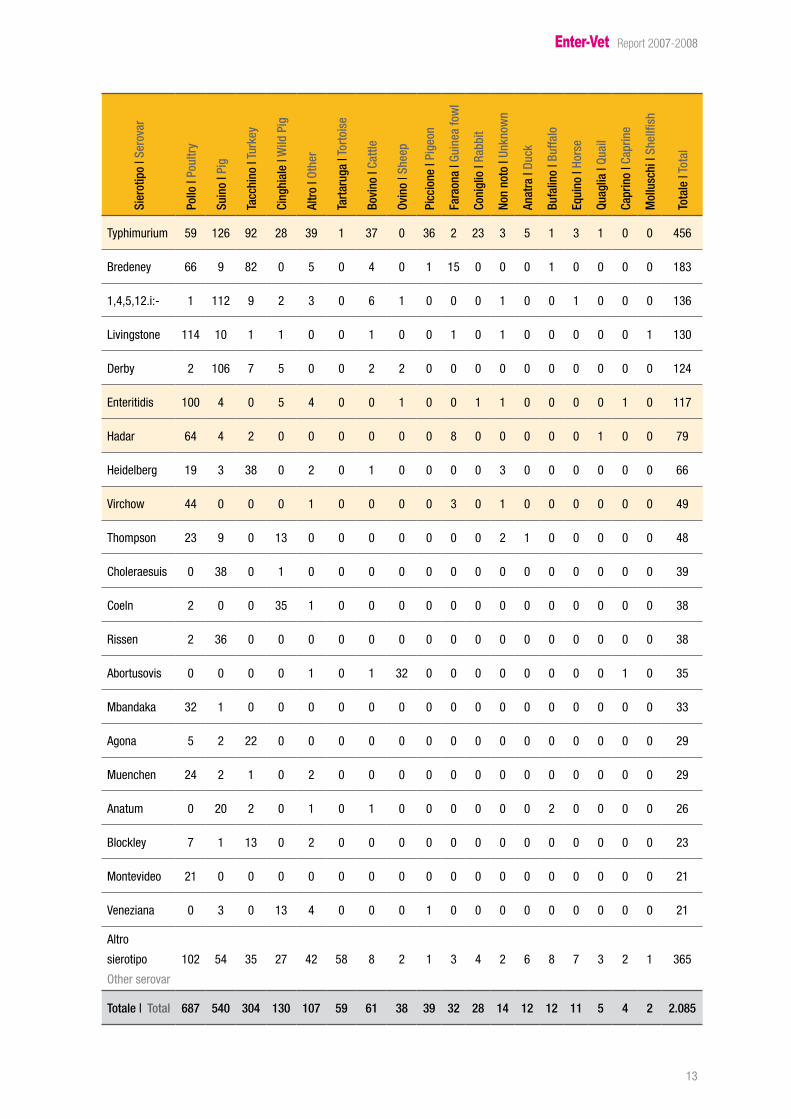
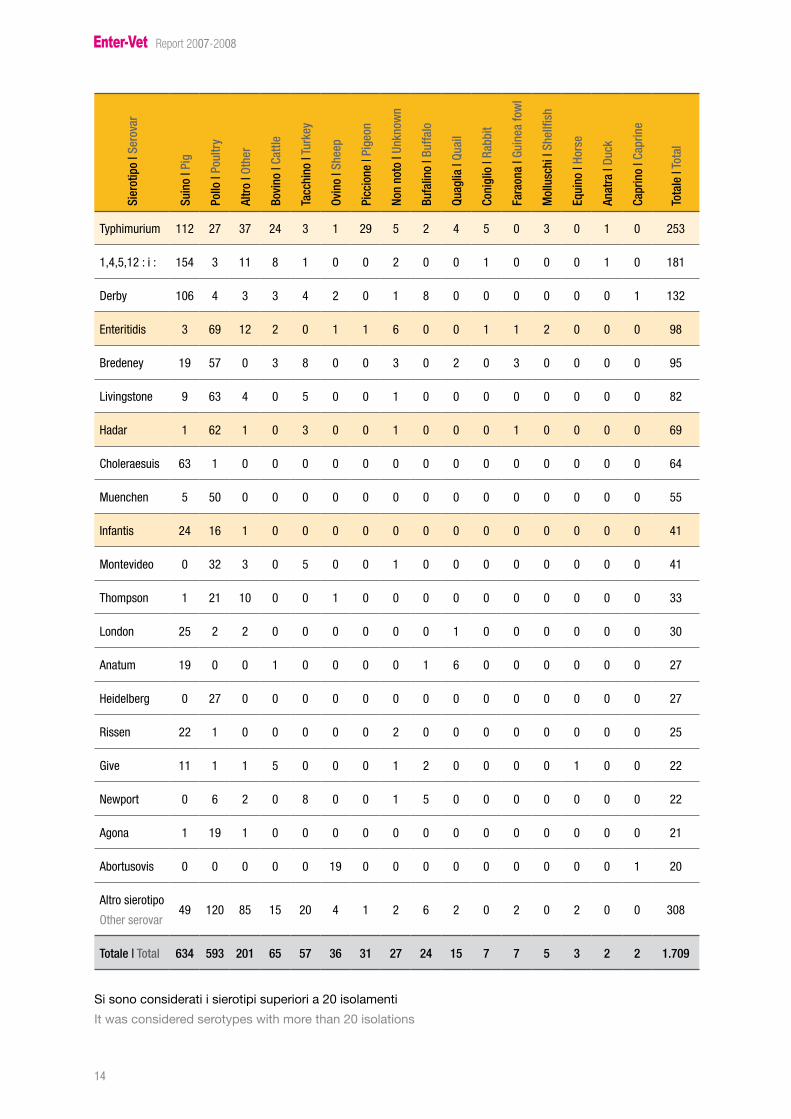
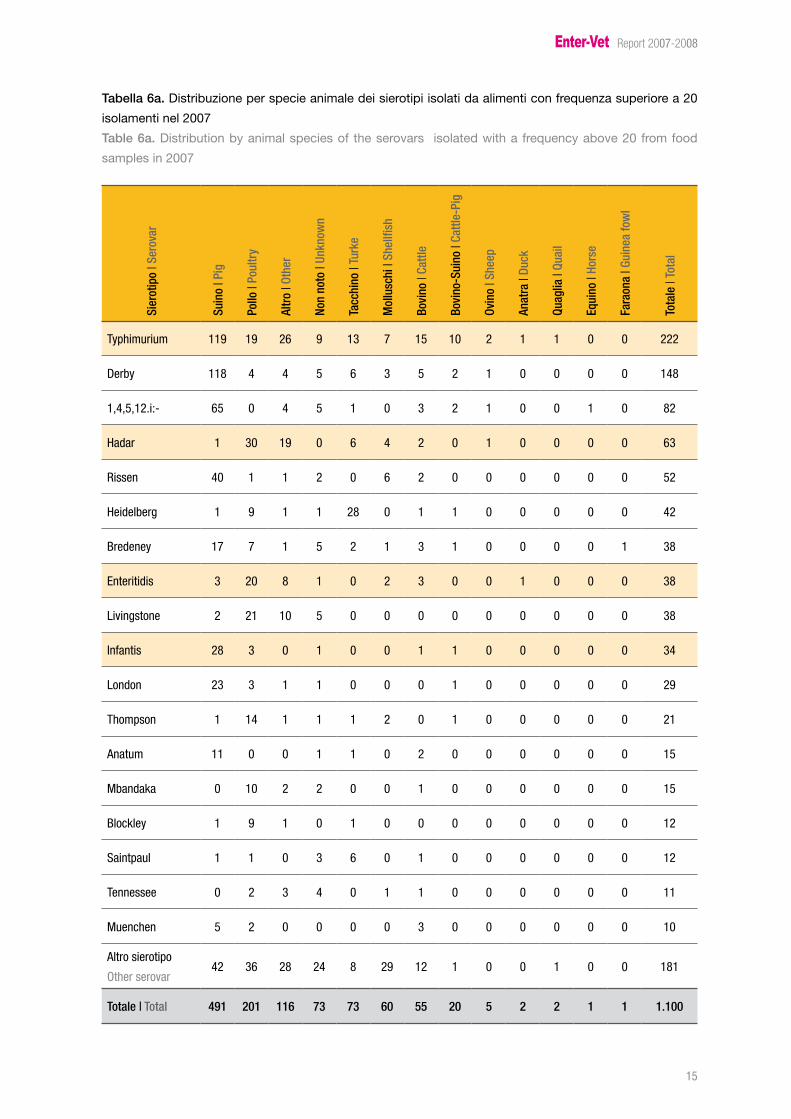
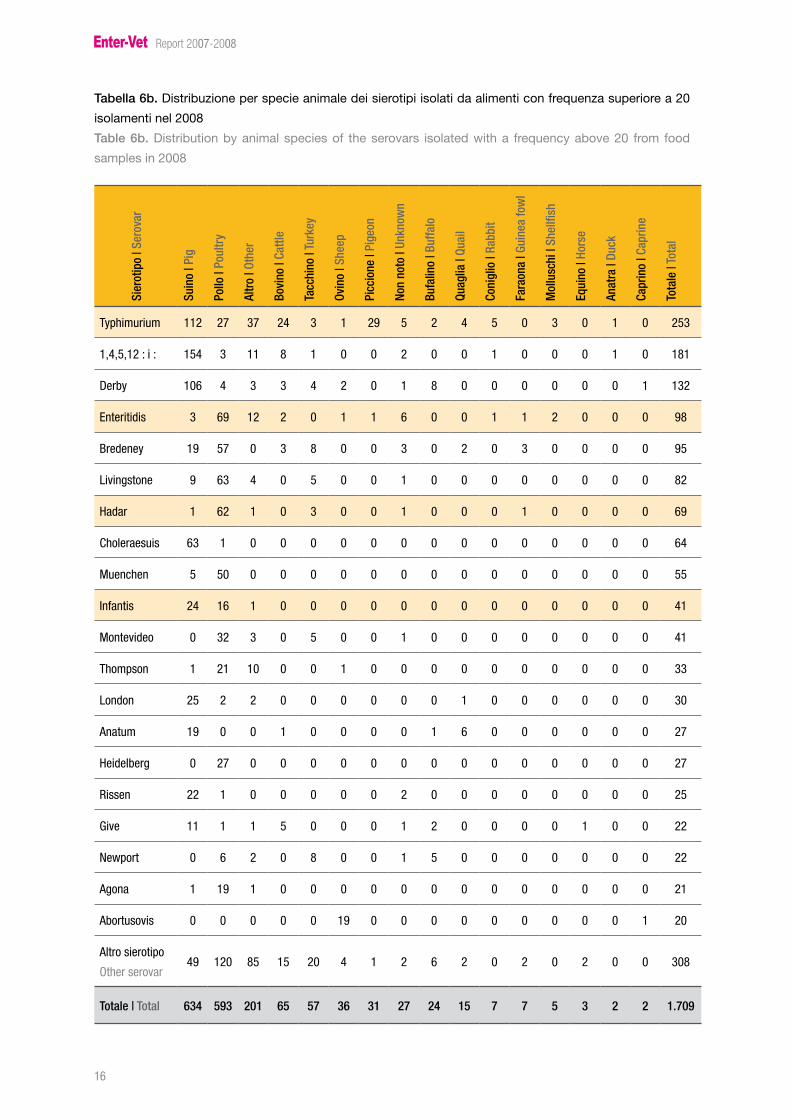
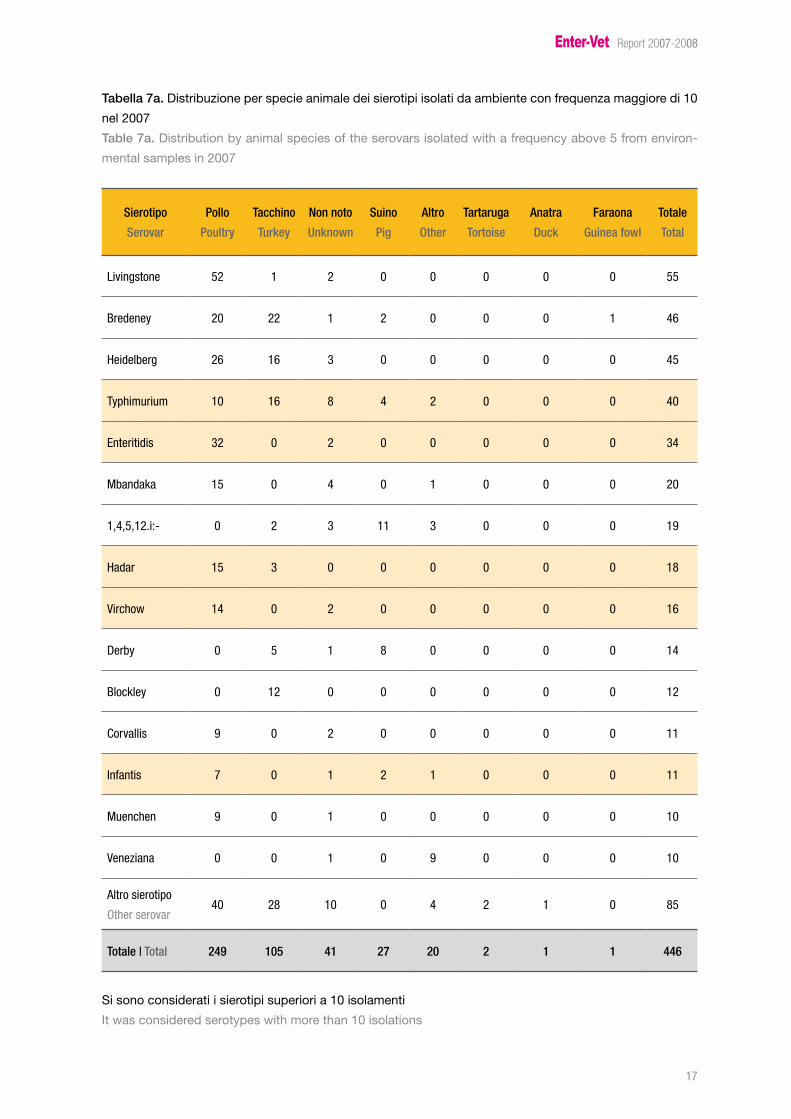
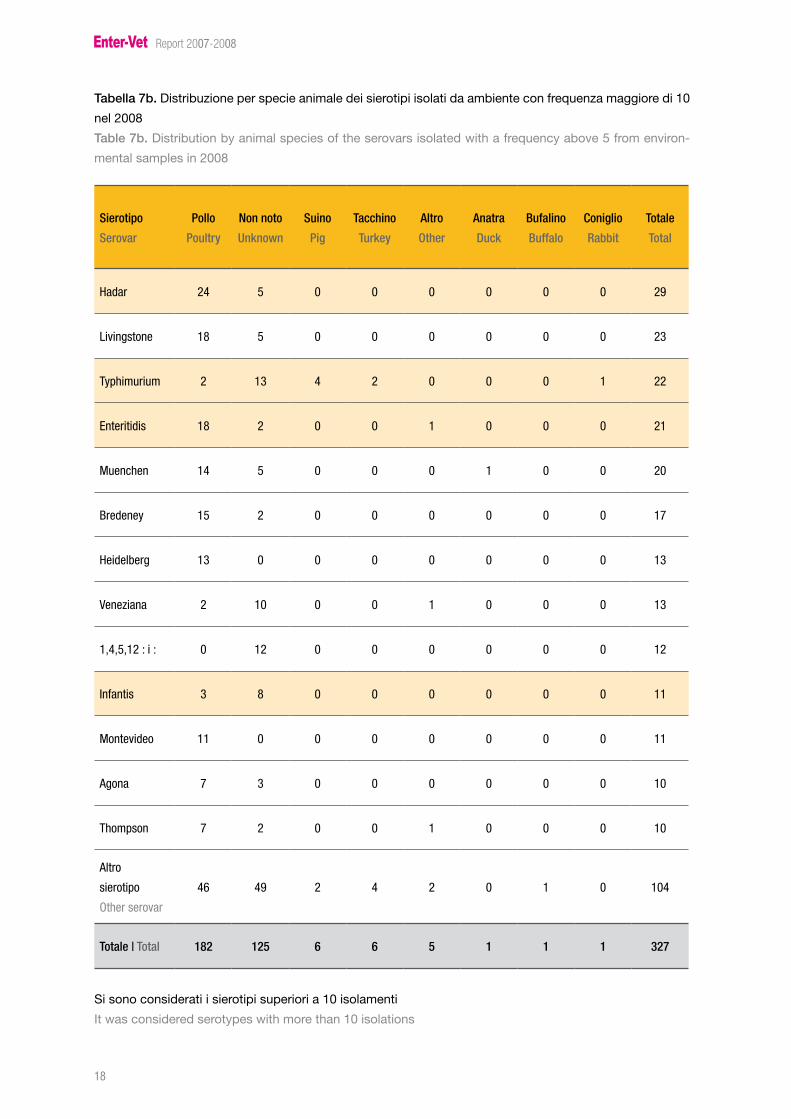
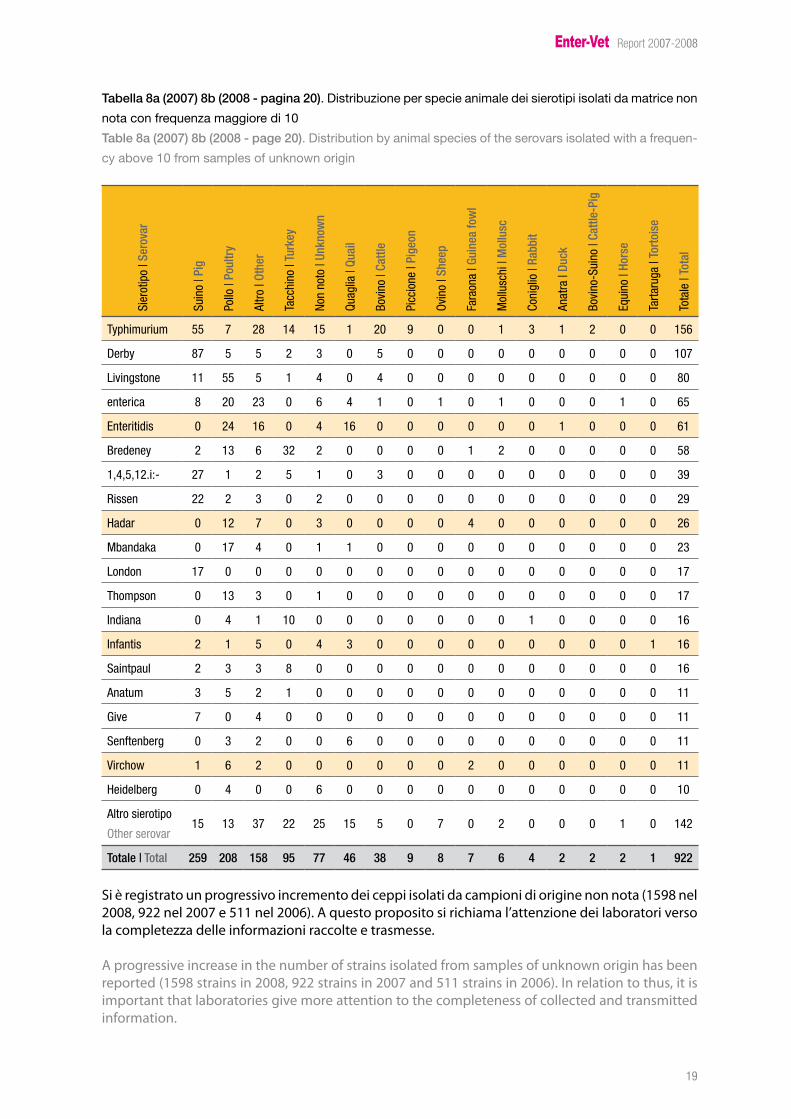
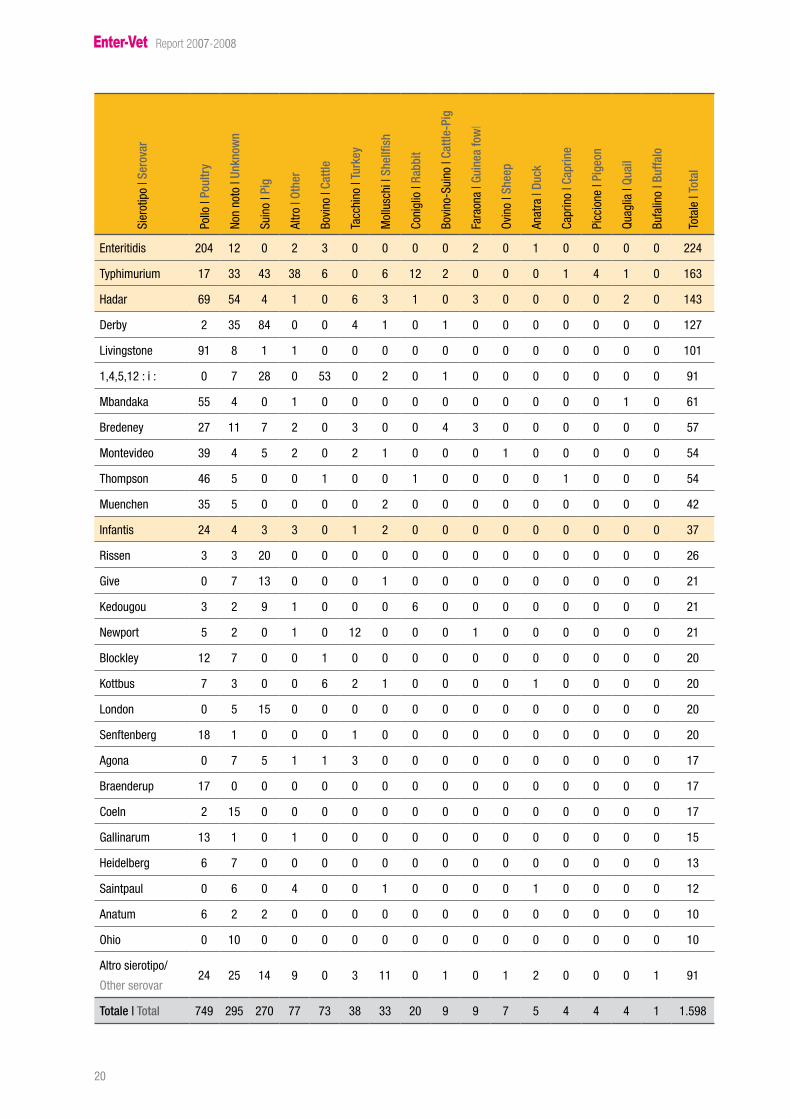
Le Tabelle 5a, 5b, 6a, 6b, 7a, 7b e 8a, 8b riportano la distribuzione dei sierotipi di Salmonella spp. iso-lati rispettivamente da animali, alimenti, ambiente e di origine non nota rispettivamente nel 2007 e 2008. Per quanto riguarda i ceppi isolati da animali e alimenti sono considerati solo i sierotipi con frequenza di isolamento superiore a 20, mentre per i ceppi isolati da ambiente e di origine non nota solo i sierotipi con frequenza di isolamento superiore a 5. Tutti i sierotipi con frequenze d’isolamen-to inferiori sono raggruppati nella categoria “altro”.
Tables 5a, 5b, 6a, 6b, 7a, 7b and 8a, 8b report the distribution of Salmonella Spp. serovars isolated from animals, food, environment and of unknown origin in 2007 and 2008 respectively. As far as the strains isolated from animals and food are concerned only the strains with a frequency of isolation above 20 are considered, while for the other strains only the serovars isolated with a frequency above 5 are reported. All the serovars with a frequency of isolation below those reported in details are grouped in the category “other”.
I sierotipi attualmente individuati dalla Commissione Europea come “rilevanti per la salute pubbli-ca” (Salmonella Enteritidis, Salmonella Typhimurium, Salmonella Hadar, Salmonella Infantis e Salmo-nella Virchow) sono evidenziati in tabella.
The serovars identified by the European Commission with public health relevance (Salmonella En-teritidis, Salmonella Typhimurium, Salmonella Hadar, Salmonella Infantis e Salmonella Virchow) are highlighted in the table.
Tabella 5a. (pagina 13)
Distribuzione per specie animale dei sierotipi isolati da animali con frequenza superiore a 20 isolamenti
nel 2007
Table 5a (page 13). Distribution by animal species of the serovars isolated with a frequency above 20
from animal samples in 2007
Tabella 5b. (pagina 14)
Distribuzione per specie animale dei sierotipi per specie animale isolati da animali con frequenza superio-
re a 20 isolamenti nel 2008
Table 5b (page 14). Distribution by animal species of the serovars in each animal species isolated with a
Totale | Total 259 208 158 95 77 46 38 9 8 7 6 4 2 2 2 1 922
Si è registrato un progressivo incremento dei ceppi isolati da campioni di origine non nota (1598 nel 2008, 922 nel 2007 e 511 nel 2006). A questo proposito si richiama l’attenzione dei laboratori verso la completezza delle informazioni raccolte e trasmesse.
A progressive increase in the number of strains isolated from samples of unknown origin has been reported (1598 strains in 2008, 922 strains in 2007 and 511 strains in 2006). In relation to thus, it is important that laboratories give more attention to the completeness of collected and transmitted information.
Totale | Total 7�9 29� 270 77 7� �8 �� 20 9 9 7 � � � � � �.�98
Enter-Vet Report 2007-2008
2�
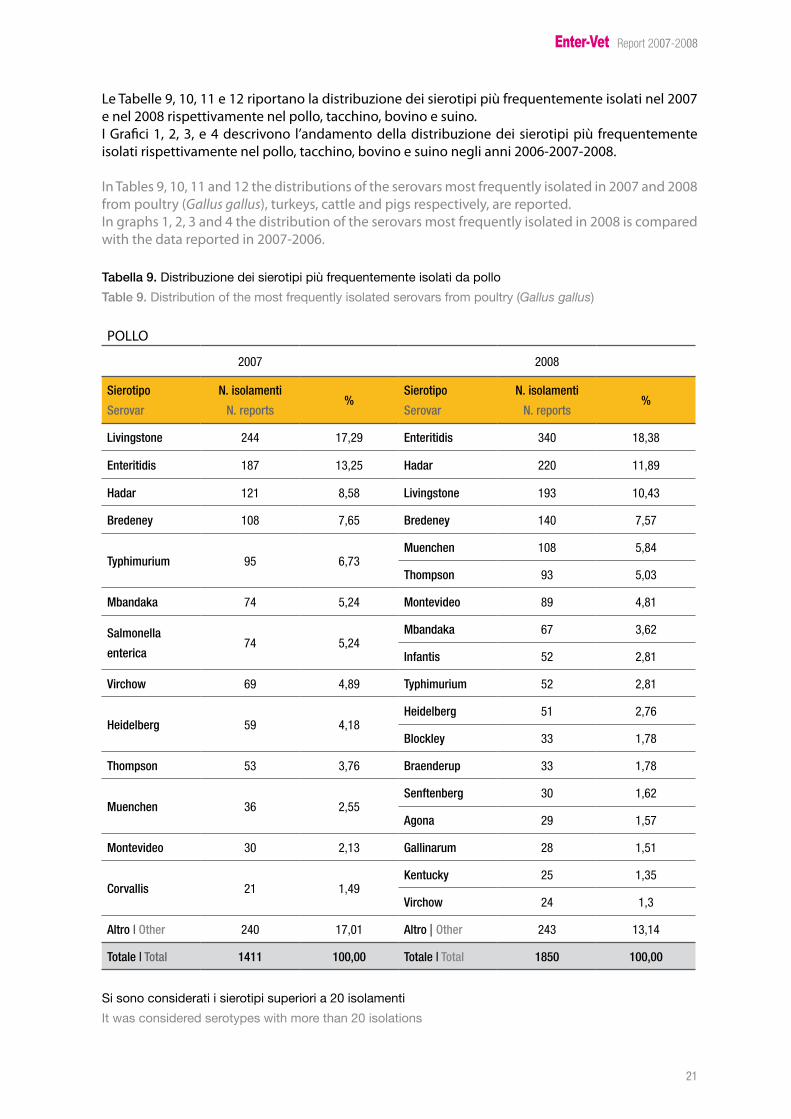
Le Tabelle 9, 10, 11 e 12 riportano la distribuzione dei sierotipi più frequentemente isolati nel 2007 e nel 2008 rispettivamente nel pollo, tacchino, bovino e suino.I Grafici 1, 2, 3, e 4 descrivono l’andamento della distribuzione dei sierotipi più frequentemente isolati rispettivamente nel pollo, tacchino, bovino e suino negli anni 2006-2007-2008.
In Tables 9, 10, 11 and 12 the distributions of the serovars most frequently isolated in 2007 and 2008 from poultry (Gallus gallus), turkeys, cattle and pigs respectively, are reported. In graphs 1, 2, 3 and 4 the distribution of the serovars most frequently isolated in 2008 is compared with the data reported in 2007-2006.
Tabella 9. Distribuzione dei sierotipi più frequentemente isolati da pollo
Table 9. Distribution of the most frequently isolated serovars from poultry (Gallus gallus)
POLLO
2007 2008
Sierotipo
Serovar
N. isolamenti
N. reports%
Sierotipo
Serovar
N. isolamenti
N. reports%
Livingstone 2�� �7,29 Enteritidis ��0 �8,�8
Enteritidis �87 ��,2� Hadar 220 ��,89
Hadar �2� 8,�8 Livingstone �9� �0,��
Bredeney �08 7,�� Bredeney ��0 7,�7
Typhimurium 9� �,7�Muenchen �08 �,8�
Thompson 9� �,0�
Mbandaka 7� �,2� Montevideo 89 �,8�
Salmonella
enterica7� �,2�
Mbandaka �7 �,�2
Infantis �2 2,8�
Virchow �9 �,89 Typhimurium �2 2,8�
Heidelberg �9 �,�8Heidelberg �� 2,7�
Blockley �� �,78
Thompson �� �,7� Braenderup �� �,78
Muenchen �� 2,��Senftenberg �0 �,�2
Agona 29 �,�7
Montevideo �0 2,�� Gallinarum 28 �,��
Corvallis 2� �,�9Kentucky 2� �,��
Virchow 2� �,�
Altro | Other 2�0 �7,0� Altro | Other 2�� ��,��
Totale | Total 1411 100,00 Totale | Total 1850 100,00
Si sono considerati i sierotipi superiori a 20 isolamenti
It was considered serotypes with more than 20 isolations
Enter-Vet Report 2007-2008
22
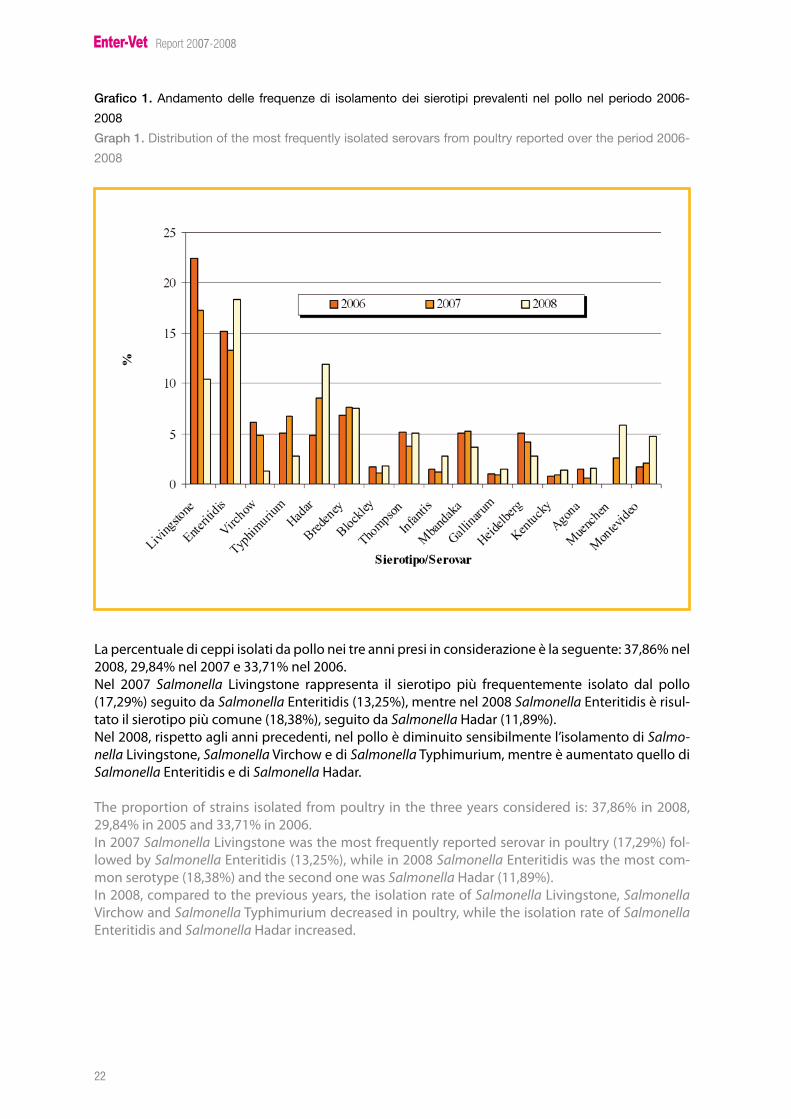
Grafico 1. Andamento delle frequenze di isolamento dei sierotipi prevalenti nel pollo nel periodo 2006-
2008
Graph 1. Distribution of the most frequently isolated serovars from poultry reported over the period 2006-
2008
La percentuale di ceppi isolati da pollo nei tre anni presi in considerazione è la seguente: 37,86% nel 2008, 29,84% nel 2007 e 33,71% nel 2006.Nel 2007 Salmonella Livingstone rappresenta il sierotipo più frequentemente isolato dal pollo (17,29%) seguito da Salmonella Enteritidis (13,25%), mentre nel 2008 Salmonella Enteritidis è risul-tato il sierotipo più comune (18,38%), seguito da Salmonella Hadar (11,89%).Nel 2008, rispetto agli anni precedenti, nel pollo è diminuito sensibilmente l’isolamento di Salmo-nella Livingstone, Salmonella Virchow e di Salmonella Typhimurium, mentre è aumentato quello di Salmonella Enteritidis e di Salmonella Hadar.
The proportion of strains isolated from poultry in the three years considered is: 37,86% in 2008, 29,84% in 2005 and 33,71% in 2006.In 2007 Salmonella Livingstone was the most frequently reported serovar in poultry (17,29%) fol-lowed by Salmonella Enteritidis (13,25%), while in 2008 Salmonella Enteritidis was the most com-mon serotype (18,38%) and the second one was Salmonella Hadar (11,89%).In 2008, compared to the previous years, the isolation rate of Salmonella Livingstone, Salmonella Virchow and Salmonella Typhimurium decreased in poultry, while the isolation rate of Salmonella Enteritidis and Salmonella Hadar increased.
Enter-Vet Report 2007-2008
2�
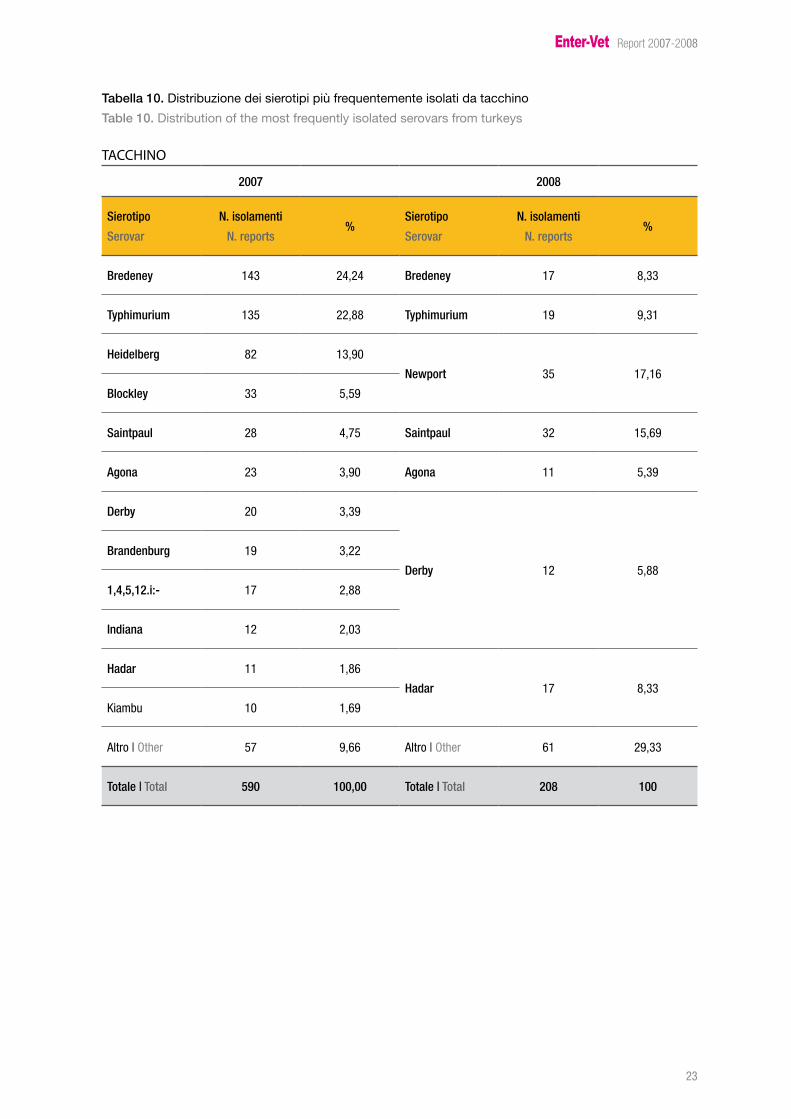
Tabella 10. Distribuzione dei sierotipi più frequentemente isolati da tacchino
Table 10. Distribution of the most frequently isolated serovars from turkeys
TACCHINO
2007 2008
Sierotipo
Serovar
N. isolamenti
N. reports%
Sierotipo
Serovar
N. isolamenti
N. reports%
Bredeney ��� 2�,2� Bredeney �7 8,��
Typhimurium ��� 22,88 Typhimurium �9 9,��
Heidelberg 82 ��,90
Newport �� �7,��
Blockley �� �,�9
Saintpaul 28 �,7� Saintpaul �2 ��,�9
Agona 2� �,90 Agona �� �,�9
Derby 20 �,�9
Derby �2 �,88
Brandenburg �9 �,22
1,4,5,12.i:- �7 2,88
Indiana �2 2,0�
Hadar �� �,8�
Hadar �7 8,��
Kiambu �0 �,�9
Altro | Other �7 9,�� Altro | Other �� 29,��
Totale | Total 590 100,00 Totale | Total 208 100
Enter-Vet Report 2007-2008
2�
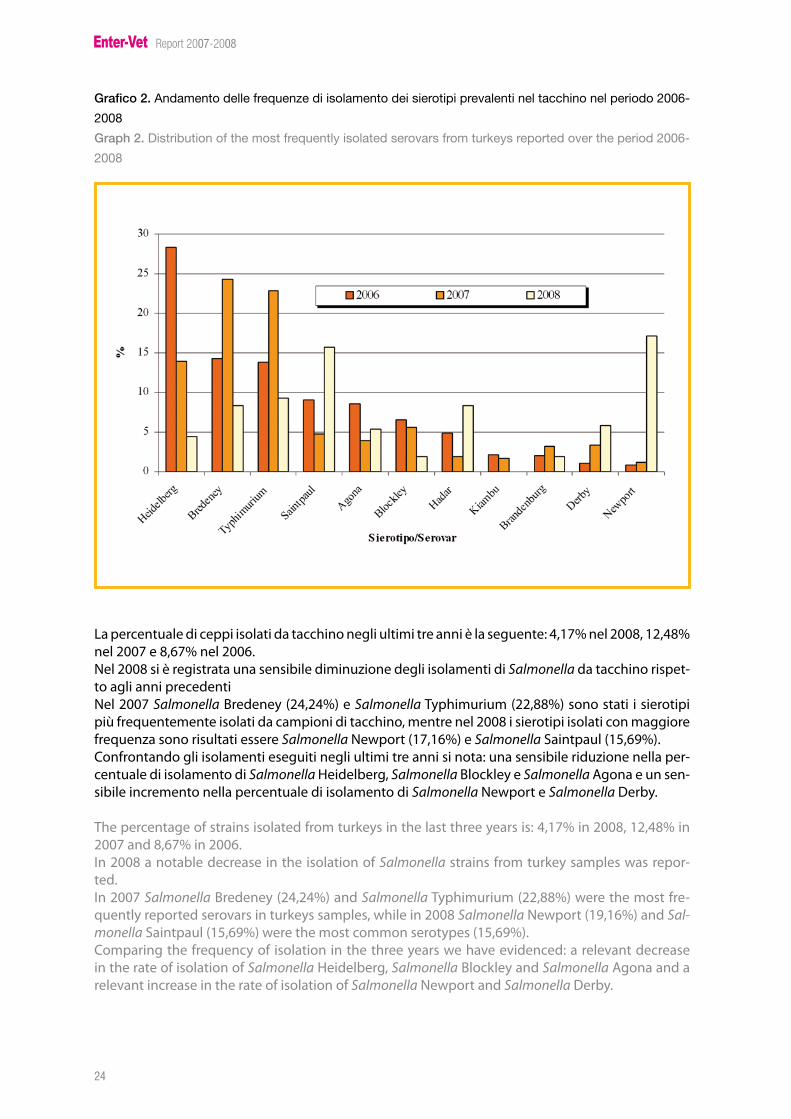
Grafico 2. Andamento delle frequenze di isolamento dei sierotipi prevalenti nel tacchino nel periodo 2006-
2008
Graph 2. Distribution of the most frequently isolated serovars from turkeys reported over the period 2006-
2008
La percentuale di ceppi isolati da tacchino negli ultimi tre anni è la seguente: 4,17% nel 2008, 12,48% nel 2007 e 8,67% nel 2006.Nel 2008 si è registrata una sensibile diminuzione degli isolamenti di Salmonella da tacchino rispet-to agli anni precedenti Nel 2007 Salmonella Bredeney (24,24%) e Salmonella Typhimurium (22,88%) sono stati i sierotipi più frequentemente isolati da campioni di tacchino, mentre nel 2008 i sierotipi isolati con maggiore frequenza sono risultati essere Salmonella Newport (17,16%) e Salmonella Saintpaul (15,69%).Confrontando gli isolamenti eseguiti negli ultimi tre anni si nota: una sensibile riduzione nella per-centuale di isolamento di Salmonella Heidelberg, Salmonella Blockley e Salmonella Agona e un sen-sibile incremento nella percentuale di isolamento di Salmonella Newport e Salmonella Derby.
The percentage of strains isolated from turkeys in the last three years is: 4,17% in 2008, 12,48% in 2007 and 8,67% in 2006.In 2008 a notable decrease in the isolation of Salmonella strains from turkey samples was repor-ted. In 2007 Salmonella Bredeney (24,24%) and Salmonella Typhimurium (22,88%) were the most fre-quently reported serovars in turkeys samples, while in 2008 Salmonella Newport (19,16%) and Sal-monella Saintpaul (15,69%) were the most common serotypes (15,69%).Comparing the frequency of isolation in the three years we have evidenced: a relevant decrease in the rate of isolation of Salmonella Heidelberg, Salmonella Blockley and Salmonella Agona and a relevant increase in the rate of isolation of Salmonella Newport and Salmonella Derby.
Enter-Vet Report 2007-2008
2�
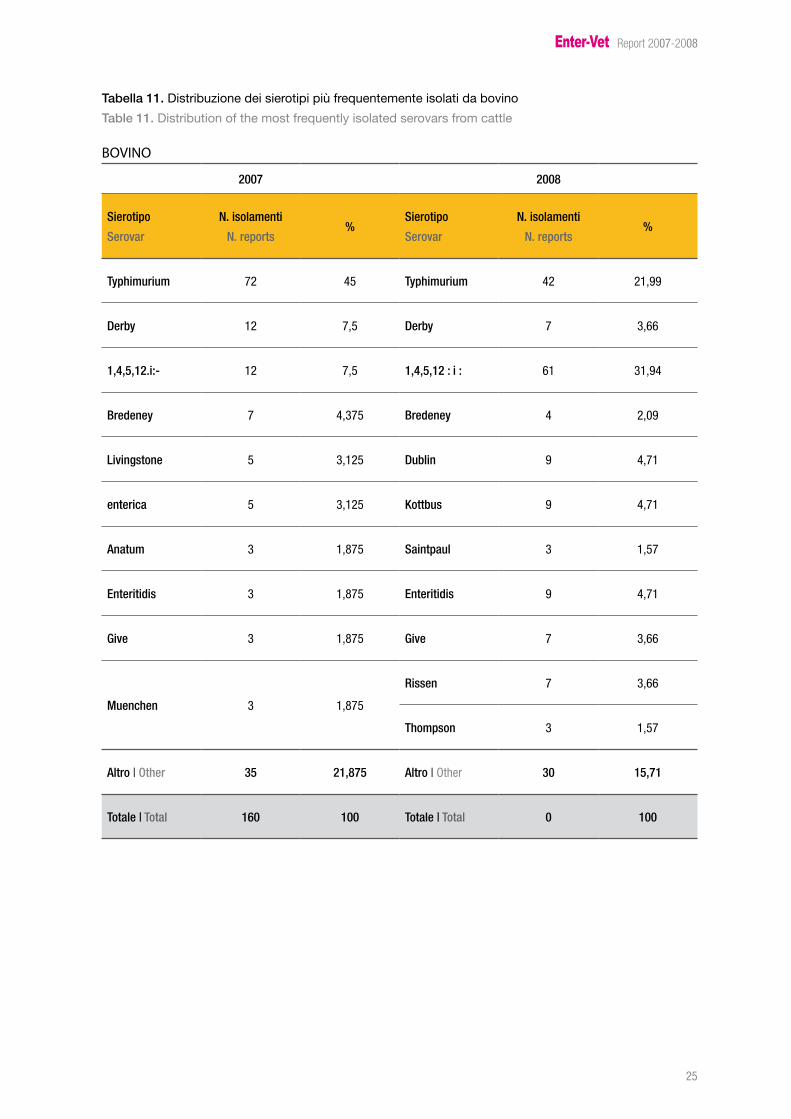
Tabella 11. Distribuzione dei sierotipi più frequentemente isolati da bovino
Table 11. Distribution of the most frequently isolated serovars from cattle
BOVINO
2007 2008
Sierotipo
Serovar
N. isolamenti
N. reports%
Sierotipo
Serovar
N. isolamenti
N. reports%
Typhimurium 72 �� Typhimurium �2 2�,99
Derby �2 7,� Derby 7 �,��
1,4,5,12.i:- �2 7,� 1,4,5,12 : i : �� ��,9�
Bredeney 7 �,�7� Bredeney � 2,09
Livingstone � �,�2� Dublin 9 �,7�
enterica � �,�2� Kottbus 9 �,7�
Anatum � �,87� Saintpaul � �,�7
Enteritidis � �,87� Enteritidis 9 �,7�
Give � �,87� Give 7 �,��
Muenchen � �,87�
Rissen 7 �,��
Thompson � �,�7
Altro | Other 35 21,875 Altro | Other 30 15,71
Totale | Total 160 100 Totale | Total 0 100
Enter-Vet Report 2007-2008
2�
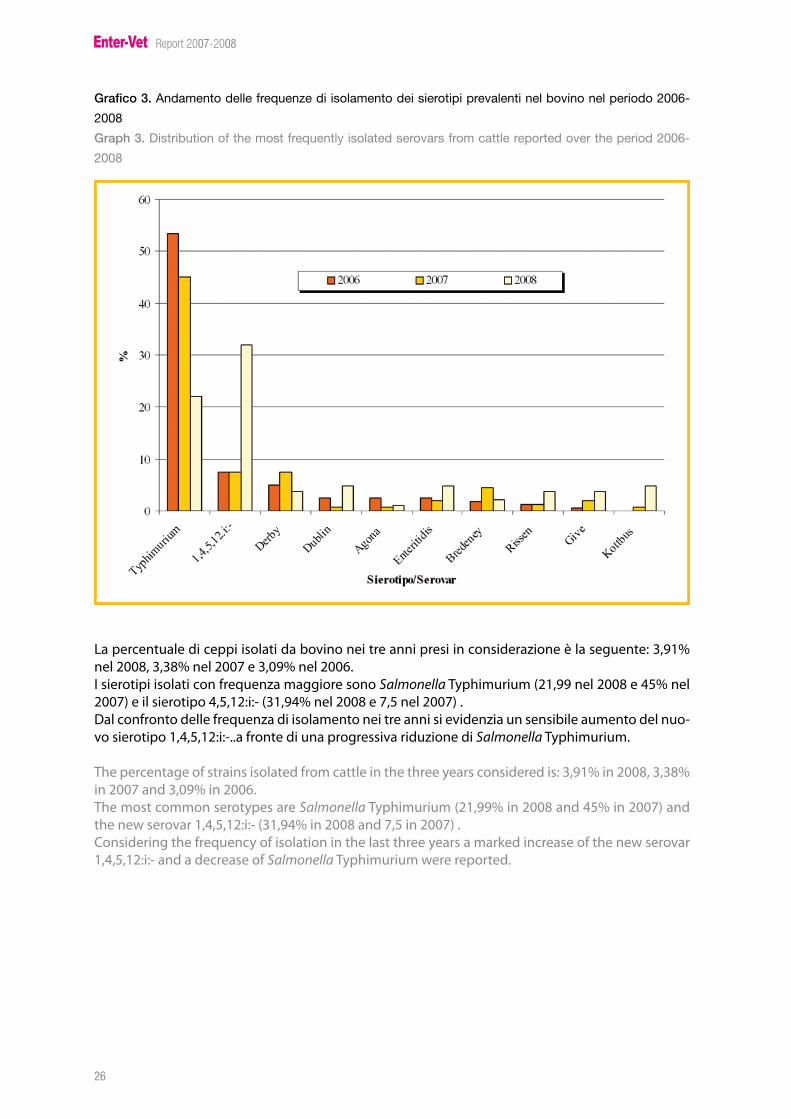
Grafico 3. Andamento delle frequenze di isolamento dei sierotipi prevalenti nel bovino nel periodo 2006-
2008
Graph 3. Distribution of the most frequently isolated serovars from cattle reported over the period 2006-
2008
La percentuale di ceppi isolati da bovino nei tre anni presi in considerazione è la seguente: 3,91% nel 2008, 3,38% nel 2007 e 3,09% nel 2006.I sierotipi isolati con frequenza maggiore sono Salmonella Typhimurium (21,99 nel 2008 e 45% nel 2007) e il sierotipo 4,5,12:i:- (31,94% nel 2008 e 7,5 nel 2007) .Dal confronto delle frequenza di isolamento nei tre anni si evidenzia un sensibile aumento del nuo-vo sierotipo 1,4,5,12:i:-..a fronte di una progressiva riduzione di Salmonella Typhimurium.
The percentage of strains isolated from cattle in the three years considered is: 3,91% in 2008, 3,38% in 2007 and 3,09% in 2006.The most common serotypes are Salmonella Typhimurium (21,99% in 2008 and 45% in 2007) and the new serovar 1,4,5,12:i:- (31,94% in 2008 and 7,5 in 2007) .Considering the frequency of isolation in the last three years a marked increase of the new serovar 1,4,5,12:i:- and a decrease of Salmonella Typhimurium were reported.
Enter-Vet Report 2007-2008
27
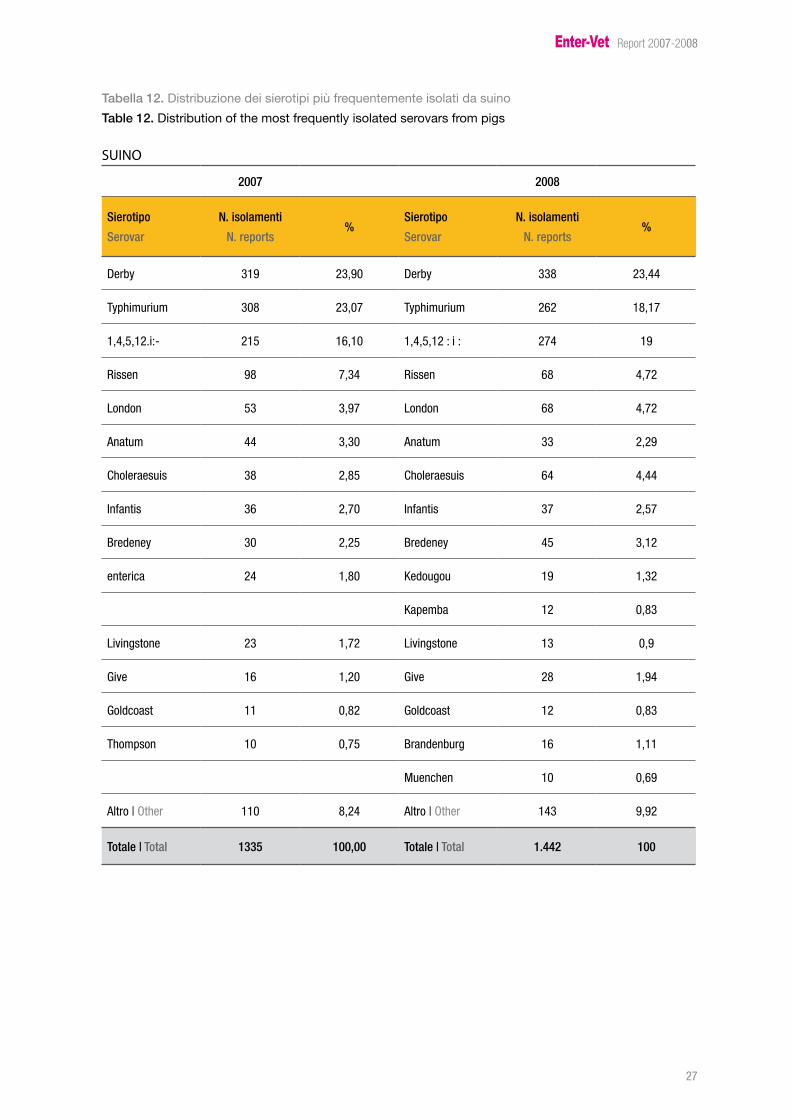
Tabella 12. Distribuzione dei sierotipi più frequentemente isolati da suino
Table 12. Distribution of the most frequently isolated serovars from pigs
SUINO
2007 2008
Sierotipo
Serovar
N. isolamenti
N. reports%
Sierotipo
Serovar
N. isolamenti
N. reports%
Derby ��9 2�,90 Derby ��8 2�,��
Typhimurium �08 2�,07 Typhimurium 2�2 �8,�7
�,�,�,�2.i:- 2�� ��,�0 �,�,�,�2 : i : 27� �9
Rissen 98 7,�� Rissen �8 �,72
London �� �,97 London �8 �,72
Anatum �� �,�0 Anatum �� 2,29
Choleraesuis �8 2,8� Choleraesuis �� �,��
Infantis �� 2,70 Infantis �7 2,�7
Bredeney �0 2,2� Bredeney �� �,�2
enterica 2� �,80 Kedougou �9 �,�2
Kapemba �2 0,8�
Livingstone 2� �,72 Livingstone �� 0,9
Give �� �,20 Give 28 �,9�
Goldcoast �� 0,82 Goldcoast �2 0,8�
Thompson �0 0,7� Brandenburg �� �,��
Muenchen �0 0,�9
Altro | Other ��0 8,2� Altro | Other ��� 9,92
Totale | Total 1335 100,00 Totale | Total 1.442 100
Enter-Vet Report 2007-2008
28
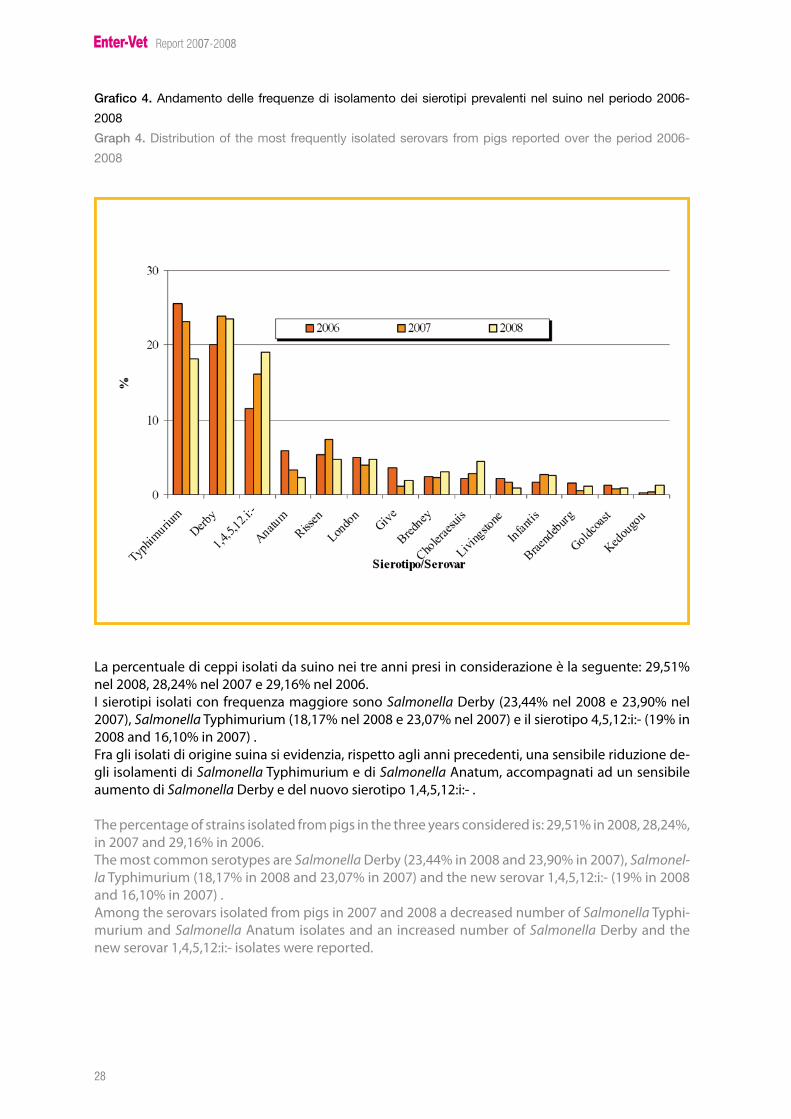
Grafico 4. Andamento delle frequenze di isolamento dei sierotipi prevalenti nel suino nel periodo 2006-
2008
Graph 4. Distribution of the most frequently isolated serovars from pigs reported over the period 2006-
2008
La percentuale di ceppi isolati da suino nei tre anni presi in considerazione è la seguente: 29,51% nel 2008, 28,24% nel 2007 e 29,16% nel 2006.I sierotipi isolati con frequenza maggiore sono Salmonella Derby (23,44% nel 2008 e 23,90% nel 2007), Salmonella Typhimurium (18,17% nel 2008 e 23,07% nel 2007) e il sierotipo 4,5,12:i:- (19% in 2008 and 16,10% in 2007) .Fra gli isolati di origine suina si evidenzia, rispetto agli anni precedenti, una sensibile riduzione de-gli isolamenti di Salmonella Typhimurium e di Salmonella Anatum, accompagnati ad un sensibile aumento di Salmonella Derby e del nuovo sierotipo 1,4,5,12:i:- .
The percentage of strains isolated from pigs in the three years considered is: 29,51% in 2008, 28,24%, in 2007 and 29,16% in 2006.The most common serotypes are Salmonella Derby (23,44% in 2008 and 23,90% in 2007), Salmonel-la Typhimurium (18,17% in 2008 and 23,07% in 2007) and the new serovar 1,4,5,12:i:- (19% in 2008 and 16,10% in 2007) .Among the serovars isolated from pigs in 2007 and 2008 a decreased number of Salmonella Typhi-murium and Salmonella Anatum isolates and an increased number of Salmonella Derby and the new serovar 1,4,5,12:i:- isolates were reported.
Enter-Vet Report 2007-2008
29
Fagotipizzazione: risultati
Le tabelle 13 e 14 illustrano la distribuzione per specie animale dei fagotipi di Salmonella Typhimu-rium e Salmonella Enteritidis tipizzati nel 2007 e 2008.
Per quanto riguarda Salmonella Typhimurium il numero totale di ceppi sottoposti a fagotipizzazio-ne è stato pari a 922 nel 2006, 827 nel 2007 e 547 nel 2008. Per quanto riguarda Salmonella Enteriti-dis il numero totale di ceppi sottoposti a fagotipizzazione è stato pari a 322 nel 2006, 246 nel 2007 e 367 nel 2008.
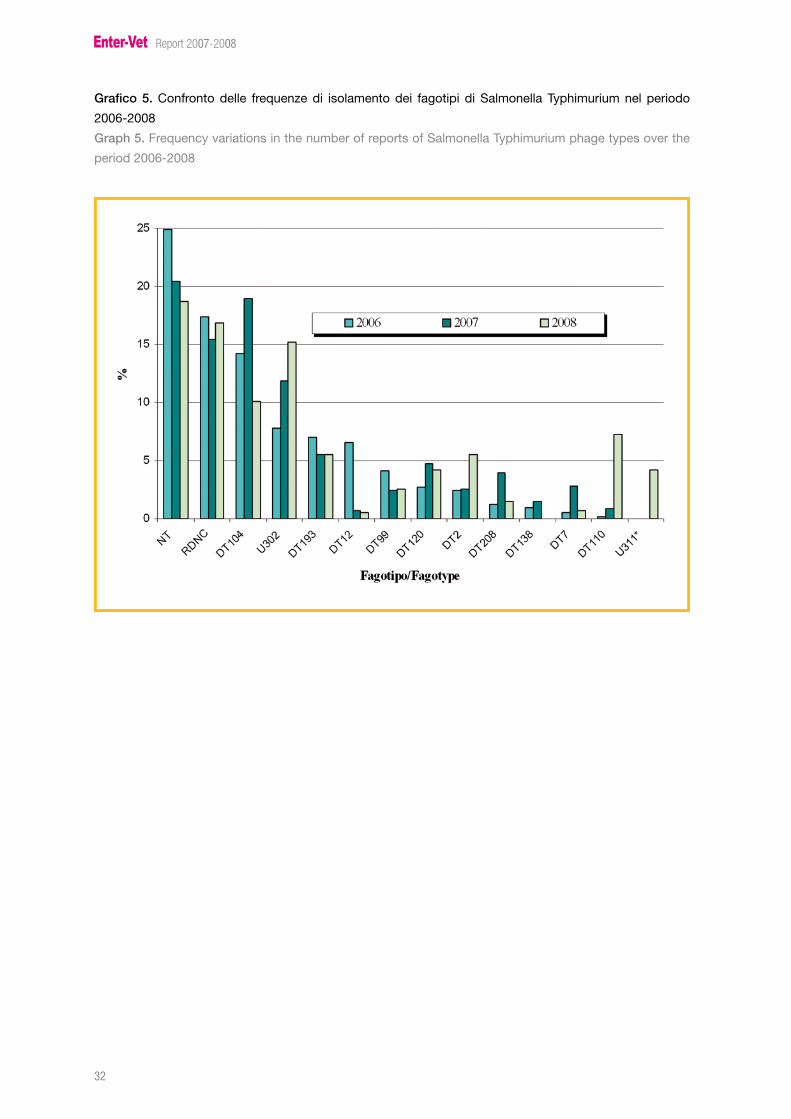
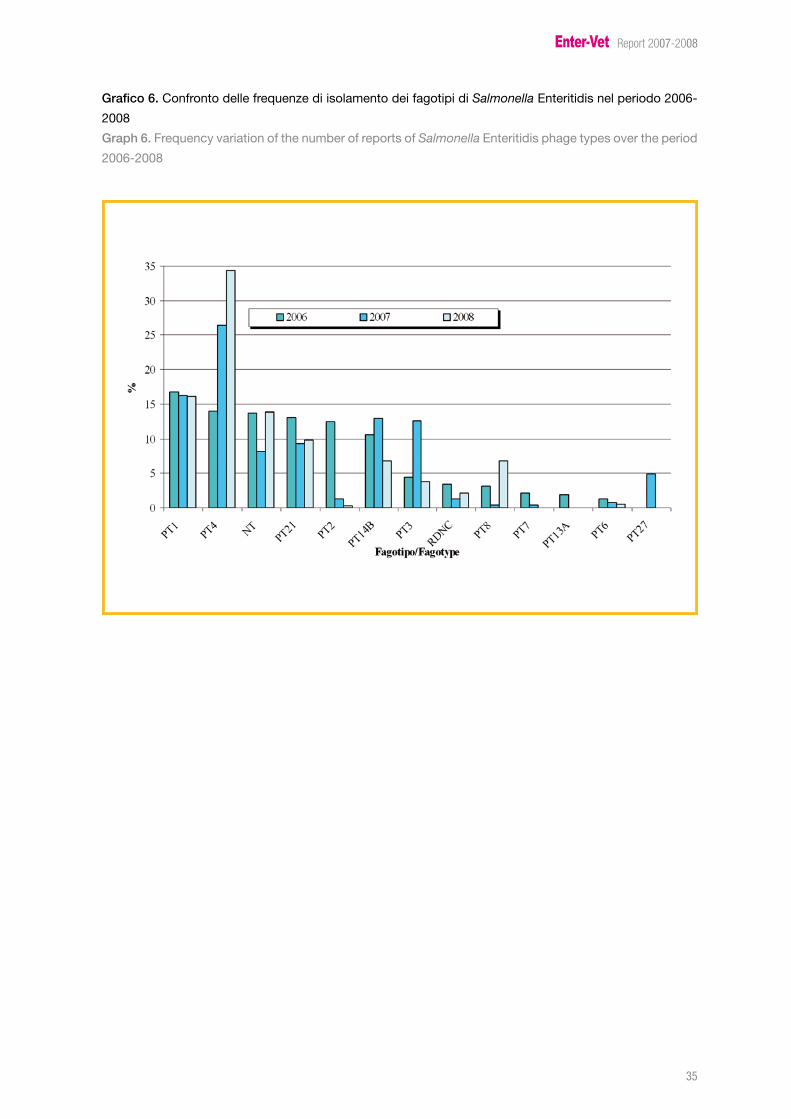
I Grafici 5 e 6 mostrano le variazioni della frequenza dei fagotipi di Salmonella Typhimurium e Sal-monella Enteritidis negli anni 2006-2008.
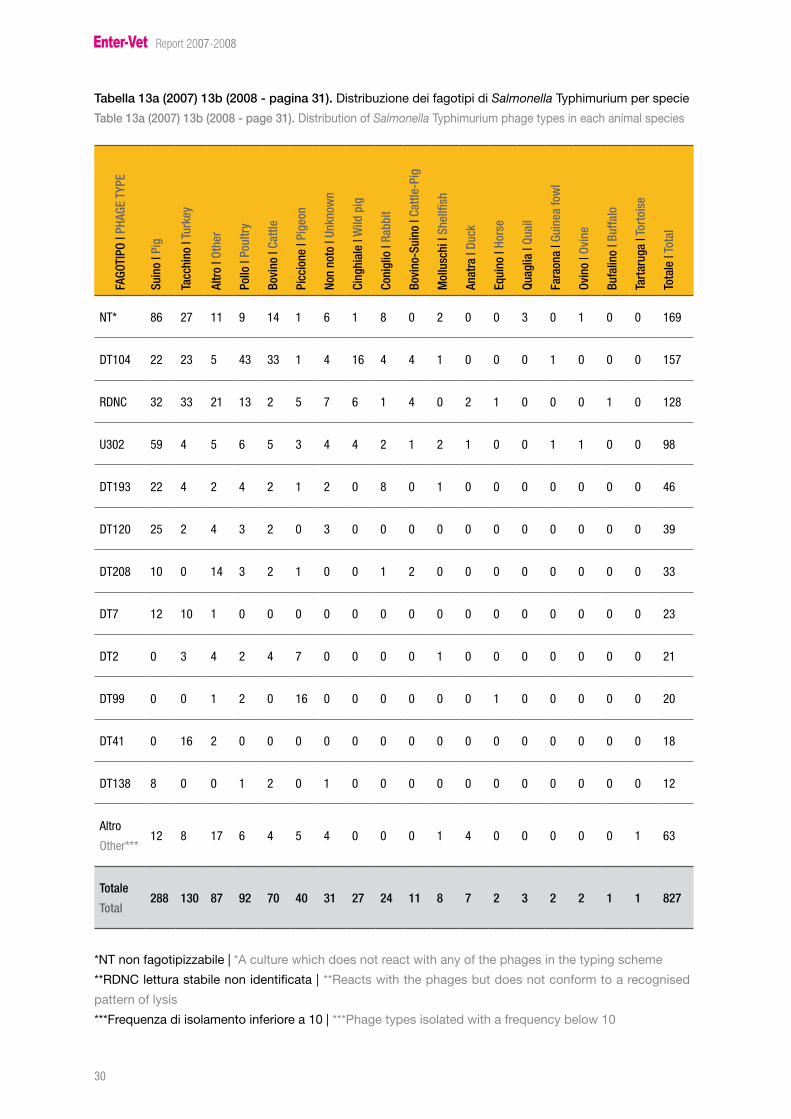
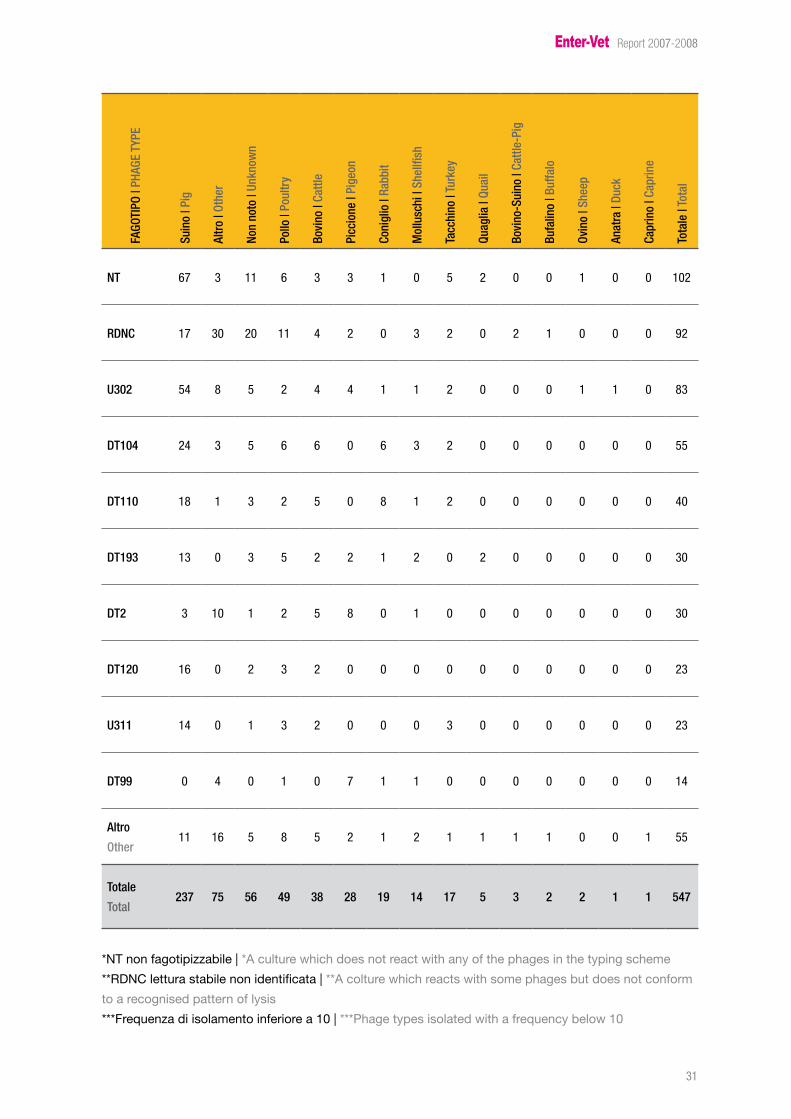
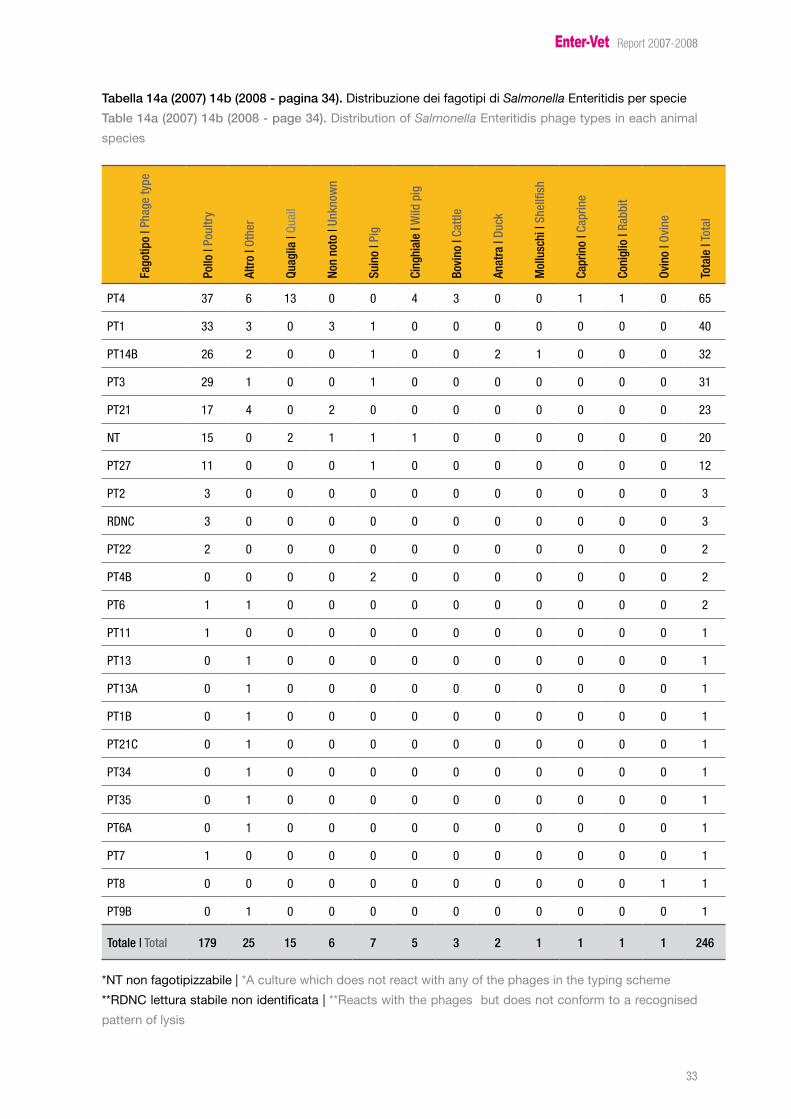
Per quanto riguarda Salmonella Typhimurium (tabella 13) i fagotipi più frequentemente identificati sono stati DT104 e U302 rispettivamente nel 2007 e 2008. La frequenza di isolamento di ceppi NT (non fagotipizzabili) e RDNC (lettura stabile non identificata) risulta elevata e generalmente riparti-ta tra tutte le diverse matrici da cui sono stati isolati i ceppi.Per quanto riguarda il sierotipo Salmonella Enteritidis (Tabella 14) il fagotipo più frequentemente isolato risulta essere PT4 sia nel 2007 che nel 2008.
Valutando l’andamento nel tempo delle fagotipizzazioni per Salmonella Typhimurium è stato re-gistrato un incremento degli isolamenti di U302, DT120, DT2 e DT110, una riduzione di ceppi NT, RDNC, DT193 e DT12. Considerando invece Salmonella Enteritidis si è verificato un significativo in-cremento del fagotipo PT4, un decremento di PT21 e PT2 e un andamento variabile di PT14b, PT3 e NT. La frequenza di isolamento di PT1 appare piuttosto stabile.
Phage typing: results
In Tables 13 and 14 the Salmonella Typhimurium and Salmonella Enteritidis phage types distribu-tions in each animal species are reported in 2007 and 2008
Considering Salmonella Typhimurium the number of isolates phage-typed is 922 in 2006, 827 in 2007 and 547 in 2008, while for Salmonella Enteritidis 322 isolates in 2006, 246 in 2007 and 367 in 2008 were phage typed.
Graphs 5 and 6 show the variation in the frequency of phage types identified for Salmonella Typhi-murium and Salmonella Enteritidis over the period 2006-2008.
As far as Salmonella Typhimurium is concerned (Table 13) the most frequently isolated phage types in 2007 and 2008 were DT104 and U302 respectively. The prevalence of RDNC and NT strains is generally high for all the different species from which Salmonella Typhimurium strains had been isolated.As far as Salmonella Enteritidis is concerned (Table 14) the most common phage type is PT4 both in 2007 and 2008.
When considering the trend of identification of different phage types of Salmonella Typhimurium, an increase in the identification of U302, DT120, DT2 and DT110 was reported. On the other hand the identification of NT, RDNC, DT193 and DT12 was less frequent. As regards Salmonella Enteritidis an increase in the identification of PT4 isolates, a reduction in the frequency of isolation of PT21 and PT2 and a variable trend for PT14b, PT3 e NT were found.
Enter-Vet Report 2007-2008
�0
Tabella 13a (2007) 13b (2008 - pagina 31). Distribuzione dei fagotipi di Salmonella Typhimurium per specie
Table 13a (2007) 13b (2008 - page 31). Distribution of Salmonella Typhimurium phage types in each animal speciesFA
*NT non fagotipizzabile | *A culture which does not react with any of the phages in the typing scheme
**RDNC lettura stabile non identificata | **Reacts with the phages but does not conform to a recognised
pattern of lysis
***Frequenza di isolamento inferiore a 10 | ***Phage types isolated with a frequency below 10
Enter-Vet Report 2007-2008
��
FAGO
TIPO
| PH
AGE
TyPE
Suin
o | P
ig
Altr
o | O
ther
Non
noto
| Un
know
n
Pollo
| Po
ultr
y
Bovi
no |
Cattl
e
Picc
ione
| Pi
geon
Coni
glio
| Ra
bbit
Mol
lusc
hi |
Shel
lfish
Tacc
hino
| Tu
rkey
Quag
lia |
Quai
l
Bovi
no-S
uino
| Ca
ttle-
Pig
Bufa
lino
| Buf
falo
Ovin
o | S
heep
Anat
ra |
Duck
Capr
ino
| Cap
rine
Tota
le |
Tota
l
NT �7 � �� � � � � 0 � 2 0 0 � 0 0 �02
RDNC �7 �0 20 �� � 2 0 � 2 0 2 � 0 0 0 92
U302 �� 8 � 2 � � � � 2 0 0 0 � � 0 8�
DT104 2� � � � � 0 � � 2 0 0 0 0 0 0 ��
DT110 �8 � � 2 � 0 8 � 2 0 0 0 0 0 0 �0
DT193 �� 0 � � 2 2 � 2 0 2 0 0 0 0 0 �0
DT2 � �0 � 2 � 8 0 � 0 0 0 0 0 0 0 �0
DT120 �� 0 2 � 2 0 0 0 0 0 0 0 0 0 0 2�
U311 �� 0 � � 2 0 0 0 � 0 0 0 0 0 0 2�
DT99 0 � 0 � 0 7 � � 0 0 0 0 0 0 0 ��
Altro
Other�� �� � 8 � 2 � 2 � � � � 0 0 � ��
Totale
Total237 75 56 49 38 28 19 14 17 5 3 2 2 1 1 547
*NT non fagotipizzabile | *A culture which does not react with any of the phages in the typing scheme
**RDNC lettura stabile non identificata | **A colture which reacts with some phages but does not conform
to a recognised pattern of lysis
***Frequenza di isolamento inferiore a 10 | ***Phage types isolated with a frequency below 10
Enter-Vet Report 2007-2008
�2
Grafico 5. Confronto delle frequenze di isolamento dei fagotipi di Salmonella Typhimurium nel periodo
2006-2008
Graph 5. Frequency variations in the number of reports of Salmonella Typhimurium phage types over the
period 2006-2008
Enter-Vet Report 2007-2008
��
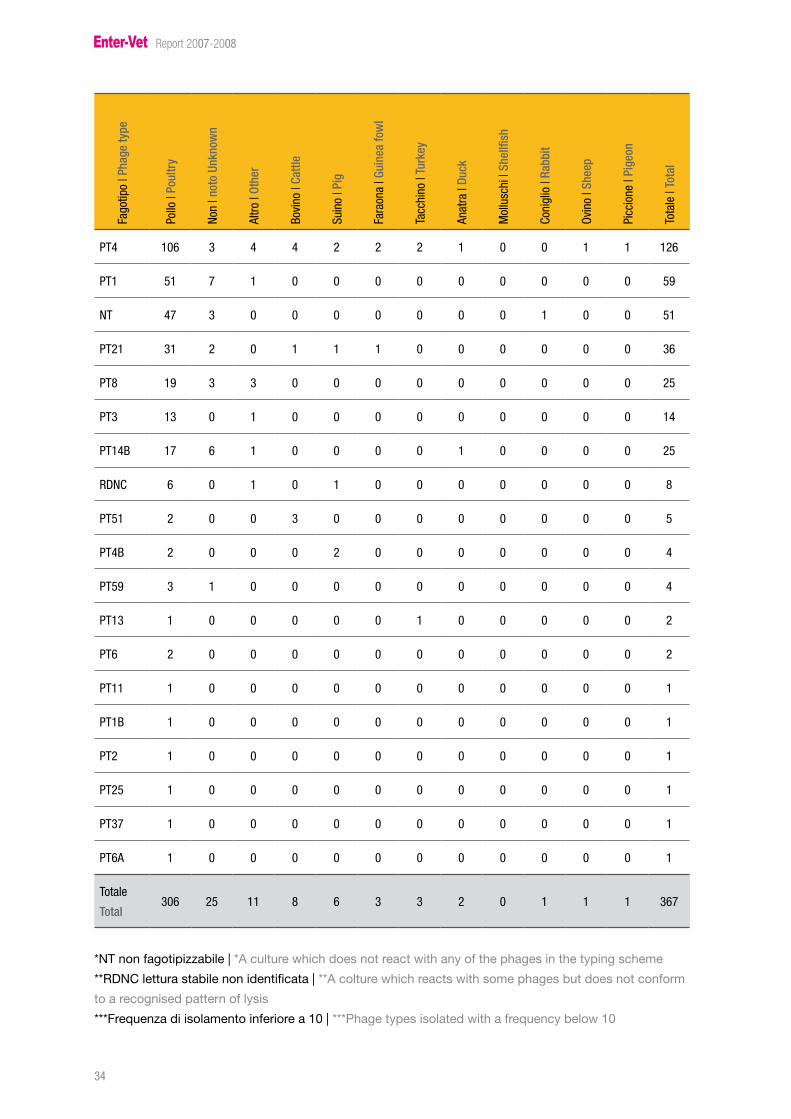
Tabella 14a (2007) 14b (2008 - pagina 34). Distribuzione dei fagotipi di Salmonella Enteritidis per specie
Table 14a (2007) 14b (2008 - page 34). Distribution of Salmonella Enteritidis phage types in each animal
speciesFa
gotip
o | P
hage
type
Pollo
| Po
ultr
y
Altr
o | O
ther
Quag
lia |
Quai
l
Non
noto
| Un
know
n
Suin
o | P
ig
Cing
hial
e | W
ild p
ig
Bovi
no |
Cattl
e
Anat
ra |
Duck
Mol
lusc
hi |
Shel
lfish
Capr
ino
| Cap
rine
Coni
glio
| Ra
bbit
Ovin
o | O
vine
Tota
le |
Tota
l
PT� �7 � �� 0 0 � � 0 0 � � 0 ��
PT� �� � 0 � � 0 0 0 0 0 0 0 �0
PT��B 2� 2 0 0 � 0 0 2 � 0 0 0 �2
PT� 29 � 0 0 � 0 0 0 0 0 0 0 ��
PT2� �7 � 0 2 0 0 0 0 0 0 0 0 2�
NT �� 0 2 � � � 0 0 0 0 0 0 20
PT27 �� 0 0 0 � 0 0 0 0 0 0 0 �2
PT2 � 0 0 0 0 0 0 0 0 0 0 0 �
RDNC � 0 0 0 0 0 0 0 0 0 0 0 �
PT22 2 0 0 0 0 0 0 0 0 0 0 0 2
PT�B 0 0 0 0 2 0 0 0 0 0 0 0 2
PT� � � 0 0 0 0 0 0 0 0 0 0 2
PT�� � 0 0 0 0 0 0 0 0 0 0 0 �
PT�� 0 � 0 0 0 0 0 0 0 0 0 0 �
PT��A 0 � 0 0 0 0 0 0 0 0 0 0 �
PT�B 0 � 0 0 0 0 0 0 0 0 0 0 �
PT2�C 0 � 0 0 0 0 0 0 0 0 0 0 �
PT�� 0 � 0 0 0 0 0 0 0 0 0 0 �
PT�� 0 � 0 0 0 0 0 0 0 0 0 0 �
PT�A 0 � 0 0 0 0 0 0 0 0 0 0 �
PT7 � 0 0 0 0 0 0 0 0 0 0 0 �
PT8 0 0 0 0 0 0 0 0 0 0 0 � �
PT9B 0 � 0 0 0 0 0 0 0 0 0 0 �
Totale | Total 179 25 15 6 7 5 3 2 1 1 1 1 246
*NT non fagotipizzabile | *A culture which does not react with any of the phages in the typing scheme
**RDNC lettura stabile non identificata | **Reacts with the phages but does not conform to a recognised
pattern of lysis
Enter-Vet Report 2007-2008
��
Fago
tipo
| Pha
ge ty
pe
Pollo
| Po
ultr
y
Non
| not
o Un
know
n
Altro
| Ot
her
Bovi
no |
Cattl
e
Suin
o | P
ig
Fara
ona
| Gui
nea
fow
l
Tacc
hino
| Tu
rkey
Anat
ra |
Duck
Mol
lusc
hi |
Shel
lfish
Coni
glio
| Ra
bbit
Ovin
o | S
heep
Picc
ione
| Pi
geon
Tota
le |
Tota
l
PT� �0� � � � 2 2 2 � 0 0 � � �2�
PT� �� 7 � 0 0 0 0 0 0 0 0 0 �9
NT �7 � 0 0 0 0 0 0 0 � 0 0 ��
PT2� �� 2 0 � � � 0 0 0 0 0 0 ��
PT8 �9 � � 0 0 0 0 0 0 0 0 0 2�
PT� �� 0 � 0 0 0 0 0 0 0 0 0 ��
PT��B �7 � � 0 0 0 0 � 0 0 0 0 2�
RDNC � 0 � 0 � 0 0 0 0 0 0 0 8
PT�� 2 0 0 � 0 0 0 0 0 0 0 0 �
PT�B 2 0 0 0 2 0 0 0 0 0 0 0 �
PT�9 � � 0 0 0 0 0 0 0 0 0 0 �
PT�� � 0 0 0 0 0 � 0 0 0 0 0 2
PT� 2 0 0 0 0 0 0 0 0 0 0 0 2
PT�� � 0 0 0 0 0 0 0 0 0 0 0 �
PT�B � 0 0 0 0 0 0 0 0 0 0 0 �
PT2 � 0 0 0 0 0 0 0 0 0 0 0 �
PT2� � 0 0 0 0 0 0 0 0 0 0 0 �
PT�7 � 0 0 0 0 0 0 0 0 0 0 0 �
PT�A � 0 0 0 0 0 0 0 0 0 0 0 �
Totale
Total�0� 2� �� 8 � � � 2 0 � � � ��7
*NT non fagotipizzabile | *A culture which does not react with any of the phages in the typing scheme
**RDNC lettura stabile non identificata | **A colture which reacts with some phages but does not conform
to a recognised pattern of lysis
***Frequenza di isolamento inferiore a 10 | ***Phage types isolated with a frequency below 10
Enter-Vet Report 2007-2008
��
Grafico 6. Confronto delle frequenze di isolamento dei fagotipi di Salmonella Enteritidis nel periodo 2006-
2008
Graph 6. Frequency variation of the number of reports of Salmonella Enteritidis phage types over the period
2006-2008
Enter-Vet Report 2007-2008
��
Test di suscettibilità agli antimicrobici: risultati Antimicrobial susceptibility testing: results
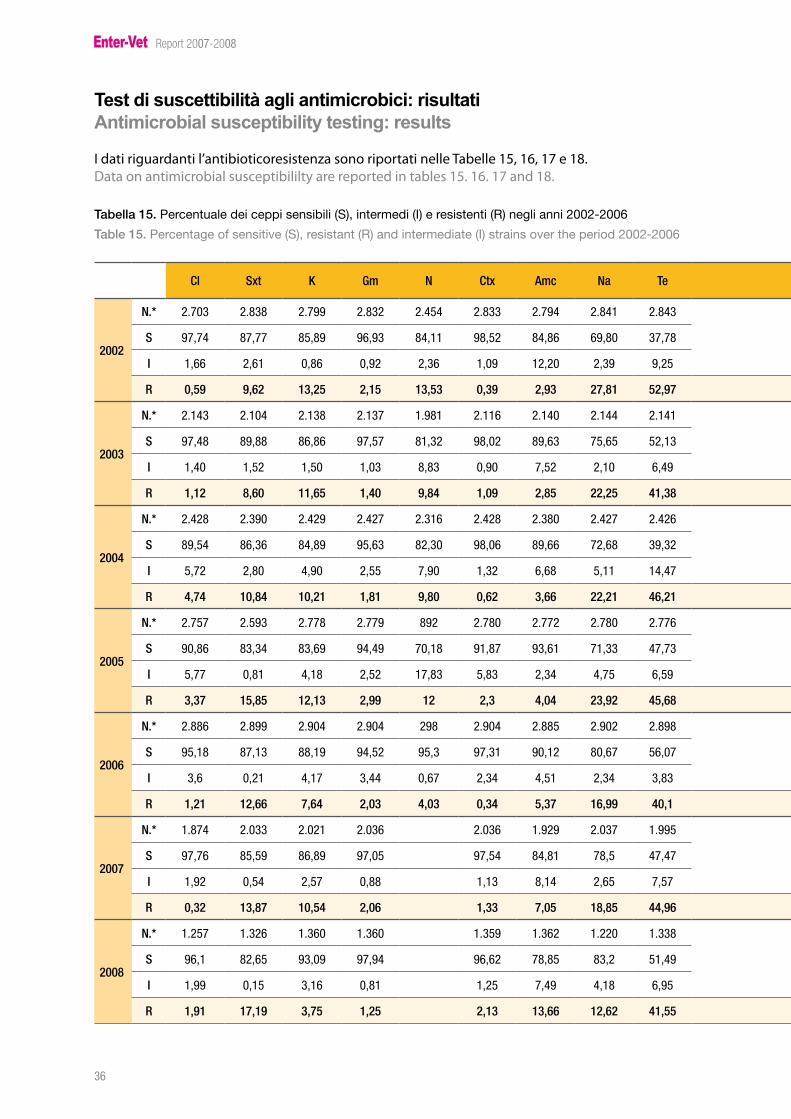
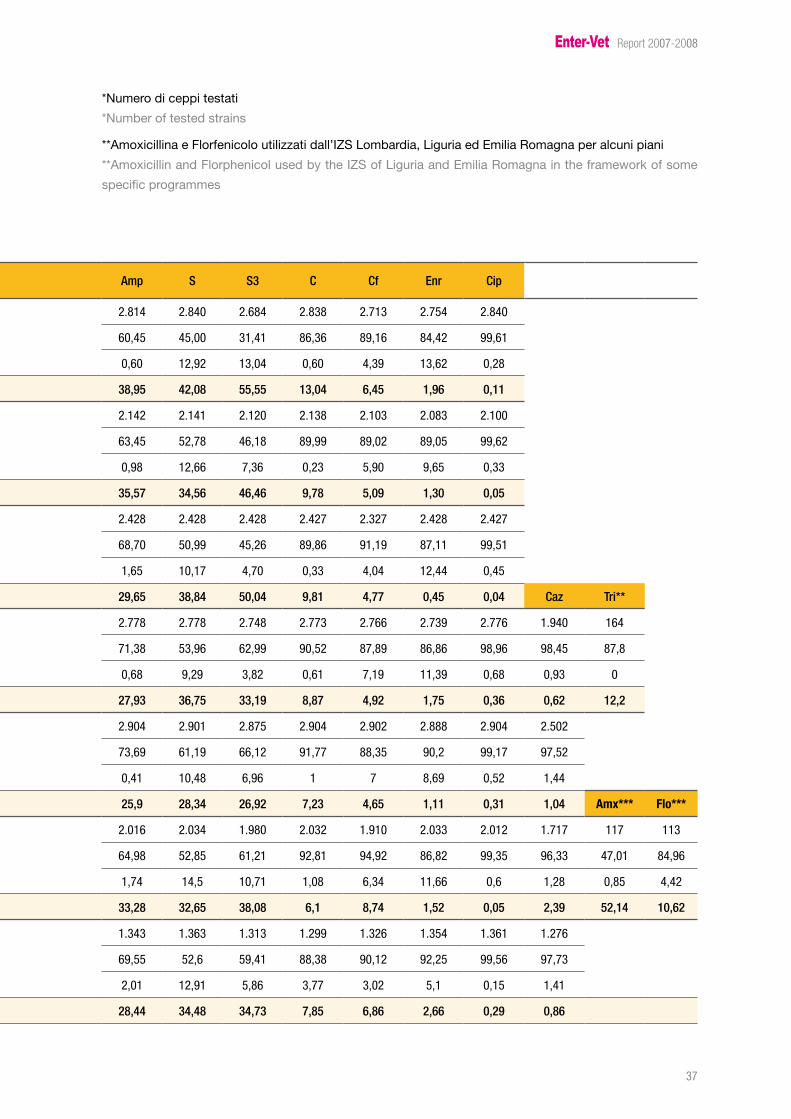
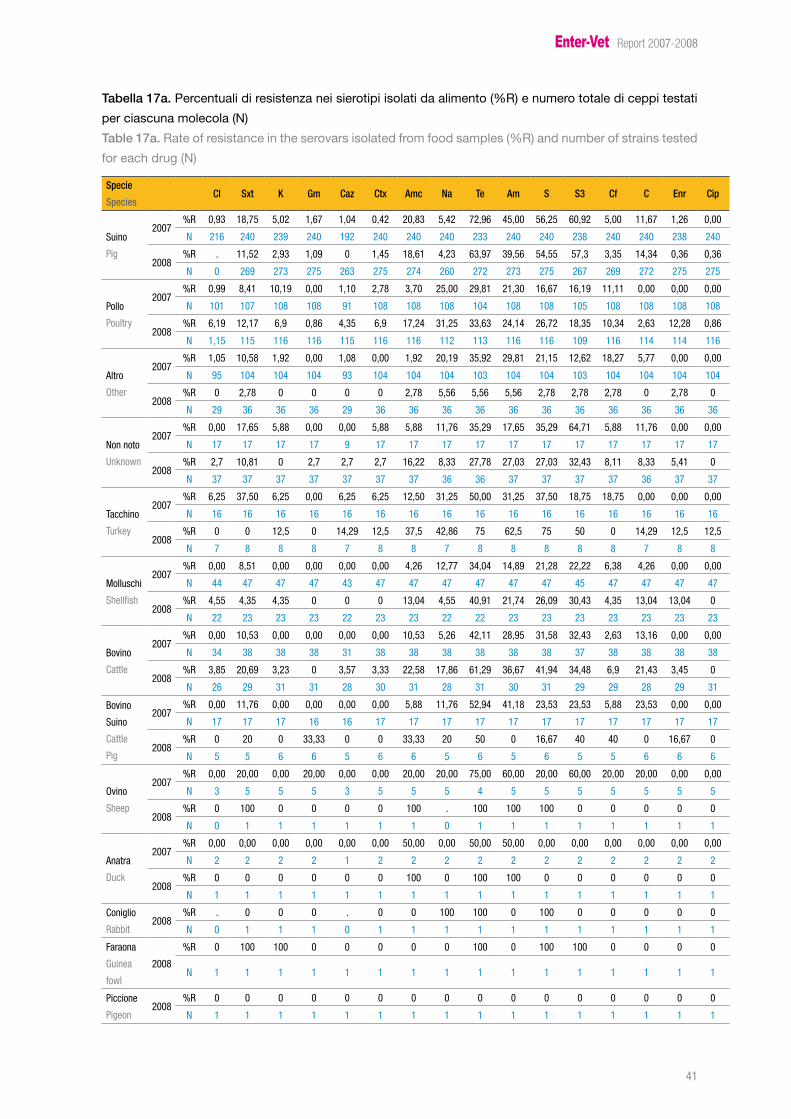
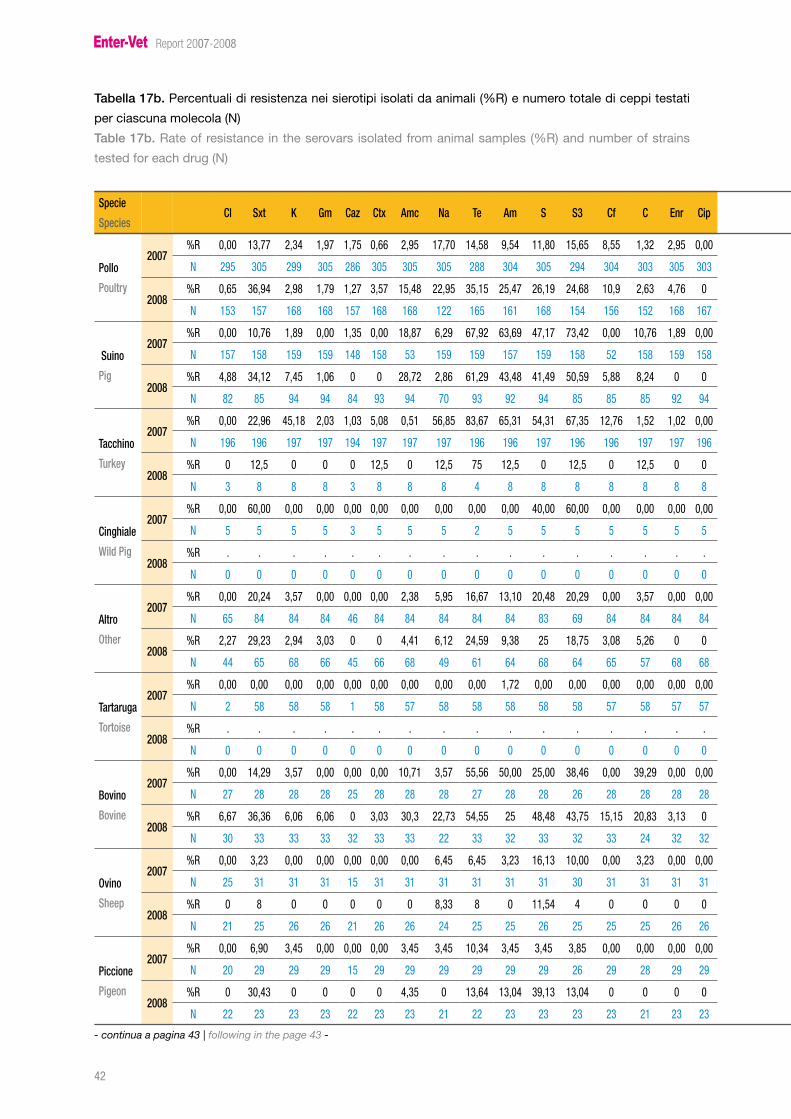
I dati riguardanti l’antibioticoresistenza sono riportati nelle Tabelle 15, 16, 17 e 18.Data on antimicrobial susceptibililty are reported in tables 15. 16. 17 and 18.
Tabella 15. Percentuale dei ceppi sensibili (S), intermedi (I) e resistenti (R) negli anni 2002-2006
Table 15. Percentage of sensitive (S), resistant (R) and intermediate (I) strains over the period 2002-2006
Test di suscettibilità agli antimicrobici: risultati Antimicrobial susceptibility testing: results
I dati riguardanti l’antibioticoresistenza sono riportati nelle Tabelle 15, 16, 17 e 18.Data on antimicrobial susceptibililty are reported in tables 15. 16. 17 and 18.
Tabella 15. Percentuale dei ceppi sensibili (S), intermedi (I) e resistenti (R) negli anni 2002-2006
Table 15. Percentage of sensitive (S), resistant (R) and intermediate (I) strains over the period 2002-2006
**Amoxicillina e Florfenicolo utilizzati dall’IZS Lombardia, Liguria ed Emilia Romagna per alcuni piani
**Amoxicillin and Florphenicol used by the IZS of Liguria and Emilia Romagna in the framework of some
specific programmes
Enter-Vet Report 2007-2008
�8
Come si evince dalla tabella 15 il numero di ceppi testati varia per ciascuna molecola; ciò è ricondu-cibile al fatto che a volte non vengono testate tutte le molecole previste dal pannello, in quanto o vengono adottati pannelli diversi rispetto a quello previsto o non vengono testate tutte le molecole per mancata disponibilità di alcune di queste presso il laboratorio di analisi.
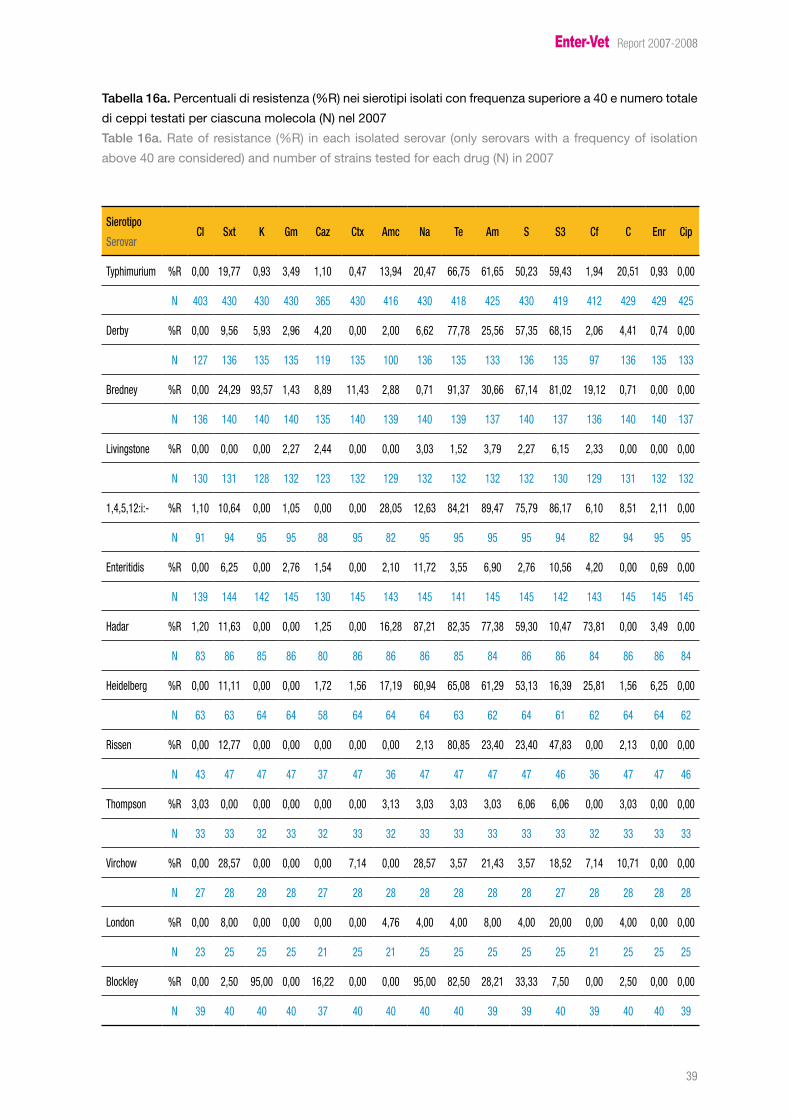
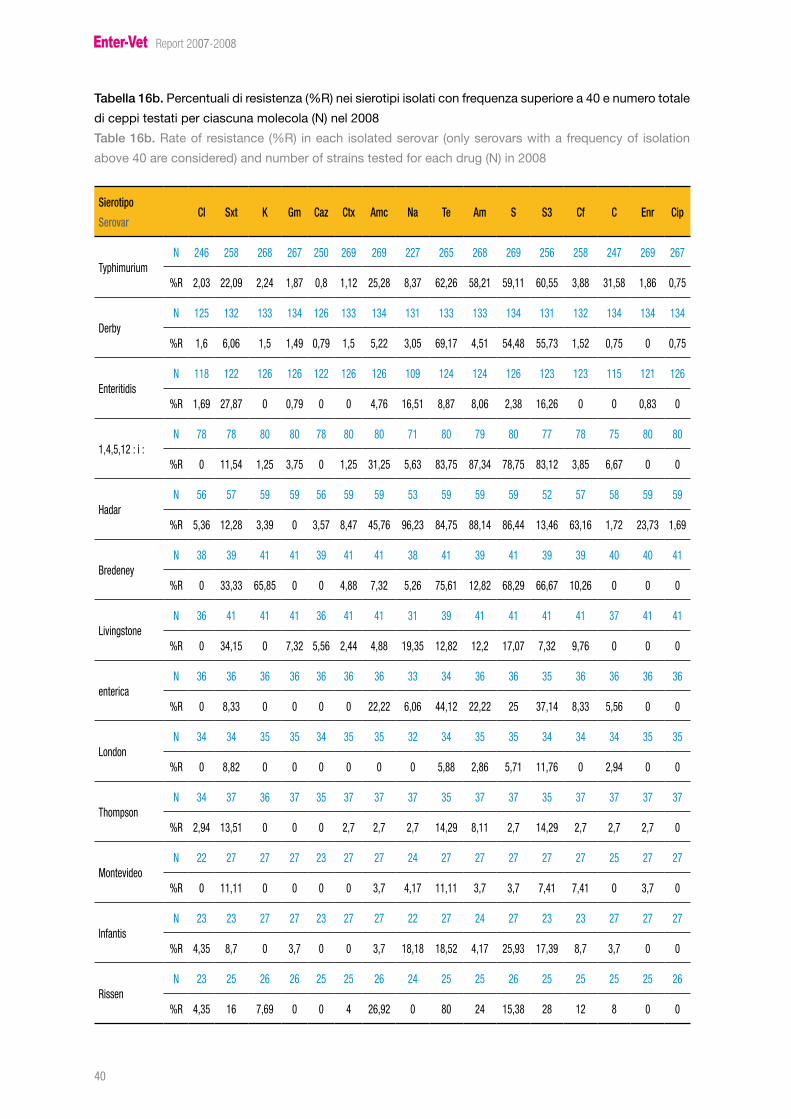
L’analisi dei dati permette di confermare quanto già evidenziato nel 2002-2006, sottolineando l’ele-vata percentuale di ceppi resistenti a tetraciclina (44,96% nel 2007 e 41,55% nel 2008), ampicillina (33,28% nel 2007 e 28,44% nel 2008), streptomicina (32,65% nel 2007 e 34,48 nel 2008) e sulfonami-di (38,08% nel 2007 e 34,73% nel 2008).L’andamento delle resistenze risulta piuttosto variabile. Tendenzialmente si è verificata una diminu-zione del numero di ceppi resistenti alla kanamicina (10,54% nel 2007 e 3,75% nel 2008) e all’acido nalidixico (18,85% nel 2007 e 12,62% nel 2008) e un incremento nelle resistenze a amoxicillina-aci-do clavulanico (7,05% nel 2007 e 13,66% nel 2008) e a sulfametoxazolo-trimetoprim (13,87% nel 2007 e 17,19% nel 2008). In linea generale l’andamento delle resistenze risulta piuttosto variabile anche rispetto agli anni precedenti. Nello specifico il numero di ceppi resistenti al ceftazidime è lievemente aumentato nel 2007 (2,39%) per tornare ai valori registrati negli anni precedenti nel 2008 (0,86%).Infine, per quanto riguarda i fluorochinoloni, si è osservata un incremento nelle resistenza nel 2008 per l’enrofloxacin (2,66%) rispetto all’anno precedente (1,52%).Le tabelle 16 e 17 riportano il dettaglio delle resistenze distribuite rispettivamente per sierotipo e per specie animale.
Table 15 shows that the number of strains tested is different for each drug, which is due to the fact that sometimes not all the drugs included in the panel are tested because either panels different from the prescribed one are used or some of the drugs are temporary not available in the laborato-ries performing the analysis.
The data collected in 2007-2008 allow to confirm the results of the previous years, with a high per-centage of strains resistant to tetracycline (44,96% in 2007 and 41,55% in 2008), ampicillin (33,28% in 2007 and 28,44% in 2008), streptomycin (32,65% in 2007 and 34,48% in 2008) and sulphonami-des compounds (38,08% in 2007 and 34,73% in 2008).Generally the trend of resistances registered is quite variable compared to the previous yearSalmo-nella In particular, the number of isolates resistant to ceftazidime slightly increased in 2007 (2,39%) and went back in 2008, to values comparable to the ones registered in previous years (0.86%).Moreover, considering fluoroquinolones resistance a notable increase has been evidenced for enro-floxacin in 2008 (2,66%) compared to result reported during the previous year (1,52%).In Tables 16 and 17 details about the antimicrobial susceptibility considering the serovars and the animal species are reported.
Enter-Vet Report 2007-2008
�9
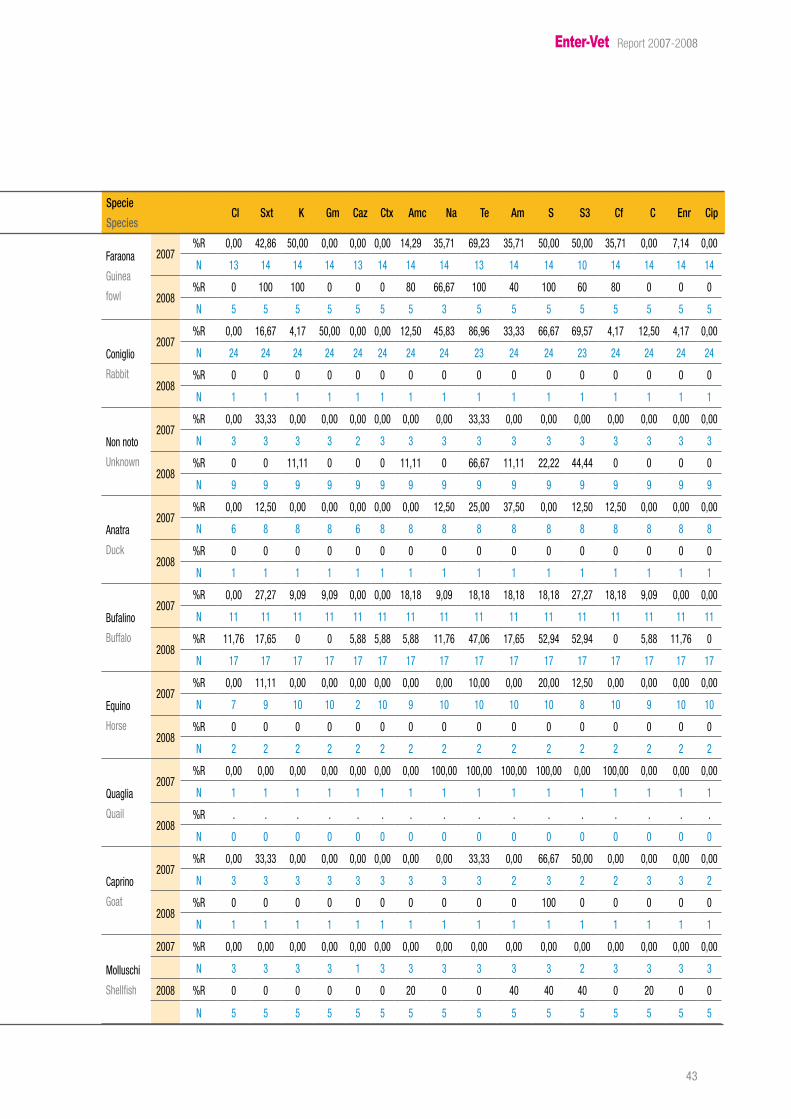
Tabella 16a. Percentuali di resistenza (%R) nei sierotipi isolati con frequenza superiore a 40 e numero totale
di ceppi testati per ciascuna molecola (N) nel 2007
Table 16a. Rate of resistance (%R) in each isolated serovar (only serovars with a frequency of isolation
above 40 are considered) and number of strains tested for each drug (N) in 2007
Sierotipo
SerovarCl Sxt K Gm Caz Ctx Amc Na Te Am S S3 Cf C Enr Cip
SpeciesCl Sxt K Gm Caz Ctx Amc Na Te Am S S3 Cf C Enr Cip
Enter-Vet Report 2007-2008
��
Analisi della multiresistenza
I risultati degli antibiogrammi sono stati elaborati al fine di evidenziare la presenza e le caratteri-stiche dei ceppi multiresistenti. Si considera multiresistente un ceppo che presenta resistenza nei confronti di almeno quattro fra le molecole testate.Nella tabella 18 vengono riportati i risultati relativi alla distribuzione delle multiresistenze per sie-rotipo nel 2007 e 2008.
I dati raccolti permettono di confermare che in generale la percentuale di ceppi multiresistenti è comparabile con quelle registrate negli anni precedenti (703 ceppi, pari al 30.99% degli isolati nel 2006; 469 ceppi, pari al 41,5 % degli isolati nel 2007; 309 ceppi, pari al 32% degli isolati nel 2008).
Nei grafici da 7 a 10 vengono evidenziati i pattern di resistenza dei principali sierotipi multiresistenti dal 2006 al 2008.
Multiresistance Analysis
The results of the antimicrobial sensitivity testing have been analysed in order to highlight the pre-sence and the characteristics of multiresistant strainSalmonella A multiresistant isolate is a strain resistant to at least 4 of the compounds tested. In Table 18 the distribution of multiresistant strains for each serovar in 2007 and 2008 is reported.
Data collected allow to confirm that in the last two years the rates of multiresistant isolates are comparable to the ones reported previously (703 strains (30.99%) in 2006; 469 strains (41,5 %) in 2007; 309 strains (32%) in 2008).
In Graphs 7 - 10 the resistance patterns of the most frequent multiresistant serotypes from 2006 to 2008 are highlighted.
Enter-Vet Report 2007-2008
��
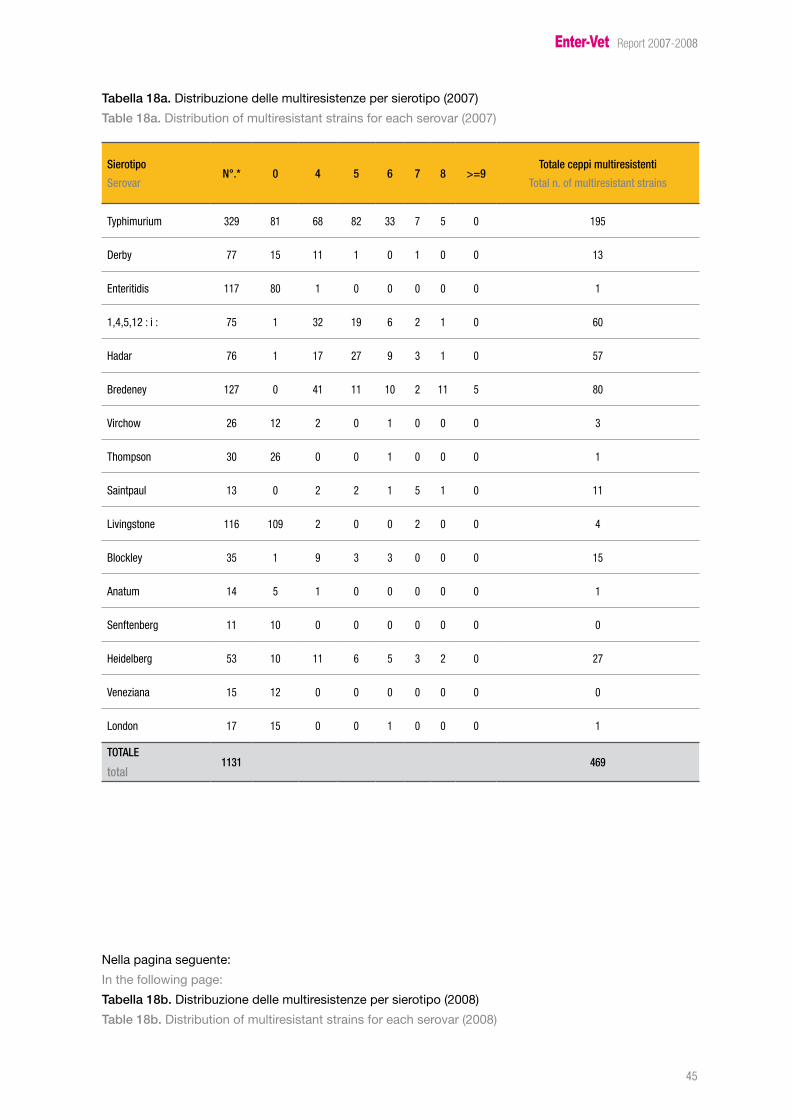
Tabella 18a. Distribuzione delle multiresistenze per sierotipo (2007)
Table 18a. Distribution of multiresistant strains for each serovar (2007)
Sierotipo
SerovarN°.* 0 4 5 6 7 8 >=9
Totale ceppi multiresistenti
Total n. of multiresistant strains
Typhimurium �29 8� �8 82 �� 7 � 0 �9�
Derby 77 �� �� � 0 � 0 0 ��
Enteritidis ��7 80 � 0 0 0 0 0 �
�,�,�,�2 : i : 7� � �2 �9 � 2 � 0 �0
Hadar 7� � �7 27 9 � � 0 �7
Bredeney �27 0 �� �� �0 2 �� � 80
Virchow 2� �2 2 0 � 0 0 0 �
Thompson �0 2� 0 0 � 0 0 0 �
Saintpaul �� 0 2 2 � � � 0 ��
Livingstone ��� �09 2 0 0 2 0 0 �
Blockley �� � 9 � � 0 0 0 ��
Anatum �� � � 0 0 0 0 0 �
Senftenberg �� �0 0 0 0 0 0 0 0
Heidelberg �� �0 �� � � � 2 0 27
Veneziana �� �2 0 0 0 0 0 0 0
London �7 �� 0 0 � 0 0 0 �
TOTALE
total1131 469
Nella pagina seguente:
In the following page:
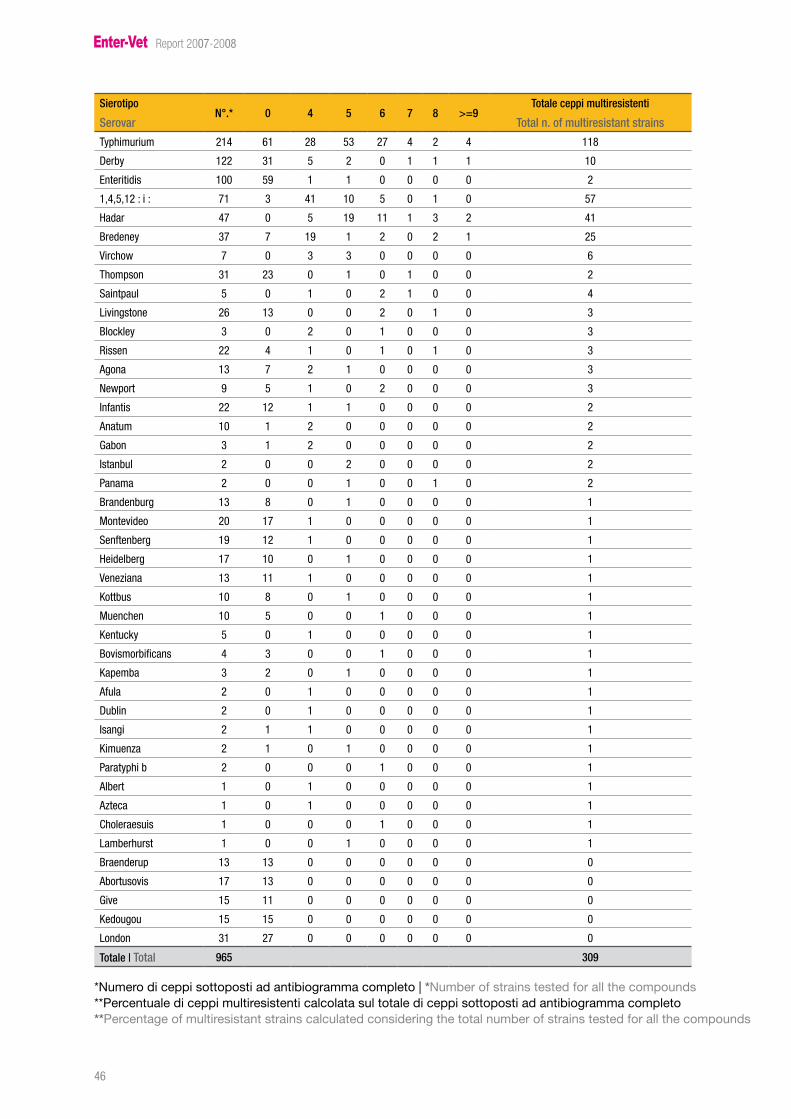
Tabella 18b. Distribuzione delle multiresistenze per sierotipo (2008)
Table 18b. Distribution of multiresistant strains for each serovar (2008)
Enter-Vet Report 2007-2008
��
Sierotipo
SerovarN°.* 0 4 5 6 7 8 >=9
Totale ceppi multiresistenti
Total n. of multiresistant strains
Typhimurium 2�� �� 28 �� 27 � 2 � ��8
Derby �22 �� � 2 0 � � � �0
Enteritidis �00 �9 � � 0 0 0 0 2
�,�,�,�2 : i : 7� � �� �0 � 0 � 0 �7
Hadar �7 0 � �9 �� � � 2 ��
Bredeney �7 7 �9 � 2 0 2 � 2�
Virchow 7 0 � � 0 0 0 0 �
Thompson �� 2� 0 � 0 � 0 0 2
Saintpaul � 0 � 0 2 � 0 0 �
Livingstone 2� �� 0 0 2 0 � 0 �
Blockley � 0 2 0 � 0 0 0 �
Rissen 22 � � 0 � 0 � 0 �
Agona �� 7 2 � 0 0 0 0 �
Newport 9 � � 0 2 0 0 0 �
Infantis 22 �2 � � 0 0 0 0 2
Anatum �0 � 2 0 0 0 0 0 2
Gabon � � 2 0 0 0 0 0 2
Istanbul 2 0 0 2 0 0 0 0 2
Panama 2 0 0 � 0 0 � 0 2
Brandenburg �� 8 0 � 0 0 0 0 �
Montevideo 20 �7 � 0 0 0 0 0 �
Senftenberg �9 �2 � 0 0 0 0 0 �
Heidelberg �7 �0 0 � 0 0 0 0 �
Veneziana �� �� � 0 0 0 0 0 �
Kottbus �0 8 0 � 0 0 0 0 �
Muenchen �0 � 0 0 � 0 0 0 �
Kentucky � 0 � 0 0 0 0 0 �
Bovismorbificans � � 0 0 � 0 0 0 �
Kapemba � 2 0 � 0 0 0 0 �
Afula 2 0 � 0 0 0 0 0 �
Dublin 2 0 � 0 0 0 0 0 �
Isangi 2 � � 0 0 0 0 0 �
Kimuenza 2 � 0 � 0 0 0 0 �
Paratyphi b 2 0 0 0 � 0 0 0 �
Albert � 0 � 0 0 0 0 0 �
Azteca � 0 � 0 0 0 0 0 �
Choleraesuis � 0 0 0 � 0 0 0 �
Lamberhurst � 0 0 � 0 0 0 0 �
Braenderup �� �� 0 0 0 0 0 0 0
Abortusovis �7 �� 0 0 0 0 0 0 0
Give �� �� 0 0 0 0 0 0 0
Kedougou �� �� 0 0 0 0 0 0 0
London �� 27 0 0 0 0 0 0 0
Totale | Total 965 309
*Numero di ceppi sottoposti ad antibiogramma completo | *Number of strains tested for all the compounds**Percentuale di ceppi multiresistenti calcolata sul totale di ceppi sottoposti ad antibiogramma completo**Percentage of multiresistant strains calculated considering the total number of strains tested for all the compounds
Enter-Vet Report 2007-2008
�7
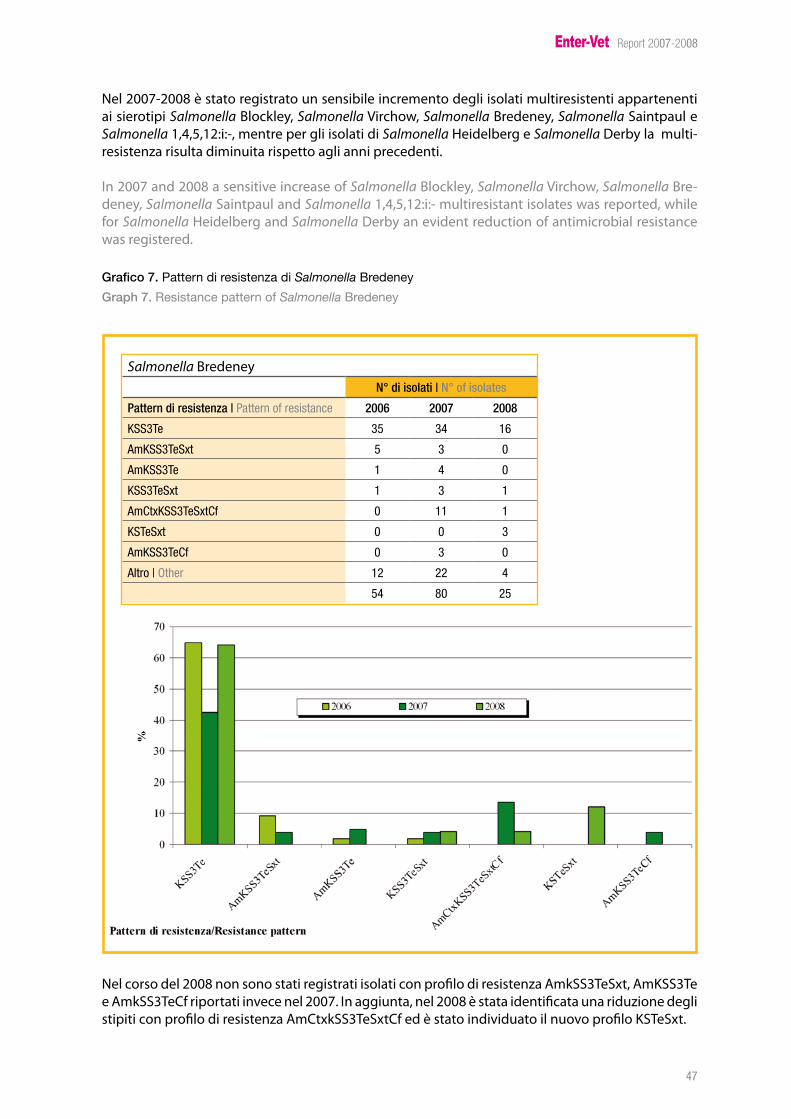
Nel 2007-2008 è stato registrato un sensibile incremento degli isolati multiresistenti appartenenti ai sierotipi Salmonella Blockley, Salmonella Virchow, Salmonella Bredeney, Salmonella Saintpaul e Salmonella 1,4,5,12:i:-, mentre per gli isolati di Salmonella Heidelberg e Salmonella Derby la multi-resistenza risulta diminuita rispetto agli anni precedenti.
In 2007 and 2008 a sensitive increase of Salmonella Blockley, Salmonella Virchow, Salmonella Bre-deney, Salmonella Saintpaul and Salmonella 1,4,5,12:i:- multiresistant isolates was reported, while for Salmonella Heidelberg and Salmonella Derby an evident reduction of antimicrobial resistance was registered.
Grafico 7. Pattern di resistenza di Salmonella Bredeney
Graph 7. Resistance pattern of Salmonella Bredeney
Salmonella BredeneyN° di isolati | N° of isolates
Pattern di resistenza | Pattern of resistance 2006 2007 2008
KSS�Te �� �� ��
AmKSS�TeSxt � � 0
AmKSS�Te � � 0
KSS�TeSxt � � �
AmCtxKSS�TeSxtCf 0 �� �
KSTeSxt 0 0 �
AmKSS�TeCf 0 � 0
Altro | Other �2 22 �
�� 80 2�
Nel corso del 2008 non sono stati registrati isolati con profilo di resistenza AmkSS3TeSxt, AmKSS3Te e AmkSS3TeCf riportati invece nel 2007. In aggiunta, nel 2008 è stata identificata una riduzione degli stipiti con profilo di resistenza AmCtxkSS3TeSxtCf ed è stato individuato il nuovo profilo KSTeSxt.
Enter-Vet Report 2007-2008
�8
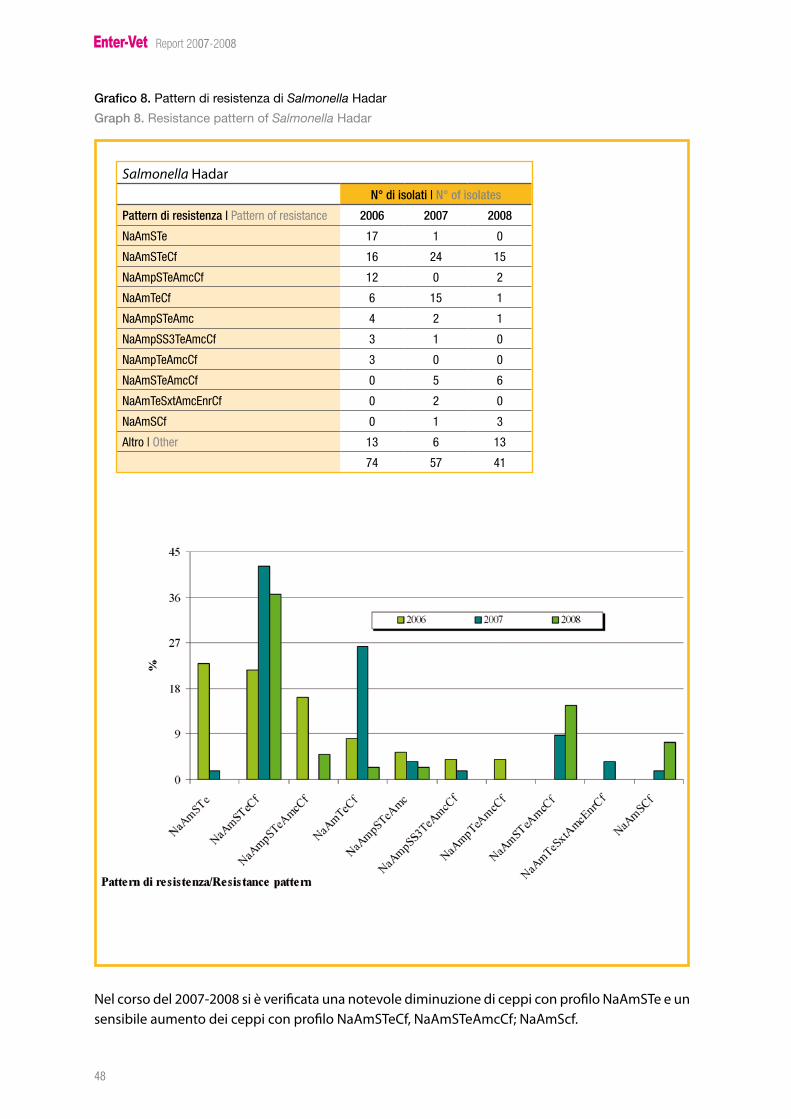
Grafico 8. Pattern di resistenza di Salmonella Hadar
Graph 8. Resistance pattern of Salmonella Hadar
Salmonella HadarN° di isolati | N° of isolates
Pattern di resistenza | Pattern of resistance 2006 2007 2008
NaAmSTe �7 � 0
NaAmSTeCf �� 2� ��
NaAmpSTeAmcCf �2 0 2
NaAmTeCf � �� �
NaAmpSTeAmc � 2 �
NaAmpSS�TeAmcCf � � 0
NaAmpTeAmcCf � 0 0
NaAmSTeAmcCf 0 � �
NaAmTeSxtAmcEnrCf 0 2 0
NaAmSCf 0 � �
Altro | Other �� � ��
7� �7 ��
Nel corso del 2007-2008 si è verificata una notevole diminuzione di ceppi con profilo NaAmSTe e un sensibile aumento dei ceppi con profilo NaAmSTeCf, NaAmSTeAmcCf; NaAmScf.
Enter-Vet Report 2007-2008
�9
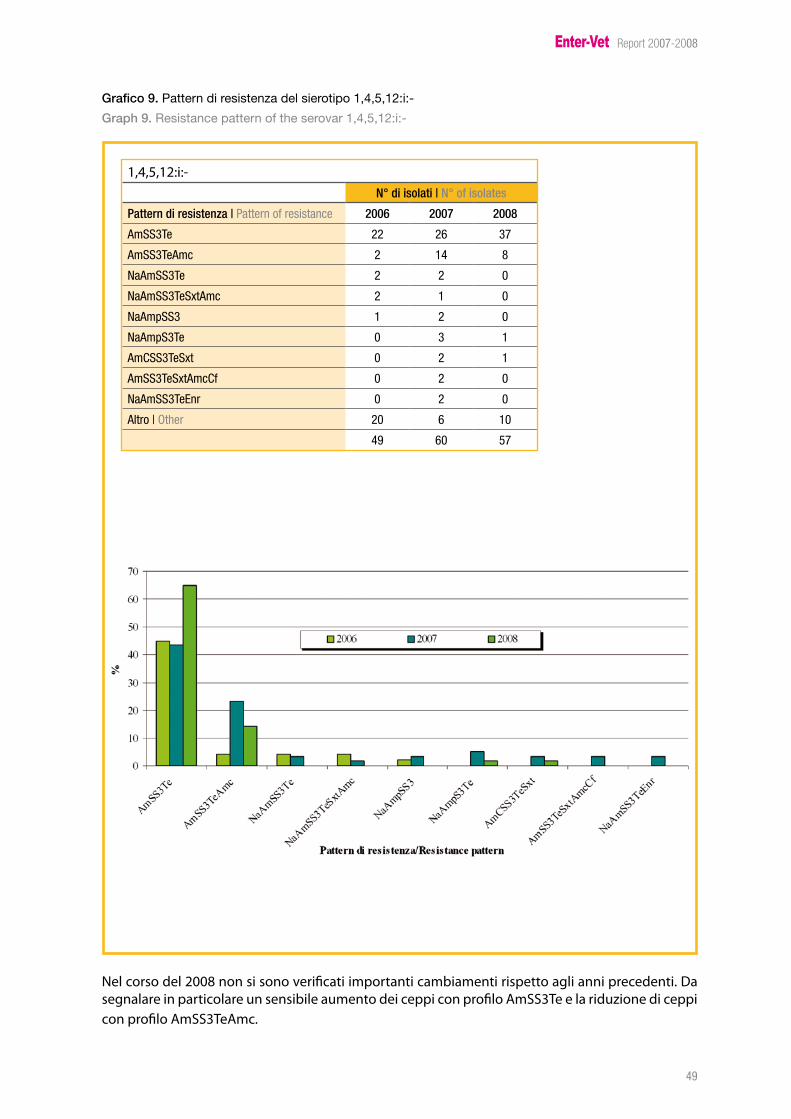
Grafico 9. Pattern di resistenza del sierotipo 1,4,5,12:i:-
Graph 9. Resistance pattern of the serovar 1,4,5,12:i:-
1,4,5,12:i:-N° di isolati | N° of isolates
Pattern di resistenza | Pattern of resistance 2006 2007 2008
AmSS�Te 22 2� �7
AmSS�TeAmc 2 �� 8
NaAmSS�Te 2 2 0
NaAmSS�TeSxtAmc 2 � 0
NaAmpSS� � 2 0
NaAmpS�Te 0 � �
AmCSS�TeSxt 0 2 �
AmSS�TeSxtAmcCf 0 2 0
NaAmSS�TeEnr 0 2 0
Altro | Other 20 � �0
�9 �0 �7
Nel corso del 2008 non si sono verificati importanti cambiamenti rispetto agli anni precedenti. Da segnalare in particolare un sensibile aumento dei ceppi con profilo AmSS3Te e la riduzione di ceppi con profilo AmSS3TeAmc.
Enter-Vet Report 2007-2008
�0
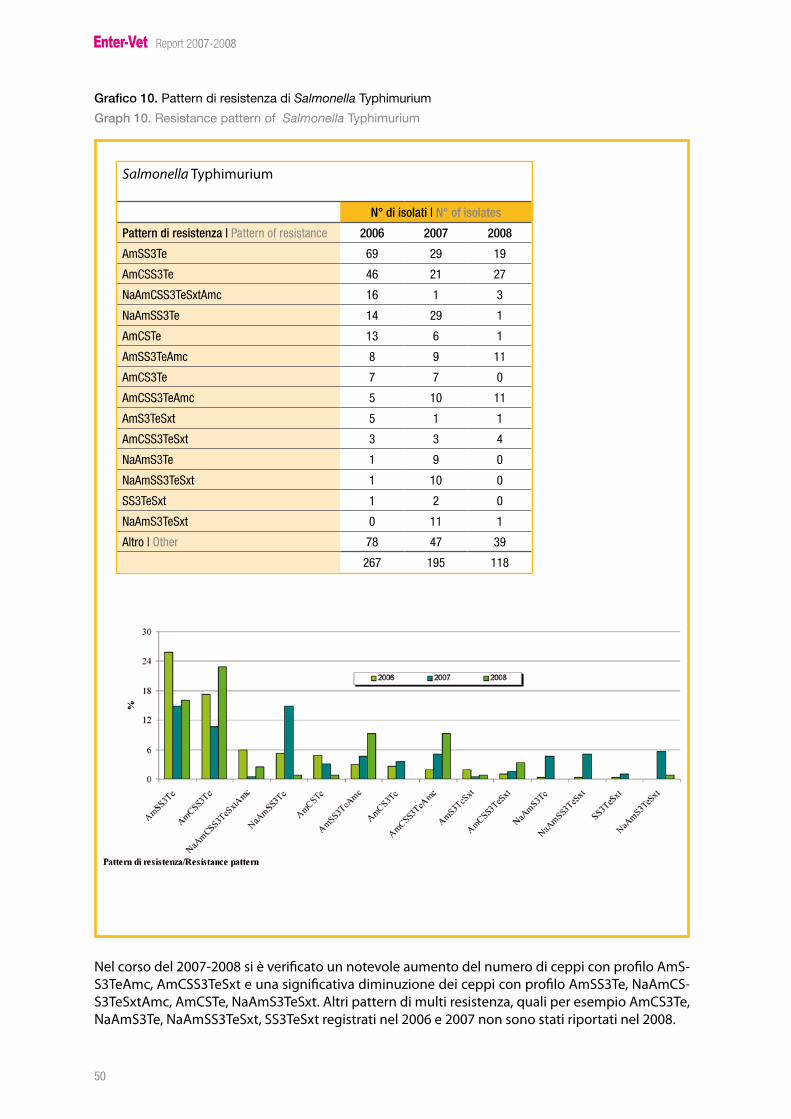
Grafico 10. Pattern di resistenza di Salmonella Typhimurium
Graph 10. Resistance pattern of Salmonella Typhimurium
Nel corso del 2007-2008 si è verificato un notevole aumento del numero di ceppi con profilo AmS-S3TeAmc, AmCSS3TeSxt e una significativa diminuzione dei ceppi con profilo AmSS3Te, NaAmCS-S3TeSxtAmc, AmCSTe, NaAmS3TeSxt. Altri pattern di multi resistenza, quali per esempio AmCS3Te, NaAmS3Te, NaAmSS3TeSxt, SS3TeSxt registrati nel 2006 e 2007 non sono stati riportati nel 2008.
Salmonella Typhimurium
N° di isolati | N° of isolates
Pattern di resistenza | Pattern of resistance 2006 2007 2008
AmSS�Te �9 29 �9
AmCSS�Te �� 2� 27
NaAmCSS�TeSxtAmc �� � �
NaAmSS�Te �� 29 �
AmCSTe �� � �
AmSS�TeAmc 8 9 ��
AmCS�Te 7 7 0
AmCSS�TeAmc � �0 ��
AmS�TeSxt � � �
AmCSS�TeSxt � � �
NaAmS�Te � 9 0
NaAmSS�TeSxt � �0 0
SS�TeSxt � 2 0
NaAmS�TeSxt 0 �� �
Altro | Other 78 �7 �9
2�7 �9� ��8
Enter-Vet Report 2007-2008
��
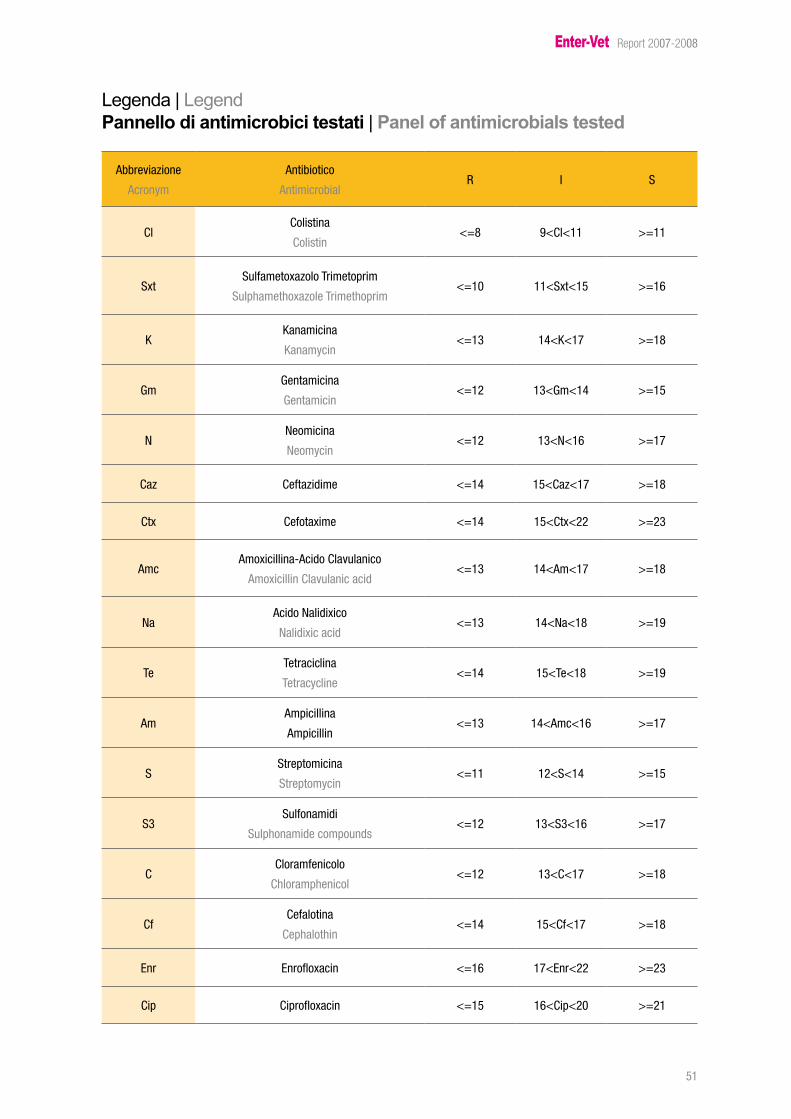
Legenda | LegendPannello di antimicrobici testati | Panel of antimicrobials tested
Abbreviazione
Acronym
Antibiotico
AntimicrobialR I S
ClColistina
Colistin<=8 9<Cl<�� >=��
SxtSulfametoxazolo Trimetoprim
Sulphamethoxazole Trimethoprim<=�0 ��<Sxt<�� >=��
KKanamicina
Kanamycin<=�� ��<K<�7 >=�8
GmGentamicina
Gentamicin<=�2 ��<Gm<�� >=��
NNeomicina
Neomycin<=�2 ��<N<�� >=�7
Caz Ceftazidime <=�� ��<Caz<�7 >=�8
Ctx Cefotaxime <=�� ��<Ctx<22 >=2�
AmcAmoxicillina-Acido Clavulanico
Amoxicillin Clavulanic acid<=�� ��<Am<�7 >=�8
NaAcido Nalidixico
Nalidixic acid<=�� ��<Na<�8 >=�9
TeTetraciclina
Tetracycline<=�� ��<Te<�8 >=�9
AmAmpicillina
Ampicillin<=�� ��<Amc<�� >=�7
SStreptomicina
Streptomycin<=�� �2<S<�� >=��
S�Sulfonamidi
Sulphonamide compounds<=�2 ��<S�<�� >=�7
CCloramfenicolo
Chloramphenicol<=�2 ��<C<�7 >=�8
CfCefalotina
Cephalothin<=�� ��<Cf<�7 >=�8
Enr Enrofloxacin <=�� �7<Enr<22 >=2�
Cip Ciprofloxacin <=�� ��<Cip<20 >=2�
Enter-Vet Report 2007-2008
�2
BibliografiaReferencesPerformance Standards for Antimicrobial Disk and Dilution Susceptibility tests for Bacteria isolated from Animals; approved standard. Third edition CLSI Document M31-A3. CLSI, Wayne, Pennsylva-nia, USA. 2002 (Clinical and Laboratory Standard Institute, ex NCCLS).Performance Standards for Antimicrobial Susceptibility Testing: Fourteenth Information supple-ment. NCCLS Document M100-S14. NCCLS, Wayne, Pennsylvania, USA. 2008 (The national commit-tee for clinical laboratory standards).
Enter-Vet Report 2007-2008
��
Conclusioni
Il presente report vuole rappresentare uno strumento d’aiuto per coloro che intervengono a diver-so livello nell’ambito della sanità pubblica e della sanità animale fornendo loro dati attendibili per formulare valutazione sulle fonti di Salmonella spp., sulle tendenze degli isolamenti del patogeno e sull’entità della resistenza agli antimicrobici. I dati raccolti nel corso del biennio 2007-2008 hanno permesso di riconfermare l’efficacia del sistema di sorveglianza Enter-Vet, grazie soprattutto alla capillare partecipazione delle istituzioni coinvolte.La procedura di raccolta e trasmissione dei dati risulta oramai pienamente rodata e correttamente adottata da tutti i partecipanti al network. Ciò ha permesso di raccogliere una notevole mole di in-formazioni per verificare l’andamento degli isolamenti e della resistenza agli antibiotici degli stipiti di Salmonella spp., un aspetto di rilevante importanza dal punto di vista epidemiologico anche alla luce della normativa europea sulle zoonosi (direttiva 99 2003 EC e Regolamento 2160 2003 EC). Al fine di elevare ulteriormente la qualità dei dati raccolti e pertanto l’utilità della rete di sorve-glianza, si ritiene utile sottolineare l’importanza di riportare tutte le informazioni epidemiologiche disponibile relativamente ai ceppi isolati, in modo tale da ridurre il più possibile gli isolati classificati come “non conosciuti”.Si ringraziano dunque quanti continuano a garantire la raccolta delle informazioni epidemiologiche che costituiscono la base per la realizzazione di questo report, invitando chi ne usufruirà a segnala-re qualunque aspetto che possa contribuire a rendere più efficiente l’attività della rete Enter-Vet e la divulgazione delle informazioni raccolte.
Conclusions
This report is intended as a tool to support people involved in different fields of public health and animal health. It provides reliable data in order to evaluate the main sources of Salmonella, the trends in the frequency of isolation of Salmonella spp. strains and the trends of antimicrobial sensi-tivity. Data collected in 2008 and 2009 allow to assess the effectiveness of The Enter-Vet surveillance, achieved through the good participation of all institutions involved. By now the participants of the network have fully acquired the procedure for collecting and tran-smitting data.In this way it has been possible to collect a great amount of information in order to monitor the diffusion of Salmonella spp. and the burden of antimicrobial resistance of the pathogen. This last aspect is considered crucial by the UE legislation on zoonoses (directive 2003 99 EC and regulation (EC) No 2160 2003) and is very important from an epidemiological point of view.In order to further improve the quality of the data collected and consequently the output of the network it is important that institutions participating in the network transmit all the available epi-demiological information regarding the strains isolated in order to reduce the number of isolates classified as “unknown”. We wish to thank all the contributors to the realisation of this report, inviting the users to notify any aspect that may be useful to make the activity of the Enter-Vet net and the annual report more efficient.
Finito di stampare nel mese di maggio 2010
Centro di referenza nazionale per le salmonellosiIstituto Zooprofilattico Sperimentale delle Venezie