UNIVERSITÀ DEGLI STUDI DI PADOVA
Sede Amministrativa: Università degli Studi di Padova
DIPARTIMENTO DI PRINCIPI E IMPIANTI DI INGEGNERIA CHIMICA “I. Sorgato”
SCUOLA DI DOTTORATO DI RICERCA IN INGEGNERIA INDUSTRIALE
INDIRIZZO: INGEGNERIA CHIMICA
CICLO XXII
SVILUPPO E APPLICAZIONE DI METODOLOGIE PER LO
SCALE-UP E L’OTTIMIZZAZIONE DI PROCESSI PER LA
PRODUZIONE DI ETANOLO DA MATERIALI
LIGNOCELLULOSICI
Direttore della scuola: Ch.mo Prof. Paolo Bariani
Coordinatore d’indirizzo: Ch.mo Prof. Alberto Bertucco
Supervisore: Ing. Fabrizio Bezzo
Dottoranda: Chiara Piccolo
Foreword
The realization of this work has involved the intellectual and financial support of many people
and institution, to whom the author is most grateful.
Most of the research activity that led to the results summarized in this Thesis has been carried
out at DIPIC, the Department of Chemical Engineering of the University of Padova, under the
supervision of Dr. Fabrizio Bezzo. Part of the work has been conducted under the supervision
of Prof. Gunnar Lidén, at the KEMITEKNIK- LTH - Chemical Engineering Department of
Lund University (Sweden).
This study have been carried out through the financial support of Fondazione CARIPARO
under the framework “Progetto Dottorati di Ricerca 2006”.
The scholarship of “Fondazione Ing. Aldo Gini” (Padova, Italy) and the partial financial
support from the University of Padova under Progetto di Ateneo 2007 (cod. CPDA071843)
“Bioethanol from lignocellulosic biomass: process and equipment development” are also
gratefully acknowledged.
All the material reported in this Thesis is original, unless explicit references to the authors are provided. In the following, a list of the publications stemmed from this project is reported.
PUBLICATIONS IN INTERNATIONAL JOURNALS C. Piccolo, M. Wiman, F. Bezzo, G. Lidén (2010). Enzyme adsorption on SO2 catalyzed steam-pretreated wheat and spruce material. Enzyme and Microbial Technology, 46, 159-169 C. Piccolo, F. Bezzo (2009). A techno-economical comparison between two technologies for bioethanol production from lignocellulose. Biomass and Bioenergy, 33, 478-491
PUBLICATION IN CONFERENCE PROCEEDINGS C. Piccolo, G. Lidén, F. Bezzo (2009), Effect of substrate specific area on lignocellulose enzymatic hydrolysis: An experimental and modeling investigation, In: Computer-Aided Chemical Engineering 27, 10th International Symp. on Process Systems Engineering (R.M. Brito-Alves, C.A. Oller do Nascimento, E.C. Biscaia Jr., Eds.), Elsevier, Amsterdam, The Netherlands, 1701-1706 C. Piccolo, F. Bezzo (2008), Verso un approccio model-based per la progettazione e l´ottimizzazione dei processi di fermentazione e idrolisi per la produzione di etanolo da lignocellulosa, Atti Convegno GRICU 2008 – 14-17 settembre 2008, Le Castella (KR), Italia, 601-604 C. Piccolo, F. Bezzo (2007), Ethanol from lignocellulosic biomass: a comparison between conversion technologies, In: Computer-Aided Chemical Engineering 24, 17th European Symp. on Computer Aided Process Engineering (V. Plesu and P.S. Agachi, Eds.), Elsevier, Amsterdam, The Netherlands, 1277-1282
Padova, 28th January 2010
Abstract
The conversion of biomass into biofuels can increase fuel flexibility and reduce the related
strategic vulnerability of petroleum based transportation fuel systems. Bioethanol has
received considerable attention over the last years as a fuel extender or even neat liquid fuel.
Lignocellulosic materials are very attractive substrates for the production of bioethanol
because of their low cost and their huge potential availability. A wide variety of processes for
the production of ethanol from cellulosic materials have been studied and are currently under
development and complex technical problems affecting the indicators of global process have
not been properly solved. Techno-financial analysis of the global processes along with the
design and development of each one of the involved operations, with special care for the most
critical and cost-effective steps are fundamental in order to the develop profitable processes,
select the best technological options and lead the research efforts to the directions with the
highest potential of costs reduction.
Process systems engineering could provide strategic tools for developing economically viable
and environmentally friendly technologies for the production of fuel ethanol. The overall goal
of this Thesis is to apply multi-scale modelling principles, techniques and tools to processes
for the production of fuel-ethanol from lignocellulosic biomass.
First, two different conversion options, the enzymatic hydrolysis and fermentation process
(EHF) and the gasification and fermentation process (GF) are considered and analysed in a
macroscale approach in order to select the best alternative on the basis of their efficiency
according to technical, economic, and environmental criteria. Accordingly, the EHF
technology was selected as the most mature and effective process alternative in the near-term.
Afterward emphasis was placed on the single unit operations, focusing on the investigation of
most critical and expensive ones. The task of enzymatic hydrolysis kinetic modelling was
therefore addressed and an experimental investigation was carried out in order to characterize
and better understand critical phenomena, to obtain experimental data for model validation
and parameters estimation. In particular, the purpose of the study was to simultaneously
assess the changes in specific surface area, surface morphology, enzyme adsorption and
enzymatic hydrolysis caused by varying the pretreatment conditions in SO2 catalyzed steam
pretreatment of different lignocellulosic substrates such as wheat straw and spruce.
A simple model structure, taking into account the main phenomena occurring, and the
different chemical-physical factors affecting the process, was identified and parameters
estimation was performed. A preliminary sensitivity study was carried out for analysing the
near-linear dependency between parameters and pointing out potential identificability issues.
Sommario
Attualmente i combustili fossili coprono il 96% del fabbisogno energetico del settore
trasporti. Questa quasi totale dipendenza dai combustibili fossili determina, tuttavia, una serie
di problematiche. Le riserve petrolifere sono limitate e non equamente distribuite nel mondo,
con le riserve più importanti in regioni politicamente instabili. Reali o anticipate flessioni
nella disponibilità del petrolio hanno condotto a rilevanti e repentini aumenti del prezzo del
petrolio stesso e a incertezza economica. Negli ultimi anni anche le preoccupazioni relative
all’ambiente hanno assunto particolare risonanza e le emissioni di CO2 fossile sono indicate
come uno dei fattori responsabili del riscaldamento globale.
Per tutti questi motivi una diversificazione delle fonti primarie di energia per la produzione di
combustibili è necessaria, in modo particolare per quelle forme di energia che sono già
disponibili o almeno più equamente distribuite del petrolio.
Il bioetanolo prodotto a partire da biomassa lignocellulosica si presenta come uno dei
possibili candidati a sostituire quote di carburante fossile dal momento che la materia prima è
abbondante, distribuita su tutto il territorio, e di facile approvvigionamento, e inoltre permette
un’elevata riduzione delle emissioni di gas serra.
Una grande varietà di substrati può essere utilizzata per produrre etanolo: residui
dell’industria agro-forestale, colture energetiche, rifiuti solidi urbani di natura organica,
materiali di natura erbacea e arborea, residui dell’industria del legno e della carta. Tutti questi
materiali non ricadono nella categoria di substrati, come i cereali, affetti dal problema
cosiddetto “feed for fuel”, ovvero l’utilizzo a fini energetici di colture destinate in precedenza
ad esclusivo uso alimentare.
Nonostante tutti questi benefici, la produzione su scala commerciale di bioetanolo da
lignocellulosa è tuttora impedita da una serie di barriere tecniche ed economiche: lo scale-up
delle apparecchiature è complesso e affetto da problematiche di scala; l’ottimizzazione dei
consumi energetici e idrici è essenziale per l’economicità del processo, così come la
valorizzazione di tutte le frazioni della biomassa (organica e lignina); l’utilizzo di dati
affidabili e rappresentativi per le stime di costo dell’investimento e del prodotto; la
determinazione dell’impatto ambientale e socio-economico.
In generale non è ancora possibile identificare una procedura per selezionare la migliore
opzione tecnologica, per ottimizzare le singole unità operative e il processo nel suo
complesso, per stimare in modo inequivocabile la fattibilità tecnico-economica di un progetto.
In questa Tesi i principi della modellazione multiscala e della sintesi di processo sono stati
applicati per raggiungere alcuni di questi obiettivi. Per conseguire un maggiore livello di
conoscenza delle reali problematiche del processo e degli aspetti critici dell’esercizio, si è
ritenuto fondamentale affiancare all’attività di simulazione e modellazione l’attività
sperimentale, condotta presso il Dipartimento di Ingegneria Chimica dell’Università di Lund,
dotato di apparecchiature e strumenti analitici avanzati e con ventennale esperienza di ricerca
nel campo del bioetanolo di seconda generazione. La Tesi è strutturata come segue.
Nel primo capitolo si analizza la diffusione (attuale e potenziale) nel mondo e, in
particolare, in Europa del bioetanolo lignocellulosico e la distribuzione delle materie prime, si
evidenziano costi e benefici derivanti dall’utilizzo di questo carburante, le iniziative
governative, per promuovere l’uso dei biocarburanti. Infine, si descrivono le principali
caratteristiche fisico-chimiche della biomassa che influenzano i processi di conversione e
sono discusse le opzioni tecnologiche attualmente disponibili, soffermandosi sull’analisi della
letteratura e sullo stato dell’arte dei diversi stadi di processo coinvolti.
La conversione dei substrati lignocellulosici in etanolo può essere ottenuta attraverso due
approcci tecnologici. La via biochimica, a cui si farà riferimento con l’acronimo EHF
(Enzymatic Hydrolysis and Fermentation process) prevede l’utilizzo di enzimi per convertire
le frazioni cellulosica ed emicellulosica della biomassa in zuccheri semplici, successivamente
fermentati da microorganismi (lieviti, batteri, funghi) in etanolo. La lignina è rimossa ed
utilizzata come combustibile per la produzione di calore ed elettricità, e/o co-prodotti ad
elevato valore aggiunto. Il processo è multistadio e prevede cinque step principali: pre-
trattamento, idrolisi enzimatica, fermentazione, recupero del prodotto e co-generazione.
La seconda opzione tecnologica è rappresentata dal processo termochimico-biologico, nel
testo menzionato con l’acronimo GF (Gasification and Fermentation process). Questo
processo prevede uno stadio di pirolisi/gassificazione della biomassa al fine di produrre gas di
sintesi (principalmente CO e H2) che, dopo essere stati raffreddati e condizionati, vengono
fermentati da opportuni microbi. Il gas non convertito può essere riciclato al reattore o
bruciato in un sistema di combustore-turbina multistadio per produrre energia elettrica.
Nel Capitolo 2 tecniche di simulazione di processo sono utilizzate per analizzare,
ottimizzare e valutare la sintesi di processo delle tecnologie EHF e GF al fine di selezionare
l’opzione tecnologica più promettente, sulla base di criteri quali le rese produttive, il
potenziale di ottimizzazione delle diverse apparecchiature, indici di redditività e potenziale di
riduzione dei costi. I modelli hanno permesso di valutare produttività, consumi, opportunità di
cogenerazione di vapore ed elettricità, possibilità di integrazioni processistiche, e sensitività ai
parametri operativi. I dati raccolti sono serviti come punto di partenza per un’analisi
finanziaria che ha portato alla determinazione del costo di investimento e di prodotto, e dei
principali indici per la valutazione dell’investimento (NPV, IRR, ROI, EROI, ethanol pay
back price). Il processo EHF è risultato essere oggi l’alternativa più matura ed efficace. Si è
pertanto deciso di soffermarsi su un’analisi più dettagliata di quelli che sono emersi come gli
stadi più problematici del processo EHF, al fine di supportare il lavoro di modellazione con
una più profonda conoscenza dei fenomeni che sono alla base della conversione dei substrati
lignocellulosici. L’indagine sperimentale compiuta ha rivestito, in quest’ottica di acquisizione
delle informazioni fondamentali sul processo, un ruolo essenziale. In particolare, molti dei
meccanismi alla base degli stadi di pretrattamento e di idrolisi enzimatica della lignocellulosa
non sono stati ancora pienamente compresi come pure il ruolo dei diversi parametri che
caratterizzano il complesso enzima-substrato e impattano, più o meno direttamente, la cinetica
e le rese finali di prodotto sono scarsamente conosciuti.
Il Capitolo 3 si apre con una panoramica dei diversi fattori che influenzano il processo di
idrolisi enzimatica, distinguendo fattori legati all’enzima (composizione e attività della
miscela enzimatica, inibizione da prodotto, sinergismo, adsorbimento produttivo e non
produttivo al substrato) e fattori legati al substrato (cristallinità, grado di polimerizzazione,
presenza e distribuzione della lignina, superficie accessibile). Sono successivamente esposte
le motivazioni che hanno condotto a pianificare un’indagine sperimentale sull’effetto della
superficie specifica (SSA) del substrato sottoposto a pretrattamento (steam explosion acido-
catalizzata) sulla cinetica di idrolisi enzimatica. Un approccio a tre stadi è stato utilizzato:
sono state determinate sperimentalmente la SSA e la distribuzione dei pori di due
diversi substrati (abete e paglia di grano) sottoposti a condizioni di pretrattamento di
diversa severità;
sono stati condotti esperimenti di adsorbimento di enzima sui diversi substrati;
si sono, infine, effettuati esperimenti di idrolisi enzimatica.
Le metodologie e gli strumenti adottati e i risultati dell’attività sono ampiamente descritti e
discussi nel Capitolo.
Infine, nel Capitolo 4 si affronta nuovamente l’aspetto della descrizione quantitativa dei
fenomeni. Il Capitolo presenta un’analisi critica dei principali modelli cinetici di idrolisi
enzimatica, classificati in modelli empirici, deterministici, functionally based e structurally
based. Una sezione a parte è dedicata ai modelli di adsorbimento, fenomeno fondamentale del
processo. Un’analisi critica di questi modelli, unita alla conoscenza del processo acquisita
sperimentalmente, ha portato ad individuare una struttura semplice che fosse allo stesso
tempo identificabile e capace di rendere conto dei diversi fenomeni che hanno luogo nel
sistema.
Partendo dalla tradizionale descrizione dell’adsorbimento attraverso l’isoterma di Langmuir,
si è sviluppato un modello che incorpora la superficie del substrato accessibile all’enzima,
determinata sperimentalmente, come parametro critico. Tale modello è stato inglobato nella
struttura di un tradizionale modello di idrolisi a tre reazioni. I parametri del modello sono stati
identificati e la sensitività delle variabili di controllo ai diversi parametri è stata valutata. La
capacità del modello di predire i dati sperimentali si è rivelata soddisfacente.
Considerazioni sui possibili sviluppi e sulle opportunità di approfondimento delle tematiche
di modellazione di macro e micro scala e sull’analisi tecno-economica dei processi di
produzione di etanolo da lignocellulosa sono riportati nella sezione conclusiva.
La struttura della Tesi è di seguito schematizzata:
Capitolo 1
Introduzione ai biocarburanti Etanolo lignocellulosico: caratteristiche
della biomassa e processi di conversione
Esame della letteratura specifica
Capitolo 2
Analisi tecno-economica dei processi EHF e GF
Capitolo 3
Fattori che influenzano il meccanismo di
idrolisi enzimatica
Indagine sperimentale sull’effetto di
SSA sull’adsorbimento enzimatico e
sulla cinetica di idrolisi
Capitolo 4
Analisi della letteratura dedicata alla
modellazione cinetica del processo di
idrolisi enzimatica
Sviluppo del modello
Analisi preliminare di sensitività
parametrica
Stima dei parametri
Considerazioni conclusive
Risultati dello studio
Sviluppi futuri
Table of contents
LIST OF SYMBOLS……………………………………………………………………………………….……..1
CHAPTER 1 – THESIS OVERVIEW AND LITERATURE SURVEY…………………................................5
1.1 MOTIVATIONS………………………………….…………………………….……………………………...5
1.2 INTRODUCTION…………………………….……………………………….……………………………....6
1.3 BIOETHANOL AS A TRANSPORTATION FUEL…………………………...……...……………………..7
1.4 BIOETHANOL TRENDS AND PROJECTIONS………...…………………...……………………………...9
1.5 BIOMASS SOURCES FOR BIOETHANOL…………………………………………………………….…11
1.6 FIRST GENERATION BIOETHANOL…………………………………………….…………..…..............12
1.7 SECOND GENERATION ETHANOL……...…………………………………….……………………..….14
1.7.1 Lignocellulose biomass composition……………………………...…………….….….………………..15
1.7.1.1 Cellulose……………………...……………………………...……………….…………………….15
1.7.1.2 Hemicellulose…………………...……………………………...………….……………………….16
1.7.1.3 Lignin………………......…………………………………………………...……..………………..17
1.7.1.4 The composition of feedstock………..……………………………….….…….…...........................18
1.8 ENZYMATIC HYDROLYSIS AND FERMENTATION PROCESS….………………...…………………18
1.8.1 Pretreatment…………………………………………….…………………………………………………..19
1.8.1.1 Steam explosion acid catalyzed………….……..…………………………………………………..20
1.8.2 Enzymatic hydrolysis……………………………………………………………….................................20
1.8.3 Fermentation…………………………..…………….…………………………………………………..22
1.8.4 Integration options…………………………...…………………………………….................................22
1.8.5 Separation and cogeneration…………………………….……………………….….………………….23
1.8.6 State of the art of commercial ethanol plants………………………..………………...………………..25
1.9 THE GASIFICATION-FERMENTATION PROCESS…...……………….………………………………..27
1.9.1 Gasification……………………………………………………..…………………………………….…29
1.9.2 Fermentation………………………………………………..…………………………………………...29
1.9.2.1 Reactor design issues………………………………………………………...………………….….30
1.9.3 Recovery and cogeneration……………………………………………...………………………………30
1.9.4 Pennsylvania Cellulosic Fuel Ethanol Plant Begins Production…………….…….….………………...31
1.10 AIMS OF THE WORK……………………………………………………………………………………..31
CHAPTER 2 – TECHNO-ECONOMIC COMPARISON BETWEEN CONVERSION
TECHNOLOGIES………………………………………………………………………………………………33
2.1 LITERATURE SURVEY…………………………..……………………………………...…………………34
2.2 AIM OF THE STUDY……………………………..………………………………………………………....38
2.3 THE EHF PROCESS: MODELLING…………………..……………………………………………………39
2.4 THE EHF PROCESS: ENERGY OPTIMISATION………………………..………………………………..42
2.5 THE EHF PROCESS: HEAT AND POWER PRODUCTION……………………..………………………..44
2.6 THE EHF PROCESS: PROCESS SENSITIVITY ANALYSIS……………………………………..…….…45
2.7 THE EHF PROCESS: FINANCIAL ANALYSIS……………………………..………………………….….45
2.7.1. Equipment sizing and cost estimation…………………………………………………….………….....46
2.7.2. Payback analysis…………………………….……………………………...…………………………..47
2.7.3. Product cost sensitivity……………………………………………………...………...………………...49
2.8 THE GF PROCESS: MODELLING……………………………………………………………………….…50
2.9 THE GF PROCESS: HEAT AND POWER PRODUCTION………………………………………………..54
2.10 THE GF PROCESS: SENSITIVITY ANALYSIS…………………………..…………...............................55
2.11 THE GF PROCESS: FINANCIAL ANALYSIS…..………………….…………………………………….55
2.11.1 Cost estimation……………………………..…………………………………………………………..56
2.11.2 Payback analysis…………………………………………………...…………………………………..57
2.11.3 Product cost sensitivity……………………..…………………………………………………………..57
2.11.4 Additional comments on the GF process………………………….…………………………………...58
2.12 FINAL REMARKS…………………………..……………………………………………………………...59
CHAPTER 3 – EXPERIMENTAL INVESTIGATION OF ENZYME ADSORPTION ON SO2 STEAM-
PRETREATED MATERIALS……..……………………………………………………………………….….61
3.1 ENZYMATIC HYDROLYSIS OF LIGNOCELLULOSE…………….………………………...…………...62
3.1.1 Enzymes related rate limiting factors………..………………….…….………………………………....62
3.1.1.1 Enzyme mixtures activities…………………………………...……………………………..……...62
3.1.1.2 Synergism………………………………………………………..…………………..……………..64
3.1.1.3 Inhibition…….…………………………………………………...…………..……………………..64
3.1.1.4 Adsorption…………………………………………………………………………...……………..65
3.1.2 Substrates related rate limiting factors……………………..…………….……………..……………66
3.1.2.1 Crystallinity Index (CrI) …………………….....…………………….………...…………………..67
3.1.2.2 Degree of Polymerization………………....……………….…………………...…………………..67
3.1.2.3 Lignin…………………………………………………………………………………………….…67
3.1.2.4 Accessibility………………………………..………………………………………………………68
3.2 MOTIVATIONS FOR THE EXPERIMENTAL INVESTIGATION……….……………………….………69
3.3 MATERIALS & METHODS…………………..…………………….……………………………………….70
3.3.1 Substrates………..…………………………..……………….…….……………………………………70
3.3.2 Enzymes……………………………………....……………….…………………………………………71
3.3.3 BET measurements…………………………………………...……………………………………….…72
3.3.4 Adsorption isotherms studies…………………………………………………………………………….72
3.3.5 Hydrolysis studies…………………………………….………………………………………………….73
3.3.6 Scanning Electron Microscopy…………………………………………………….…………………….73
3.4 RESULTS…………………………………………………………………………….……………………….74
3.4.1 BET measurements of surface area and pore size distribution………………………………………….74
3.4.2 Adsorption experiments………………………………………………………………………………….77
3.4.3 Hydrolysis experiments………………………………………………………………………………….80
3.4.4 SEM pictures analysis………………………………………...…………………………………………84
3.5 DISCUSSION……………………………………………………...…………………………………………86
CHAPTER 4 – LIGNOCELLULOSE HYDROLYSIS KINETIC MODELLING……………………….. .91
4.1 QUANTITATIVE DESCRIPTION………………….………….……………………………………………91
4.1.1 Adsorption modelling: review…………………………………………………………..……………….92
4.1.2 Hydrolysis modelling: review……………….…………………………………………………………...93
4.1.2.1 Empirical models………………………………….………………………………………………..94
4.1.2.2 Mechanistic Models………………………………………………………………………………...95
4.1.2.3 Functionally and structurally based models…..……………………………………………………98
4.1.3 Declining rate………………...………………………………………………………………………….99
4.2 MODELLING APPROACH………………………………………….……………………………………..100
4.2.1 Adsorption model…………………………….………………………………………………………....100
4.2.2 Hydrolysis model…………………………….……………………………………………………...….101
4.3 MODEL IDENTIFICATION……………………..……………………………………………...………….103
4.3.1 Parameters estimation run……………………………………………………………………………..104
4.3.2 Sensitivity Analysis………….…………….……………………………………………………………106
4.3.3 Model Riparametrisation……………………………………………………………………………….109
4.3.4 Correlation matrix………………………………………………………………………………..…….112
4.4 DATA FITTING……………………….………….……………………………………………………...…114
4.5 DISCUSSION………………….………………….………………………………………………………...116
CONCLUSIONS AND PERSPECTIVES…..………………………………...…………………………...….117
REFERENCES……………………………………...………………………………………………………….119
ACKNOWLEDGEMENTS………………...……………………………………………………………....….143
List of symbols
General symbols, vectors and matrices
[CE] = Concentration of the enzyme-cellulose complex
Amax = Specific maximum cellulase adsorption
B = Generic product
C = Cellulose
c = Empirical coefficient
C0 = Initial cellulose concentration
CrI = Cristallinity Index
E = Total enzyme concentration
e = Number of cellulose sites covered by an adsorbed enzyme molecule
E1 = Exoglucanase enzyme concentration
E2 = Endoglucanase enzyme concentration
Ea = Concentration of the bound enzyme
Ef = Free enzyme concentration
eg = β-glucosidase specific activity
ereac = specific acitivy of the enzyme mixture
fC = Cellulose fraction
G = Glucose
G2 = Cellobiose
i = fraction of total enzyme which is not inhibited by product
2EK = Endoglucanase half-saturation constant
1EK = Exoglucanase half-saturation constant
Keq = Enzyme saturation constant
Kd = Equilibrium constant
ki = Rate constant
KI1 = Inhibition constant
KI2 = Inhibition constant
KM = Michaelis-Menten constant
kmax = Maximum specific reaction rate
KP = Dissociation constant
L = Lignin
n = Empirical coefficient
N = Number of measurement
NE = Number of experiment performed
2 List of symbols
NMij = Number of measurements of the jth variable in the ith experiment
NVi = Number of variables measured
P = Aggregated parameter
Qa,ij = Absolute sensitivity index of the jth parameter
Qr,ij = Relative sensitivity index of the jth parameter
R = Correlation matrix
ri = Reaction rate
S = Substrate concentration
S0 = Initial substrate concentration
scj = Scaling factor for the jth parameter
SSA = Specific Surface Area
t = Time
t1/2 = Time after which conversion reached the value (0.5Xmax)
V = Hydrolysis rate
V = Variance matrix
Vmax = Maximum hydrolysis rate
Vsyn,max = Maximum synergistic hydrolytic rate
Wmax = Maximum cellulase adsorption
X = Conversion
x = Vector of state variables
Xmax = Maximum conversion
Y/[C]0 = Fraction of substrate hydrolyzed
yijk = kth predicted value of the jth variable in the ith experiment
ˆijky = kth measured value of the jth variable in the ith experiment
Ymax/[C]0 = Maximum fractional conversion
ΔTmin = Minimum temperature difference between the hot and the cold sides in all
heat exchangers
Greek symbols
α = Fraction of surface accessible to enzyme
γ = Heteroscedasticity parameters of variance model
θ = Model parameters
Σ = Variance-covariance matrix of the measurement errors
σijk = Variance of the kth measurement of the jth variable in the ith experiment
φ = Lumped affinity constant
ω = Proportionality factors of variance model
Ф = Maximum likelihood objective function
ηisoentropic = Isoentropic efficiency
List of symbols 3
Acronyms
AFEX = Ammonia Fiber Explosion
BET = Brunauer, Emmet, Teller method
BGL = β-glucosidase
BIG/CC = Biomass Integrated Gasification Combined Cycle
CBH = Cellobiohydrolase
CBM = Carbohydrate-Binding Modules
CI = Confidence interval
DAE = Differential-algebraic equations
DDGS = Distiller Dried Grains with Solubles
DP = Polymerisation Degree
DPV = Viscosity Average Polymerisation Degree
DPW = Weight Average Polymerisation Degree
EG = Endoglucanase
EHF = Enzymatic hydrolysis and fermentation
EROI = Energy Return on Investment
FPA = Filter Paper Activity
GF = Gasification and fermentation
GHG = Green House Gases
HEC = Hydroxyethylcellulose
HMF = Hydroxymethyl furfural
HPLC = High Pressure Liquid Cromatography
HP = High Pressure steam
LHW = Liquid Hot Water
LP = Low Pressure steam
NPV = Net Present Value
NREL = National Renewable Energy Laboratory
PB 10 = Pay back price for a 10 years pay back time
PB 5 = Pay back price for a 5 years pay back time
PTA = Pinch Technology Analysis
ROI = Return of Investment
S1 = Optimal pretreated spruce
S2 = Non optimal pretreated spruce
SAXS = Small Angle X-ray Scattering
SEM = Scanning Electron Microscopy
SHF = Separate Hydrolysis and Fermentation
SSA = Specific Surface Area
SSCF = Simultaneous Saccharification and Co-Fermentation
4 List of symbols
SSF = Simultaneous Saccharification and Fermentation
TPC 10 = Total product cost for a 10 years pay back time
TPC 5 = Total product cost for a 5 years pay back time
WIS = Water Insoluble Solids
WS1 = Wheat straw treated at conditions set 1
WS2 = Wheat straw treated at conditions set 2
WS3 = Wheat straw treated at conditions set 3
WS4 = Wheat straw treated at conditions set 4
WWT = Waste Water Treatment
Chapter 1
Thesis overview and literature survey
1.1 Motivations
Growing environmental concerns over the use and depletion of non-renewable fuel sources,
together with the increasing price of oil and instabilities in the oil market, have recently stimulated
interest in developing processes for large-scale production of liquid transport fuels derived from
renewable resources, such as bioethanol. Lignocellulosic materials offer unique and desirable
features: a secure, abundant and cheap source of supply, limited conflict with land use for food and
feed production, typical of first generation biofuels. Lignocellulosic ethanol used as a replacement
for gasoline can reduce CO2 emissions by 90% (Ward and Singh, 2002) and can help fulfil the
commitments of the 1997 Kyoto protocol. The process alternatives for biological production of
ethanol from forest and agricultural residues, or dedicated lignocellulosic crops, offers these
benefits but their development is still hampered by economic and technical obstacles: process scale-
up and integration to minimize energy and water demand; characterization and valuation of the
lignin usage; use of representative and reliable data for cost estimation, determination of
environmental and socio-economic impacts. A well-grounded methodology to select the best
technological option, to address the task of single units operation and overall process optimization
and to perform techno-financial assessment is still to be defined.
In this work multi-scale modelling principles, techniques and tools have been applied to fulfil these
purposes. Dynamic process modelling and process synthesis methods were first integrated in a
techno-economic analysis of two, regarded ad the most promising biotechnological process routes
for bioethanol production, namely the enzymatic hydrolysis and fermentation process and the
gasification-fermentation route. Dynamic simulation, optimization and costs assessments were
performed and enabled to determine where technological and economic bottlenecks are settled and
to evaluate the potential for improvements of processes’ performances. As a result of this
assessment the enzymatic hydrolysis and fermentation process was selected as the viable near-term
option at the state of the art and the investigation of single critical unit operations within this
process was addressed to tackle the obstacles that hinder process transition to commercial scale. In
the past 50 years, there has been a constant influx of research publications addressing the enzymatic
kinetics of cellulose degradation, which is together with pretreatment the most problematic process
step. However, the kinetics of cellulose degradation is still not fully understood because of different
competing effects that can hardly be distinguished from each other and that introduce large bias and
6 Chapter 1
variability in the estimation of kinetic parameters. A critical analysis of models reported in literature
helped in defining a suitable model structure which was at the same time capable of taking into
account the main phenomena occurring in the hydrolysis step and the main factors affecting the
process and which could be identified and validated through experimental data. A trade off between
simplicity of the resulting model and the amount of embedded process information was thus
required. The focus was put on enzymes adsorption and hydrolysis of pretreated materials and their
correlation to the morphological effects caused by the pretreatment.
An experimental investigation was carried out in order to collect data needed to validate the
mathematical model. All the information was than organize in an aggregated understanding,
incorporating fundamentals lignocellulosic substrates morphological parameters into the traditional
mathematical patterns recorded in literature.
1.2 Introduction
Worldwide energy consumption has increased 17 fold in the last century and emissions of CO2,
SO2 and NOx from fossil-fuel combustion are primary causes of atmospheric pollution (Ture et al.,
1997). Known oil reserves are estimated to be depleted in less than 50 years at the present rate of
consumption (Sheehan et al., 1998). Energy for the transport sector represents a particularly critical
area as it accounts for more than 30% of total energy demand in developed countries. Furthermore,
it is 98% dependent on fossil fuel and is considered one of the main responsible for CO2 increase in
developed countries (IEA, Campbell, 2007).
Biomass has been recognized as a major world renewable energy source to supplement declining
fossil fuel resources (Ozcimen and Karaosmanoglu, 2004; Jefferson, 2006). Biomass is seen as an
interesting energy source for several reasons. One of the main reason is that bioenergy can
contribute to sustainable development (Van den Broek, 2000; Monique et al., 2003): resources are
often locally available, and conversion into secondary energy carriers is feasible without high
capital investments. Moreover, biomass energy can play an important role in reducing greenhouse
gas emissions; since CO2 that arises from biomass wastes would originally have been absorbed
from the air, the use of biomass for energy offsets fossil fuel greenhouse gas emissions (Lynd,
1996). Furthermore, since energy plantations may also create new employment opportunities in
rural areas, it also contributes to the social aspect of sustainability. In addition, application of agro-
industrial residues in bioprocesses not only provides alternative substrates but also helps solving
their disposal problem. With the advent of biotechnological innovations, mainly in the area of
enzyme and fermentation technology, many new avenues have opened for their utilization. Many
research programs have been recently focusing on the development of concepts such as renewable
resources, sustainable development, green energy, eco-friendly process, etc. in the transportation
sector. In developed countries there is a growing trend towards employing modern technologies and
efficient bioenergy conversion, which are becoming cost competitive with fossil fuels (Demirbas,
2000). The term biofuel is referred to liquid or gaseous fuels for the transport sector that are
predominantly produced from biomass. Biofuels are generally considered as offering many
Thesis overview and literature survey 7
advantages over traditional oil-based fuels, including sustainability, reduction of greenhouse gas
emissions, regional development, social structure and agriculture, security of supply (Reijnders,
2006).
Some governments have been announcing commitments to biofuel programs as a way to both
reduce greenhouse gas emissions and dependence on oil-based fuels. The United States, Brazil, and
several EU member states have the largest programs promoting bio-fuels in the world. The recent
commitment by the United States government to increase the bioenergy quote threefold in ten years
has added impetus to the search for viable bio-fuels (Demirbas, 2006; Demirbas et al., 2006; Chen
et al., 2008). In South America, Brazil continued policies mandating at least 22% bioethanol on
motor fuels and encouraged the use of vehicles that use hydrous bioethanol to replace gasoline
(Stevens et al., 2004) The European Commission has indicated that biomass will play an important
role in the future(Erikcsson and Nilsson, 2004).
The European Commission White Paper (White paper, 2001) calls for dependence on oil in the
transport sector to be reduced by using alternative fuels such as bio-fuels. The EU bio-fuels
directive (2003/30/EC) set a target of an indicative 5.75% total bio-fuel share of all consumed
gasoline and diesel fuel for transport placed on the market by 2010. France established an ambitious
bio-fuels plan, with goals of 7% by 2010, and 10% by 2015. Belgium set a 5.75% target for 2010.
The European Commission’s Green Paper on “A European Strategy for Sustainable, Competitive
and Secure Energy” (March 2006) and its 2007 strategic energy review, “An Energy Policy for
Europe” (January 2007) have both emphasized the need to take effective actions to address climate
change (including actions to mitigate greenhouse gas emissions), promote jobs and growth and
enhance security of energy supply in the internal market. On 23 January 2008, the European
Commission (Proposal for a Directive, 2008) proposed a binding minimum target of 10% for the
share of bio-fuels in transport in the context of the “EU directive on the promotion of the use of
energy from renewable sources” that envisages a 20% share of all renewable energy sources in total
energy consumption by 2020. Without the present set of subsidies, tax reductions and exemptions
as well as mandatory incorporation rates, the EU production would certainly be much more limited
(Jacquet et al., 2007). Fuel tax reductions are the most widely used of all the support measures for
bio-fuels (Kojima et al., 2007). In 2003, the EU’s framework for the taxation of energy products
and electricity was amended to allow Member States to grant tax reductions and/or exemptions in
favour of renewable fuels. However, to minimize the tax revenue loss for EU member states, the
final tax on bio-fuels intended for transport use may not be less than 50% of the normal excise duty
(Schnepf, 2006). Tax reductions for bioethanol in EU countries have been as high as US$0.84 per
litre (Kojima et al., 2007).
1.3 Bioethanol as a transportation fuel
Bioethanol and bioethanol/gasoline blends have a long history as alternative transportation fuels. It
has been used in Germany and France as early as 1894 by the then incipient industry of internal
combustion engines (Demirbas, 2007). Brazil has utilized bioethanol as a transportation fuel since
8 Chapter 1
1925. The use of bioethanol for fuel was widespread in Europe and the United States until the early
1900s. Because it became more expensive to produce than oil-based fuel, especially after World
War II, bioethanol potential was largely ignored until the oil crisis of the 1970s (Balat, 2009). Since
the 1980s, there has been an increased interest in the use of bioethanol as an alternative
transportation fuel. Countries including Brazil and the United States have long promoted domestic
bioethanol production. In addition to the energy rationale, bioethanol/gasoline blends in the United
States were promoted as an environmentally driven practice, initially as an octane enhancer to
replace lead. Bioethanol also has value as oxygenate in clean-burning gasoline to reduce vehicle
exhaust emissions (Demirbas, 2005).
Bioethanol has a higher octane number (108), broader flammability limits, higher flame speeds and
higher heats of vaporization. These properties allow for a higher compression ratio and shorter
burning time, which lead to theoretical efficiency advantages over gasoline in an IC engine (Balat,
2007). Octane number is a measure of the gasoline quality for prevention of early ignition, which
leads to cylinder knocking. The fuels with higher octane numbers are preferred in spark-ignition
internal combustion engines. An oxygenate fuel (35% oxygen) such as bioethanol provides a
reasonable antiknock value, reduces particulate and nitrogen oxides (NOx) emissions, as well as
exhaust emissions normally attributed to imperfect combustion in motor vehicles, such as CO and
unburned hydrocarbons (Malça and Freire, 2006).
Disadvantages of bioethanol include low energy density (bioethanol has less 66% of the energy per
unit of mass than gasoline), corrosiveness, low flame luminosity, low vapour pressure (making cold
starts difficult), miscibility with water, toxicity to ecosystems (MacLean and Lave, 2003), increase
in exhaust emissions of acetaldehyde, and increase in steam emissions when blending with gasoline.
Some properties of alcohol fuels are shown in Table 1.1.
Table 1.1 Some properties of alcohol fuels.
Fuel property Isooctane Methanol Ethanol
Octane number 100 112 108
Auto-ignition temperature (K) 530 737 606
Latent heat of vaporization (MJ/Kg) 0.26 1.18 0.91
Lower heating value (MJ/Kg) 44.4 19.9 26.7
Bioethanol can be directly used as a transportation fuel or it can be blended with gasoline.
Bioethanol is most commonly blended with gasoline in concentrations of 10% bioethanol, known as
E10. In Brazil, bioethanol fuel is used pure or blended with gasoline in a mixture called gasohol
(24% bioethanol and 76% gasoline) (Oliveira et al., 2005). Bioethanol can be used as a 5% blend
with gasoline under the EU quality standard EN 228. This blend requires no engine modification.
With engine modification, bioethanol can be used at higher levels, for example, in E85 (85%
bioethanol) (Difiglio, 1997).
Thesis overview and literature survey 9
1.4 Bioethanol trends and projections
Global production of bioethanol has increased from 17.25 billion litres in 2000 (Balat, 2007) to over
65 billion litres in 2008 (www.biofuels-platform.ch), making bioethanol the most produced
biofuel worldwide. This figure is mainly due to the United States (52%) and Brazil (37%)
contribution. Considering all the new government programs in America, Asia, and Europe in place,
total global fuel bioethanol demand could grow to exceed 125 billion litres by 2020 (Demirbas,
2007). More recently, Asia (especially China, Thailand and India) has also embarked on large scale
fuel-ethanol production and that represents one of the largest production potential in the coming
years. With a production of 2.82 billion litres in 2008, the EU ranks third behind the two majors
productors. Figure 1.1 shows different European Countries ethanol production in 2008. The
bioethanol sectors in many EU member states have been enhanced by policy initiatives and have
started growing rapidly. In 2008 the production of fuel-bioethanol increased of 56% compared to
2007. The potential demand for bioethanol as a transportation fuel in the EU countries, calculated
on the basis of Directive 2003/30/EC, is estimated at about 12.6 billion litres in 2010 (Zarzyycki
and Polka, 2007).
Figure 1.1 Production of fuel-bioethanol in the EU-27 and Switzerland in 2008 (Ml).
Table 1.2 shows the evolution of bioethanol production over the past 7 years in the 10 main
producing countries in the EU.
10 Chapter 1
Table 1.2 Evolution of fuel-bioethanol production in the EU (2002-2008).
Country Annual production (Ml/yr)
2002 2003 2004 2005 2006 2007 2008
FR France 114 103 101 144 293 539 950
DE Germany 0 0 25 165 431 394 581
ES Spain 222 201 254 303 402 348 346
PL Poland 83 76 48 64 120 155 200
HU Hungary 0 0 0 35 34 30 150
SK Slovakia 0 0 0 0 0 30 94
AT Austria 0 0 0 0 0 15 89
SE Sweden 63 65 71 153 140 120 78
CZ Czech Republic 6 0 0 0 15 33 76
UK United Kingdom 0 0 0 0 0 20 75
- Others -0 0 29 49 173 119 216
EU-27 EU 27 488 446 528 913 1608 1803 2855
As already mentioned, total EU production in 2008 was an estimated 2.8 billion litres, up to 1.8
billion litres in 2007,i.e. a significant increase of 56%, i.e. an average increase of +30% per annum
over the period 1992-2008, as reported in Figure 1.2.
1992 1994 1996 1998 2000 2002 2004 2006 20080
1000
2000
3000
Bio
eth
anol
Pro
duc
tion
[ML/
y]
Year
Figure 1.2 Evolution of bioethanol production in the EU-27 (Adapted from www.biofuels-platform.ch).
Thesis overview and literature survey 11
1.5 Biomass sources for bioethanol
Bioethanol feedstock can be divided into three major groups: (1) sucrose-containing feedstock (e.g.
sugar cane, sugar beet, sweet sorghum and fruits), (2) starchy materials (e.g. corn, wheat, rice,
potatoes, cassava, sweet potatoes and barley), and (3) lignocellulosic biomass (e.g. wood, straw,
and grasses). In the short-term, the production of bioethanol is almost entirely dependent on starch
and sugars from existing food crops (Smith, 2008). The drawback in producing bioethanol from
sugar or starch is that the feedstock tends to be expensive and demanded by other applications as
well and many concerns about major environmental problems, including food shortages and serious
destruction of vital soil resources are arisen (Pimental, 2008). Lignocellulosic biomass is envisaged
to provide a significant portion of the raw materials for bioethanol production in the medium and
long-term due to its low cost and high availability.
The cost levels and comparison of bioethanol yield produced from different energy crops is
presented in Table 1.3 (Feasibility study of the Dutch Sustainable Development Group, 2005;
Wang, 2002).
Table 1.3 Comparison of production cost and bioethanol yield from different energy crops.
Type Annual yield (ton/ha)
Conversion rate to sugar or starch (%)
Conversion rate to ethanol (l/ton)
Annual ethanol yield (kg/ha)
Cost (US$/m3)
Sugar cane 70 12.5 70 4900 160
Cassava 40 25 150 6000 700
Sweet sorghum
35 14 80 2800 200–300
Corn 5 69 410 2050 250–420
Wheat 4 66 390 1560 380–480
(Adapted from Feasibility study of the Dutch Sustainable Development Group (2005)).
About 60% of global bioethanol production comes from sugar cane and 40% from other crops
(Dufey, 2006) and (Knauf et al., 2005) before 2003. Brazil utilizes sugar cane for bioethanol
production while the United States and Europe mainly use starch from corn, and from wheat and
barley, respectively (Linde et al., 2008). During the period 2006–2007, 6.45 million hectares of
sugar cane crops were cultivated and around three million hectares were dedicated to bioethanol
production, which represents more than 5% of Brazil’s arable land (Trostle, 2008). In 2007,
approximately 11.4 million hectares were used to provide bioethanol feedstock in the five major
producing countries. This would account for about 2.2% of arable land in these countries.
In European countries, beet molasses is the most utilized sucrose-containing feedstock (Cardona
and Sanchez, 2007). Sugar beet crops are grown in most of the EU-25 countries, and yield
substantially more bioethanol per hectare than wheat (EUBIA, 2007). Starch is a high yield
feedstock for bioethanol production (Sanchez and Cardona, 2008) and it is the most utilized
12 Chapter 1
feedstock for bioethanol production in North America and Europe. Corn and wheat are mainly
employed with these purposes (Cardona and Sanchez, 2007). Biomass, such as agricultural residues
(corn stover and wheat straw), wood and energy crops, is attractive materials for bioethanol fuel
production since it is the most abundant reproducible resources on earth. Total potential bioethanol
production from crop residues and wasted crops is 491 billion litres per year, about 16 times higher
than the current world bioethanol production (Kim and Dale, 2004).
1.6 First generation bioethanol
Current bioethanol, is generally derived from food crops such as sugarcane, sugar beet, maize
(corn), sorghum and wheat. (van der Laaka et al., 2007). The vast majority of first-generation
biofuel feedstock, especially in the case of bioethanol, constitute comestible materials, which has
led to concerns about the fact that biomass previously destined for human consumption may be
diverted to fuel production (van der Laaka et al., 2007), thus making food prices increase and also
creating competition for water resources in some regions.
The most significant concern, however, relates to the inefficiency of first-generation biofuels. First-
generation processes for bioethanol production, in the case of corn and wheat, rely on starch from
the kernels of the plant or, in the case of sugar cane and sugar beet, on the sucrose produced
(McCormick-Brennan et al., 2007). The remainder has no practical usage for fuel production. Thus,
a large amount of energy is used for cultivating, harvesting and processing the biomass, even
though only a relatively small proportion is used to derive energy (van der Laaka et al., 2007). The
result is an arguably high level of inefficiency and a poor allocation of energy resources throughout.
Problematic, too, is that fossil fuels are generally required in the production of biofuels
(McCormick-Brennan, 2007) and only limited GHG reduction benefits are provided (with the
exception of sugar cane). Biotechnology research, in the future, may alleviate the problems
identified here. For example, biofuel yields from corn starch in the United States have increased
almost two-fold owing to biotechnological developments and genetic manipulation (McLaren,
2005). Still, it remains to be seen whether these improvements will be more than incremental.
The two main process designs for ethanol production from starch are called wet mill and dry mill.
Approximately one third of the starch-to-ethanol plants employ the wet-mill process, and the
remaining the dry-mill process. The process schemes for the two configurations are presented in
Figure 1.3.
Thesis overview and literature survey 13
Milling
Cooking
Liquefaction
DistillationDehydration
Simultaneous Saccharification
Fermentation
Yeast recycling
Evaporation Drying
Centrifugation
Steeping
Filtration Washing
Grinding
Milling
Germ Separation
Starch
Separation
Liquefaction
Saccharification
Fermentation
Yeast recycling
Distillation Dehydration
CO2
ETHANOL
SYRUPDRY DISTILLER’S
GRAINS
THIN STILLAGE
HEAVY STEEPWATER
GERM
FIBER
GLUTEN
DRY MILLINGWET MILLING
CORN
Figure 1.3 First-generation bioethanol production process.(Adapted from USDOE, 2007).
14 Chapter 1
In the wet-mill process several products (animal feed, oil and ethanol) are obtained from grain.
Separation is achieved by first steeping the corn at an elevated temperature, 49-53°C. The steeping
liquor contains SO2 and the sugars released during steeping are fermented to lactic acid. The
steeping liquor softens the hulls of the grain so that the germs, fibres, gluten and starch can be
separated in subsequent process steps. The germ can be further processed to give oil, and the gluten
is used as animal feed. The starch, which is the main component, is used for ethanol production.
In the dry-mill process, the constituents of the grain are no separated. Instead the whole grain is
milled and sieved to flour to increase the penetration depth of the water and increase the surface
area accessible to the enzyme in the subsequent process step. Ethanol is the main product and the
rest of the material is obtained as DDGS.
The process design for the conversion of starch to ethanol is similar for the wet-mill and the dry-
mill processes. The starch or the milled grain is cooked at approximately 90-120°C and liquefied
with α-amylases, which hydrolyse α-1,4 glucosidic linkages. However, α-amylases cannot
hydrolyse α-1,6 glucosidic linkages, which are more abundant in amylopectin than in amylase, and
a subsequent saccharification step is necessary. In the saccharification step, usually performed at
60-65°C, the glycoamylase enzymes release monomeric glucose. The monomeric sugars obtained
are then fermented. The saccharification step can be performed simultaneously with fermentation,
which reduces the process time, minimises the risk of infection and eliminates end-product
inhibition of the enzymes (Jaques et al., 2003; Elander and Putsche, 1996).
1.7 Second generation ethanol
Second-generation biofuels are derived from feedstocks not traditionally used for human
consumption. As a result, there is much less concern about the use of these fuels leading to
exploitation of food resources. The benefits of using these second-generation biofuels are manifold.
Aside from reducing the threat of food supplies being diverted to fuel production, second-
generation biofuels be more environmentally friendly and produce less greenhouse gases (GHGs)
than first-generation biofuels (Deurwaarder, 2005). Of all the attributes of cellulosic ethanol, its
potential to provide very large greenhouse benefits is perhaps the least controversial. The
fundamental reasons for this potential are a) the photosynthetic production of biomass removes
from the atmosphere the same amount of CO2 that is returned upon combustion of ethanol and
process residues. b) the fossil fuel inputs required for production of cellulosic energy crops are
modest (e.g. relative to conventional row crops). c) the energy content of lignin-rich process
residues is sufficient to provide all process energy requirements, thereby obviating the need for
direct fossil fuels inputs (Lynd, 1996). In addition, the choice of feedstock is wide. (Detchon, 2005).
Very valuable and interesting reviews have been published on the theme of fuel ethanol production
especially from lignocellulosic biomass (Chandrakant and Bisaria, 1998; Lee, 1997; Lin and
Tanaka, 2006; Lynd, 1996; Wyman, 1994; Naik et al., 2009, Brown, 2007).
Thesis overview and literature survey 15
According to these studies the production of biofuels from lignocellulosic substrates can be
achieved through different processing routes. They are:
• Biochemical route: enzymes and other microorganisms are used to convert cellulose and
hemicellulose components of the feedstocks to sugar prior to their fermentation to produce
ethanol. Lignin is removed and used as fuel for heat and power generation (Foyle et al.,
2006; von Blottnitz and Curran, 2007). We will refer to this process as the enzymatic
hydrolysis and fermentation process or EHF process.
• Hybrid thermochemical-biological process: pyrolysis/gasification technologies produce a
synthesis gas (CO+H2) which can be converted in bioethanol through microbial
fermentation (Brown, 2007). This process will be referred to as the gasification and
fermentation process or GF process
A third technological options is the indirect gasification and mixed alcohol synthesis: gasification
technologies produce a synthesis gas (CO+H2) from which a wide range of long carbon chain
biofuels, can be reformed through a catalytic stage (Phillips et al., 2007; Badger, 2002; Naik et al.,
2009).
The process steps resemble those for making FT liquids. Clean syngas is passed over a catalyst,
forming a mixture of alcohol molecules. A number of different catalysts for mixed alcohol
production from syngas were patented in the late 1970s and early 1980s (Nexant Inc., 2005), but
most development efforts were abandoned after oil prices fell in the mid-1980s. High oil prices
have reignited interest, and the United States Department of Energy recently awarded a substantial
grant in support of one commercial-scale demonstration project (17). Several startup companies are
developing competing technologies (Nexant Inc., 2005; Aden et al., 2005; www.rangefuels.com,
www.powerenergy.com, www.novafuels.com, www.syntecbiofuel.com).
National Renewable Energy Laboratory in April 2007 delivered a report reporting process design
and technoeconomic evaluation of the conversion of biomass to ethanol via these thermochemical
pathways that are expected to be demonstrated at the pilot-unit level by 2012. Indirect steam
gasification was chosen as the technology around which this process was developed based upon
previous technoeconomic studies for the production of methanol and hydrogen from biomass.
This conversion route was however disregarded in this thesis since, aside from patents and patent
applications, relatively little published information is available concerning these private-sector
activities.
1.7.1 Lignocelluloses biomass composition
1.7.1.1 Cellulose
As it is the major component in the cell wall of living plant cells, cellulose is by far the most
abundant macromolecule on earth (Brown, 2004).Cellulose is a homopolyssaccharide consisting of
anhydrous glucose units connected with β-1,4 bonds. The length of the linear cellulose chain varies
between 2000 and 20000 linked glucose, depending on the different sources, with the disaccharide
16 Chapter 1
cellobiose as the basic repeating unit (Figure 1.4). Cellulose chain are completely linear and have a
strong tendency to form intra e inter molecular hydrogen bonds. In fact cellulose chain with a
degree of polymerization (DP) over 6-8 are insoluble in water. Bundles of cellulose chains are
aggregated together in the form of microfibrils. It is hydrogen bonds in cellulose that make it rigid
and difficult to degrade (Zhang and Lynd, 2004; Fengel and Wegener, 1989). Microfibrils have
highly ordered (or crystalline) regions altered with less ordered (or amorphous) regions.
Figure 1.4 Cellulose structure.
1.7.1.2 Hemicellulose
The generic term hemicellulose comprises a group of highly branched heterogeneous
polysaccharides, present in lignocellulosic materials, with degree of polymerization of 200 (Saha,
2003), i.e. much lower than cellulose (Figure 1.5). Hemicellulose is more hydrophilic and is also
easier to degrade by acids into the monomeric components than cellulose. This is used in several
pre-treatments methods to increase the accessible surface area of the substrate and make it available
to enzymatic attack. Hemicellulose links covalently to lignin and through hydrogen bonds to
cellulose. It contains a diversity of monosaccharide units, such as the hexoses glucose, galactose
and mannose, and the pentoses xylose and arabinose. The composition differs depending on the
origin. Especially in hardwood, the majority (60-70%) of xylose units are acetylated, i.e. some of
the OH groups at C2 and C3 of the xylose units are replaced by O-acetyl groups (Shimizu, 1991;
Fengel and Wegener, 1989). These are released as acetic acid when the material is hydrolysed.
Thesis overview and literature survey 17
Figure 1.5 Hemicellulose structure.
1.7.1.3 Lignin
Lignin is a highly complex, three-dimensional polyphenolic compound, which is closely attached to
cellulose and hemicellulose. Together with cellulose it gives the plants their remarkable strength.
Research aimed to fully understand the structure of lignin has been under way for a long time but
has proven to be difficult. The chemical structure of lignin, based on many complex carbon-carbon
linkages, makes it very resistant to enzymatic or chemical degradation, and it is thought to play an
important role in a plant defence against biological attack (Fan et al., 1982; Fengel and Wegener,
1989; Lee, 1997). The most common functional groups in lignin are methoxyl, aliphatic hydroxyl,
phenolic hydroxyl and carbonyl groups (Figure1.6). Fraction of lignin can be extracted by both
alkali (e.g. sodium hydroxide) and organic solvents (e.g. dioxane) but also partly (hardwood lignin)
in acid. The solubility of lignin by solvents is also used in pretreatment methods for the EHF
process. An example of this is in the ammonia fiber explosion method. Successful pretreatments
often redistribute the major wood components into separate particles and by that action increase the
accessible cellulose surface and decrease the surface of lignin.
Figure 1.6 The three precursors of lignin. From left to right: p-coumaryl alcohol, coniferyl
alcohol and sinapyl alcohol.
18 Chapter 1
1.7.1.4 The composition of feedstock
Typical carbohydrate and lignin contents of some lignocellulosic materials are reported in Table
1.4. The values should be considered representative, but can differ quite significantly for each
material due to environmental (region, weather, soil type) and genetic variability. The materials are
categorised as softwood, hardwood or agricultural residues, not only due to their visual appearance
but, more importantly, due to the general composition differences between these groups. Softwood
generally has higher lignin content. The composition and the distribution of lignin within the wood
cells differ compared to the other groups. So does the association of cellulose and hemicellulose to
the lignin. As a consequence of these differences, softwood is more recalcitrant to degradation and
more resistant to enzymatic hydrolysis (Grethlein et al., 1984 and Ramos et al., 1992). In all
materials the most common carbohydrate is glucan, which makes up the cellulose and may also be
present in hemicellulose. The hemicellulose in softwood is reach in mannan, whereas xylan
dominates the hemicellulosic fraction of hardwood and agricultural residues.
Table 1.4 Typical carbohydrate and lignin contents of some lignocellulosic materials.
Glucan Galactan Mannan Xylan Arabinan Lignin Ref
Softwood
Spruce
Radiata pine
46.5
42.8
1.7
2.5
13.5
11.3
8.3
5.9
1.2
1.6
27.9
27.2
Söderström et al, 2002
Wiselogel et al., 1996
Hardwood
Beech
Yellow poplar
Salix
42.9
49.9
43.0
n.r
1.2
2.0
0.9
4.7
3.2
20.8
17.4
14.9
1.5
1.8
1.2
26.2
18.1
26.6
Wiselogel et al., 1996
Vinzant et al., 1994
Sassner, et al., 2007
Agricultural residues
Sugar cane bagasse
Corn stover
Barley straw
40.2
36.8
37.1
1.4
2.9
-
0.5
-
n.r.
22.5
22.2
21.4
2.0
5.5
3.1
25.2
23.1
19.5
Neureiter et al., 2002
Öhgren et al., 2005
Linde et al., 2006
1.8 Enzymatic hydrolysis and fermentation process
The first process is possibly the most mature process for the transformation of lignocellulosic
materials into ethanol. It includes five main steps: biomass pretreatment, cellulose hydrolysis,
fermentation of hexoses, separation and effluent treatment (Figure 1.7). Furthermore, detoxification
and fermentation of pentoses released during the pretreatment step can be carried out. The key
process steps will be discussed hereafter, following the here presented order. This process has been
extensively described and studied (e.g., Wooley et al., 1999a and 1999b, Lynd et al., 1996, Hahn-
Hägerdal et al., 2006), and pilot plants and pre-industrial facilities have recently being brought to
operation. In the literature, several flowsheeting designs have been reported: for instance, Wooley
Thesis overview and literature survey 19
et al. (1999a and 1999b) describe the global process for ethanol production from wood chips and
Cardona and Sanchez (2006) use a process simulator to assess the energy consumption for several
process configurations; other works have analysed the techno-economic performance of the
production process (Lynd et al., 1996; McAloon et al., 2000, Hamelinck et al., 2005).
PRETREATMENT RECOVERY
HEAT & POWER GENERATION
HYDROLYSIS FERMENTATIONETHANOL
WATERBIOMASS
Figure 1.7 The enzymatic hydrolysis and fermentation (EHF) process for bioethanol production.
1.8.1 Pretreatment
Effective pretreatment should disrupt the shielding action of lignin and the hemicellulose on the
cellulose to increase accessibility of the enzymes. Pretreatment should provide a high concentration
and recovery of cellulose and hemicellulose sugars at low cost. The production of degradation
product must be low and the pretreatment method must result in high recovery of lignin for further
utilization as either chemical feedstock or solid fuel (Nguyen and Saddler, 1991).
Pretreatment can be performed in several different ways, including physical, biological, and
chemical treatment or a combination of these. Over the years a number of thorough reviews of
pretreatment methods have been published (Fan et al., 1982; Sun and Cheng, 2002; Duff and
Murray, 1996; Mosier et al., 2005). An optional mechanical pretreatment of comminution,
including dry, wet, and vibratory ball milling (Millett et al., 1979; Rivers and Emert, 1987), and
compression milling (Tassinari et al., 1982) is sometimes needed to make material handling easier
through subsequent processing steps. Physical pre-treatment methods use steam explosion or liquid
hot water (LHW). Steam explosion is one of the most promising methods to make biomass more
accessible to cellulase attack (Szengyel, 2000). The material is heated using high-pressure steam
(20–50 bar, 210–290 1C) for few minutes; these reactions are then stopped by sudden
decompression to atmospheric pressure.
The LHW process uses compressed, hot liquid water (at pressure above saturation point) to
hydrolyse the hemicellulose. Development of the LHW process is still in laboratory stage.
20 Chapter 1
Common chemical pre-treatment methods use dilute acid (Wooley et al., 1999a and 1999b, and Sun
and Cheng, 2002), alkaline (US DOE. Advanced bioethanol technology), ammonia (Dale, 1986),
organic solvent (Botello et al., 1999). Biological pre-treatments use fungi to solubilise the lignin
(Graf and Koehler, 2000). Biological pretreatments have the advantages of low energy use and mild
environmental conditions; however, the very low hydrolysis rate presently impedes the
implementation (Sun and Cheng, 2002).
Several pre-treatment processes combine physical and chemical elements: acid catalyzed steam
explosion (see § 1.9.1.1), ammonia fibres explosion (AFEX), CO2 explosion (Sun and Cheng,
2002).
1.8.1.1 Steam explosion acid catalyzed
Steaming of wood and other kind of cellulose-containing materials has been thoroughly examined
throughout the years. Some of the major reasons for this are its relative cheapness, its harmlessness
to humans and the possibility of avoiding chemicals. The idea of using steam pretreatment prior to
enzymatic hydrolysis stems from the early investigations of Mason in 1927 (Mason, 1927). He
found that heating wood chips to high temperature, by means of saturated steam and sudden release
of pressure in the vessel, resulted in a brownish fibre mix, which resulted very sensitive to enzymes
(Jusarek ,1979; Mac Donald and Mathews, 1979). Michalowicz et al. (1991) showed that the
accessibility of enzymes increased from 30% for the untreated material up to more than 70% when
the material is soaked in H2SO4 and then steam treated. Impregnation of aspen chips with SO2 and
H2SO4 before steam treatment was investigated by Mackie (1985). Both acid catalysts improved the
recovery of pentose sugars substantially compared with non-acid-treated substrate. They considered
210°C to be the optimal temperature, since a 90% recovery of pentosans is possible in the
subsequent washing.
These conditions also solubilise some of the lignin in the feedstock and “expose” the cellulose for
subsequent enzymatic hydrolysis. A small portion of the cellulose is converted to glucose. In
addition, acetic acid is liberated from the hemicellulose hydrolysis. Degradation products of pentose
sugars, primarily furfural, and hexose sugars, primarily hydroxymethyl furfural (HMF), are also
formed.
Acid catalysed steam explosion is one of the most cost-effective processes for hardwood and
agricultural residues, but it is less effective for softwoods. Limitations include destruction of a
portion of the xylan fraction, incomplete disruption of the biomass structure, and generation of
compounds that may inhibit microorganisms used in downstream processes. (Hamelinck et al.,
2005).
1.8.2 Enzymatic hydrolysis
A large variety of microorganisms naturally produce enzymes that degrade lignocellulosic materials
in order to provide substrate for their own survival. Cellulose- and hemicellulose-degrading
enzymes are often grouped into cellulases and hemicellulases, respectively. The material after
Thesis overview and literature survey 21
pretreatment is hydrolyzed with a cocktail of enzymes to further degrade the cellulose and
hemicellulose to obtain the desired monomeric glucose. The most commonly used and
commercialized enzymes cocktails for lignocellulosic degradation are obtained from the fungus
Trichoderma reesei. Cellulose is degraded by three classes of enzymes: cellobiohydrolases,
endoglucanases and β-glucosidases. Figure 1.8 illustrates how enzymes hydrolyze cellulose.
Endoglucanases cut the cellulose chain, preferably at the amorphous regions, while
cellobiohydrolase attack the end of the cellulose chain.
Soluble phase
Endoglucanase Cellobiohydrolase Β-glucosidase
Heterogeneous phase
Soluble phase
Figure 1.8 Enzymatic hydrolysis mechanism.
Cellobiohydrolases and endoglucanases together depolymerise cellulose to cellobiose. The
cellobiose is then hydrolyzed to monomeric glucose units by β-glucosidases.
Different microorganisms secrete various ratios of specific enzymes. Trichoderma reesei secretes
mainly endoglucanases and cellobiohydrolases but is deficient in β-glucosidase, which should be
supplemented to avoid the accumulation of cellobiose, causing end-product inhibition. β-
glucosidase could be produced by the microorganism Aspergillus niger.
The rate of hydrolysis by a specific enzyme cocktail differs depending on the substrate. In
lignocellulosic materials the cellulose is highly crystalline and surrounded by hemicellulose and
22 Chapter 1
lignin, thus making it recalcitrant to the enzymatic attack. One goal of the pretreatment step is to
enhance the rate of hydrolysis by increasing the accessibility of the enzyme. Initially, enzymatic
hydrolysis is fast, but the rate slows down as the amorphous areas of cellulose decrease and the
number of free chain-ends decreases. Additionally, the rate of hydrolysis is affected by the thermal
and mechanical deactivation of the enzymes (Zhang and Lynd, 2004, Gregg and Saddler, 1996).
To improve the yield and rate of the enzymatic hydrolysis, research focuses both on enhancing
enzyme activity in distinctive hydrolysis and fermentation process steps (Sun and Cheng, 2002), as
well as combining the different steps in fewer reactors (discussed in § 1.9.4).
Nowadays enzymes are expensive and constitute a significant contribution to the overall cost of
ethanol production (Sassner et al., 2007).
1.8.3 Fermentation
A variety of microorganisms, generally either bacteria, yeast, or fungi, ferment carbohydrates to
ethanol under oxygen-free conditions. According to the reactions, the theoretical maximum yield is
0.51 kg ethanol and 0.49 kg carbon dioxide per kg sugar:
5 10 5 2 5 23 5 5 C H O C H OH CO⎯⎯→ +←⎯⎯ (1.1)
6 12 6 2 5 22 2 C H O C H OH CO⎯⎯→ +←⎯⎯ (1.2)
All microorganisms have limitations: for example they process both pentoses and hexoses, or they
co-produce of cell mass at the cost of ethanol yield. Furthermore, the oxygen free condition of
fermentation slowly exterminates the microorganism population (Lynd, 1996). Therefore, in the
early processes, the different sugars were fermented in different sequential reactors. There is a
tendency towards combining reaction steps in fewer reactors in order to avoid hydrolysis
intermediate inhibitive products, to reach higher yields. Genetic engineering and new screening
technologies are devoting a great effort to bring bacteria and yeast capable of fermenting both
glucose and xylose (US DOE), with improved efficiency (higher fermentation rates) and resistance
to high temperatures, and requiring a less intense detoxification of the hydrolysate(Wooley et al,
1999b and Graf and Koehler, 2000).
1.8.4 Integration options
Enzymatic hydrolysis performed separately from the fermentation step is known as separate
hydrolysis and fermentation (SHF). Cellulose hydrolysis carried out in the presence of the
fermentative microorganism is referred to as simultaneous saccharification and fermentation (SSF).
The key of the SSF of biomass is its ability to rapidly convert the sugars into ethanol as soon as
they are formed thus diminishing their accumulation in the medium. Bearing in mind that the sugars
are much more inhibitory for the conversion process than ethanol, SSF can reach higher rates,
yields and ethanol concentrations with respect to SHF (Wyman et al., 1992). SSF offers an easier
Thesis overview and literature survey 23
operation and a lower equipment requirement than the sequential process since no hydrolysis
reactors are needed; moreover, the presence of ethanol in the broth makes that the reaction mixture
less vulnerable to the action of undesired microorganisms (Wyman, 1994). Nevertheless, SSF has
the inconvenient that the optimal conditions for hydrolysis and fermentation are different, which
implies a difficult control and optimization of process parameters (Claassen et al., 1999); in
addition, larger amounts of exogenous enzymes are required. (Cardona and Sanchez, 2007). The
concept of SSF process was first described by Takagi et al. (1977). Since that time, after the
technology had been patented (Gauss et al., 1976), the duration of the batch process have decreased
from 14 d required for the conversion of 70% of cellulose into ethanol with final concentrations of
20 g/L, to 3–7 d needed for reaching 90–95% conversions with final ethanol concentrations of 40–
50 g/L (Wyman, 1994).
Simultaneous saccharification of both cellulose (to glucose) and hemicellulose (to xylose and
arabinose) and co-fermentation of both glucose and xylose (SSCF) would be carried out by
genetically engineered microbes that ferment xylose and glucose in the same broth as the enzymatic
hydrolysis of cellulose and hemicellulose. Actual SSCF process has been demonstrated in the case
of ethanol production from yellow poplar through a benchscale integrated process that included the
dilute-acid pretreatment of feedstock, conditioning of hydrolyzate for fermentation, and a batch
SSCF (McMillan and Newman, 1999). In this case, the recombinant Z. mobilis assimilating xylose
was used. SSCF is the process on which is based the technology designed as a model process by the
NREL for the production of fuel ethanol from aspen wood chips (Wooley et al., 1999a). In this
design, the utilization of recombinant Z. mobilis exhibiting a glucose conversion to ethanol of 92%
and a xylose conversion to ethanol of 85% is assumed.
1.8.5 Separation and cogeneration
Ethanol is recovered from the fermentation broth by distillation combined with molecular sieve
adsorption (Gulati et al., 1996; Ladisch and Dyck, 1979; Ladisch et al., 1984). The residual lignin,
unreacted cellulose and hemicellulose, ash, enzyme, organisms, and other components end up in the
bottom of the distillation column. Due to the relative high costs of ethanol from biomass and other
feedstocks, different strategies are being developed for making the process more profitable. In the
specific case of lignocellulosic biomass, the thermal conversion of non-fermentable lignin produced
as a by-product can provide the energy required by the entire process remaining a surplus that can
be commercialized in form of electricity. This is possible due to the high energy value of the lignin
(29.54 MJ/kg) that is released during its combustion. To generate electricity and heat, at small scale
(up to30MWe) a boiler with steam turbine has been proposed as a viable options (Hamelinck et al.,
2005)
Reith et al. (Reith et al., 2002) point out that, at larger scale, the use of BIG/CC (Biomass Integrated
Gasification Combined Cycle) technology for the thermal conversion of the non-fermentable
residues can supply all the steam and electricity needed by the biomass-to-ethanol process. In
24 Chapter 1
addition, the electricity surplus can be sold to the grid giving a total system efficiency of 56–68%.
In this case, the cogeneration of steam and electricity is crucial for obtaining a competitive process.
New trends in process engineering of bioethanol are aimed at producing co-products other than
fuels that contribute to balance the economy of the global ethanol production process. In this way,
many materials generated during the process and considered as wastes could become valuable and
marketable co-products. Typical co-products are shown in Table 1.5 (Cardona and Sanchez, 2007).
Table 1.5 Bioethanol production and land use by major producing countries, 2006/07.
Co-product
Stage where co-product is formed Application Remarks References
Xylitol
Xylose solutions obtained during pretreatment of lignocellulosic biomass
can be converted into xylitol by chemical or biotechnological means; co-culture of Saccharomyces cerevisiae and Candida
tropicalis
Anticariogenic sweetener, sugar
substitute for diabetics
US$7/kg xylitol
Converti and Del Borghi (1996), Latif and Rajoka (2001),
Leathers (2003), Saha (2003)
2,3-butanediol
Arabinose and xylose solutions obtained during pretreatment of lignocellulosic biomass especially corn fiber) can be
converted into 2,3-butanediol by bacteria
Chemical feedstock as a precursor of
synthetic polymers and resins
Saha (2003)
CMA
Xylose solutions obtained during pretreatment of lignocellulosic biomass
can be converted into acetic acid by fermentation using Clostridium
thermoaceticum
Road deicer
Stillage could be
used to supply
nutrients for fermentation
process
Bungay and Peterson (1992), Wilkie et al.
(2000)
Furfural
Xylose solutions obtained during pretreatment of lignocellulosic biomass
can be converted into furfural
Valuable chemical
US$1580/ton furfural
Kaylen et al. (2000)
Single cell protein
Xylose solutions obtained during pretreatment of
lignocellulosic biomass can be utilized for growing Candida
utilis
Animal feed
Ghosh and Ghose
(2003)
Unaltered lignin
Delignification of biomass by solvent pretreatment
Fuel additive
US$200/ ton
Ghosh and Ghose (2003)
Pelletized hydrolysis
residue
Dilute acid pretreatment of wood
Fuel pellets for residential appliances
(stoves, burners)
Öhman et al. (2006)
Lignin
Fractionation of pretreated biomass or centrifugation of
stillage
Raw material for production of
adsorptive materials by
chemical modification
Dizhbite et al. (1999)
Thesis overview and literature survey 25
1.8.6 State of the art of commercial ethanol plants
While significant milestones have occurred in the laboratory, cellulosic ethanol has yet to be
produced on a commercial scale.
The transition of lignocellulosic fuel ethanol production into a mature industrial technology requires
further research and development efforts in these areas:
Biotechnology issues
• Improving enzymatic hydrolysis with efficient enzymes, reduce enzymes production cost
and novel technology for high solids handling
• Developing robust fermenting organisms, which are more tolerant to inhibitors and ferment
all sugars in the raw material in concentrated hydrolysates at high productivity and with
high ethanol concentration
Engineering issues
• Design of more effective pre-treatment
• Extending process integration to reduce the number of process steps and the energy demand
and to re-use process streams to eliminate the use of fresh water and to reduce the amount of
waste streams
• Reducing separation costs
• Control and optimisation of process parameters
• Supply chain issues
As a result of these open issues no lignocellulosic bioethanol commercial plant is available
nowadays, even if several near-term commercial facilities projects are being developed in the recent
years (Table 1.6). Nevertheless, as the economic analysis (Aden et al., 2002) of the cellulosic
bioethanol process shows that reliable cost estimations require laboratory results are verified in pilot
and demonstration plant, where all steps are integrated into a continuous process, a number of these
pre-commercial facilities have being spreading throughout the world (Table 1.7). This plant scale
provides the possibility to explore the benefits of process integration to reduce the number of
process steps and the energy demand, and to recirculate process streams to eliminate the use of
fresh water and to reduce the amount of waste streams
Table 1.6 Near-term cellulosic ethanol commercial plants, capacity in m3 year−1.
Company Location Feedstock Capacity Date
Bioethanol Japan Kansai
Sakai, Japan Construction wood residues 1.4–4.0×10³
2007
Abengoa Bioenergy & SunOpta
Babilafuente, Spain
Wheat straw (co-located w/grain ethanol Wheat straw (co-located w/grain ethanol plant)
5.0×10³ 2007
Iogen Shelley, ID Wheat, barley and rice straw 110×103 2008
Xethanol & Spring Hope
Spring Hope, NC
Hardwood chips, wood residues, other 130×103 2007
26 Chapter 1
BioFuels Xethanol & Coastal
Augusta, GA Wood residues, other 190×103 2007
Maui Ethanol Kauai, HI Bagasse 45×103 2007
Dedini Brazil Bagasse 20×103 2007
Colusa Biomass Energy
Colusa, CA Rice straw and hulls, corn stover 38×103 2007
Future Fuels Toms River, NJ Wood residues, other 200×103 2008
Genahol Orrville, OH Municipal garbage 15×103 2008
Pencor-Masada OxyNol
Middletown, NY
Municipal garbage 34×103 2008
Source: (Solomon et al., 2007)
Table 1.7 Cellulosic ethanol pilot and demonstration plants.
Company Location Feedstock Capacity or feed rate Start date
Pilot plants
Iogen Ottawa, Canada Wood chips 9.0×10² kg day−1 1985
Iogen Ottawa, Canada Wheat straw 9.0×10² kg day−1 1993
Masada/TVA Muscle Shoals, AL Wood NA 1993
SunOpta Norval, Canada Various (non-woody) 4.5×10² kg h−1 1995
Arkenol Orange, CA Various 9.0×10² kg day−1 1995
Bioengineering Resources
Fayetteville, AR Softwood & bark NA 1998
NREL/DOE Golden, CO Corn stover, others 9.0×10² kg day−1 2001
Pearson Technologies Aberdeen, MS Wood residues, rice straw 27 Mg day−1 2001
NEDO Izumi, Japan Wood chips 3.0×10² l day−1 2002
Dedini Pirassununga, Brazil Bagasse 1600 m3 year−1 2002
Tsukishima Kikai Co. Ichikawa, Chiba, Japan
Wood residues 9.0×10² kg d−1 2003
Etek EtanolTeknik Ornskoldsvik, Sweden
Spruce sawdust 5.0×10² l day−1 2004
PureVision Ft. Lupton, CO Corn stover, bagasse 9.0×10 kg day−1 2004
Universal Entech Phoenix, AZ Municipal garbage 1.0×10² l day−1 2004
Sicco A/S Odense, Denmark Wheat straw 1.0×10² kg h−1 2005
Abengoa Bioenergy York, NE Corn stover (co-located with grain ethanol plant)
2000 m3 year−1 2006
Iogen Ottawa, Canada Wheat, oat and barley straw 3000 m3 year−1 2004
Thesis overview and literature survey 27
ClearFuels Technology Kauai, HI Bagasse and wood residues 11,400 m3 year−1 2007
Celunol Jennings, LA Bagasse, rice hulls (co-located with grain ethanol plant)
5000 m3 year−1 2007
Etek EtanolTeknik Sweden Softwood residues (spruce and pine)
30,000 m3 year−1 2009
Source: (Solomon et al., 2007)
1.9 The gasification-fermentation process
Thermochemical processing of biomass to produce substrates suitable for fermentation is a
relatively new approach to bioethanol production. A number of microorganisms are able to utilize
the gaseous compounds resulted from biomass gasification as substrates for growth and production.
Among the fermentation products are carboxylic acids, alcohols, esters, and hydrogen.
A block diagram for the gasification-fermentation (GF) process for bioethanol production is
sketched in Figure 1.9.
PRETREATMENT
GAS COOLING FERMENTATION
GASIFICATIONSYNGAS
PURIFICATION
ETHANOLWATER
BIOMASS
PRODUCTS RECOVERY
GAS
Figure 1.9 The thermochemical/biological process for bioethanol production.
This process has been somehow neglected in the scientific literature (at least when compared to the
EHF process), notwithstanding the promising results demonstrated in the few works appeared in the
literature (e.g. Datar et al., 2004; Brown, 2007). The reason for this is easy to understand: the
original feedstock of the fermentation industry were naturally occurring sugars and starches that
28 Chapter 1
easily hydrolyzed to sugar. The fact that both starch and cellulose are both polymers of glucose
encouraged similar approaches to depolymerising these two carbohydrates. In fact, cellulose is not
only more recalcitrant than starch but it is embedded in a matrix of lignin, which makes the process
of releasing sugar from lignocellulose much more difficult than for starch. Considering these
difficulties, hybrid thermochemical/biological approaches to bio-based products deserves increased
attention. Although biomass gasification has long been studied (Bridgwater, 1995), its integration
with the fermentation process has been studied only in few reports (Mississippi Ethanol LCC, 2002;
BRI Energy, 2006). However, the technology potential (which is already available as a commercial
process) has nonetheless been widely recognised (Ragauskas et al, 2006) and recently awarded
through financing by the U.S.A Department of Energy. The syngas route, by transforming all plant
constituents into CO and H2, is attractive for its efficient use of biomass. The process has an
advantage over cellulose hydrolysis since it is able to process a wider variety of substrates. In a
comprehensive review on the prospects for ethanol from cellulosic biomass, Lynd (1996) noted that
syngas fermentation represents and “end run” with respect to acid or enzymatic hydrolysis of
biomass because it avoid the costly and complicated steps of extracting monosaccharide from
lignocellulose. It also has the potential for being more energy efficient because it effectively utilizes
all the constituents of the feedstock, whether cellulose, hemicellulose, lignin, starch, oil or protein.
Syngas fermentation also presents some advantages if compared with the use of inorganic catalyst
in the production of synthetic fuels (Grethlein and Jain, 1993). Most catalysts used in the
petrochemicals industry are readily poisoned by sulphur-bearing gases whereas gas-consuming
anaerobes are sulphur tolerant. In conventional catalytic processing, the CO/H2 ratio of the syngas
is critical to commercial operations whereas biological catalyst are not sensitive to this ratio;
indeed, the water-gas shift reaction is implicit in the metabolism of autotrophic and
unicarbonotrophic anaerobes. Gas phase catalysts typically use temperature of several hundreds of
degree Centigrade and at least 10 atm whereas syngas fermentation proceeds at near ambient
conditions. Finally biological catalysts tend to be more product specific than inorganic catalysts.
Nevertheless, as described by Grethlein and Jain (1993), syngas fermentation has several barriers to
overcome before it can be commercialized. For instance, the rate is low, yield is limited and there
are difficulties in avoiding product inhibition by acids and alcohols, and issues at guaranteeing an
acceptable mass transfer rate from the gas to the liquid phase. A study by Worden and coworkers
(Worden et al., 1997) give encouragement that the use of nontoxic surfactants and novel dispersion
devices can enhance mass transfer through the generation of microbubbles to carry syngas into
bioreactors (see §1.10.2).
Thesis overview and literature survey 29
1.9.1 Gasification
Gasification is the high temperature conversion of solid, carbonaceous fuels into flammable gas
mixtures, sometimes known as synthesis gas or syngas, consisting of CO, H2, CO2, methane,
nitrogen and smaller quantities of higher hydrocarbons. Gasification is best performed with pure
oxygen in order to decrease the size of the equipment via reducing the load of nitrogen. For the
production of ethanol only CO, CO2 and H2 are interesting gases. The other hydrocarbon gases will
not ferment or in the worse case will even inhibit the fermentor bacteria. This fact already limits the
choice of the gasifier operating conditions because the maximum of yield of CO and H2 can be
thermodynamically achieved at high temperature, higher than 1000°C. High temperature gasifying
system are therefore needed. The most important reactions that take place in the reduction zone of
gasifier between different gaseous and solid reactants are given below.
2 12 H 164.9 /C CO CO kJ mol⎯⎯→+ Δ =←⎯⎯ (1.3)
2 2 2 H 122.6 / C H O CO H kJ mol⎯⎯→+ + Δ =←⎯⎯ (1.4)
2 4 32 H 74.8 /C H CH kJ mol⎯⎯→+ Δ = −←⎯⎯ (1.5)
2 4 2 43 H 205.9 /C H CH H O kJ mol⎯⎯→+ + Δ = −←⎯⎯ (1.6)
As reaction 1.3 and 1.4 requires heat, the gas temperature will decrease during reduction. Part of the
feed can be used to heat up the gasifier through combustion.
Reaction 1.5 and 1.6 are unwanted side reactions, which produce components not useful in the rest
of the process. They must be inhibited as much as possible by choosing the right process conditions.
1.9.2 Fermentation
Several acetogenic microbes are capable of metabolizing cleaned syngas into ethanol. Two of the
more promising strains are described below.
Butyribacterium methylotrophicum is a gram-positive, motile, rod-shaped anaerobic bacterium,
which grows on a wide variety of substrates, including glucose, formate and methanol, H2 and CO2,
and CO. The products achieved are acetic acid, butyric acid, ethanol and butanol. Unfortunately, the
yield in butanol, and especially ethanol, is usually low.
The second clan of bacteria belongs to the clostridium species which were isolated from chicken
waste and demonstrated to grow well on syngas to produce acetate and ethanol. The first
optimization of these species resulted in an approximate 1:1 ratio of ethanol and acetate under
optimal conditions. The Clostridium ljungdahlii is a gram-positive, motile, rod-shaped anaerobic
bacterium, which converts CO, H2 and CO2 into a mixture of acetate and ethanol. The ratio of these
products can be adjusted by pH. When the pH is lowered to 4 the ratio ethanol:acetate becomes 3:1.
Further medium adjustments has reportedly nearly insignificant acetate production and led to an
ethanol concentration of 48 g/L (approximately 1mol/L) on day 25 when using an optimised
medium.
30 Chapter 1
Clostridium carboxidovorans is a gram-positive, motile, rod-shaped anaerobic bacterium, which
converts CO, H2 and CO2 into a mixture of acetate, butanol and ethanol. The ratio
ethanol:butanol:acetate is 6:3:1 in absence of hydrogen.
Bacterial fermentation of CO, CO2 and H2 using Clostridium ljungdahlii follows the pathway
reactions:
2 2 5 26 3 4 G=-216kJ/molCO H O C H OH CO⎯⎯→+ + Δ←⎯⎯ (1.7)
2 2 2 5 26 2 3 G=-97kJ/molH CO C H OH H O⎯⎯→+ + Δ←⎯⎯ (1.8)
1.9.2.1 Reactor design issues
Experimental studies have shown that, like aerobic fermentations, the rate-limiting step in
synthesis-gas fermentations is typically the gas-to-liquid mass transfer (Bredwell et al., 1999).
Mass-transfer limitations are expected to be even more severe in synthesis-gas fermentations than in
aerobic fermentations. The solubilities of CO and H2 are only 60% and 4% of that of oxygen,
respectively (on a mass basis). A common approach used to enhance gas-to-liquid mass transfer in
stirred tanks is to increase the agitator power-to-volume ratio. Increasing the power input increases
bubble breakup, thereby increasing the interfacial area available for mass transfer. However, this
approach is not economically feasible for the very large reactors being considered for commercial
synthesis-gas fermentations, due to excessive power costs. Consequently, alternative bioreactor
configurations that may provide more energy-efficient mass transfer, including trickle-bed reactors
and airlift reactors, have been evaluated for synthesis-gas fermentations. Both suspended-cell and
immobilized-cell cultures have been used in these reactors. Microbubble dispersions have been used
to enhance gas mass-transfer rates in synthesis-gas fermentations (Kaster et al., 1990). Summarizing
common reactor-engineering approaches used to increase the productivity of synthesis-gas
fermentations are: increased pressure, higher power-to-volume ratios, different reactor and impeller
configurations, and the use of microbubble sparging.
1.9.3 Recovery and cogeneration
Product is recovered through conventional distillation and optional dehydration is obtained with
molecular sieves. Due to ethanol law concentrations achieved in the fermentation broth (2-3% w/w)
this is the most energy intensive process operation. Multi-columns distillation schemes and direct
injection of steam could be used in order to decrease the energetic cost of this step.
Exhausted gas, exiting fermentation reactors, is useful as a fuel for power and heat generation:
turbogas systems or a combustor-multistage steam turbines systems could meet process energy
requirements and also produce a surplus available on the grid (Magnusson, 2005).
Thesis overview and literature survey 31
1.9.4 Pennsylvania Cellulosic Fuel Ethanol Plant Begins Production
In November 1st 2009 Coskata Inc. has started production of fuel ethanol at its new semi-
commercial plant in Madison, PA (U.S.A). This facility is designed to demonstrate the company’s
new flex-ethanol process—which can manufacture ethanol from virtually any cellulose-based
feedstock, ranging from sustainable energy crops to construction waste, from wood biomass, to
agricultural waste. The process is based on a plasma gasification technology (Westinghouse Plasma
Corporation, WPC), followed by the fermentation step and product recovery stage. Process main
features are briefly described.
Heat, produced by plasma technology, breaks chemical bonds in the feedstock and completely
converts organic matter into synthesis gas (syngas), primarily a mixture of carbon monoxide,
hydrogen, and carbon dioxide. The syngas passes through a scrubber to remove particulates,
providing recoverable energy in the cooling process.
The syngas is sent to a proprietary bioreactor where patented microorganisms consume both carbon
monoxide and hydrogen, simultaneously. As the syngas passes through the bioreactor, the
microorganisms consume it as food and create ethanol. Ethanol and water then exit the bioreactor.
Ethanol is separated from the water using traditional distillation or membrane permeation. Water is
recycled back into the bioreactor. The final product is fuel-grade ethanol.
Coskata’s technology is said to reduce greenhouse gases by as much as 96% over conventional
gasoline, while using less than half the water that it takes to get a gallon of gasoline. The specific
biological fermentation technology used in the process is ethanol-specific and enzyme independent,
contributing to high energy conversion rates and ethanol yields. Coskata says the process requires
no additional chemicals or pre-treatments, which streamlines operational costs and should allow it
to compete directly with conventional gasoline without long-term government subsidies.
1.10 Aims of the work
Current development of ethanol industry shows that complex technical problems affecting the
indicators of global process have not been properly solved. The growing cost of energy, the design
of more intensive and compact processes, and environmental concern, have forced the necessity of
employing totally new approaches for the design and operation of bioethanol production processes,
quite different to those utilized for the operation of the old distilleries and other commodity
chemicals.
Many studies are continuously carried out aimed at reducing the ethanol production costs for a
profitable industrial operation. Research tendencies are related to the different steps of processing,
nature of utilized feedstocks, and tools of process engineering, mainly process synthesis, integration
and optimization. Process systems engineering could provide strategic tools for developing
economically viable and environmentally friendly technologies for the production of fuel ethanol.
The overall goal of this Thesis is to apply multi-scale modelling principles, techniques and tools to
processes for the production of fuel-ethanol from lignocellulosic biomass.
32 Chapter 1
First, a macroscale approach will be used to analyse, optimize and assess the process design of EHF
and GF to select the most promising technological option on the basis of criteria such as production
yields, technical facilities optimization potential, economic profitability indexes, potential of costs
reduction. The methodology will allow identifying processes critical issues and potentials.
Accordingly, the EHF technology us selected as the most mature and effective process alternative in
the near-term.
Successively, one of the most critical EHF processing steps is chosen for a more detailed analysis
aiming at deliver further insight for a more conscious modelling effort. In particular, many
mechanisms underlying lignocellulose pretreatment and hydrolysis, namely the most expensive and
critical process steps, are still unclear. Several phenomena not only are not properly described but
not even fully understood. For instance, the impact of different parameters characterizing the
substrate-enzyme complex affecting the kinetics and the final yields of these steps are barely
known. Thus, a reliable dynamic modelling of pretreatment and hydrolysis would be of great
practical interest and could provide valuable tools to orientate research efforts and optimize single
units and eventually the overall process design and operations. Here, the focus will be on the
enzymatic hydrolysis.
A critical analysis of lignocellulose hydrolysis kinetic models reported in literature was carried out
in order to select a suitable model structure. On the one side the model should be capable of taking
into account the main phenomena taking place. On the other side, it should be “simple” enough to
allow for an experimental assessment and identification.
Among phenomena that are worth being described in detail we decided to focus on the microscale
correlation between substrate morphological features after pretreatment and the extent of enzyme
adsorption and its final rebound on sugars released kinetic.
An experimental investigation was considered essential in order to characterize and better
understand critical phenomena, to obtain experimental data for model validation and parameters
estimation. Methodology, results and motivations of the experimental work performed, in
collaboration with the Chemical Engineering Department of Lund University, will be critically
presented and discussed.
Starting from traditional Langmuir isotherm description of enzyme adsorption a new concept model
was developed embedding specific surface area, determined through experimental measurements,
as critical parameter. The following step was to include the adsorption model in an overall
hydrolysis process kinetic model.
Chapter 2
Techno-economic comparison between conversion technologies
A wide variety of processes for the production of ethanol from cellulosic materials has been
studied and is currently under development. In fact, the large amount of technologies and
processing options advocates for a more diffuse application of process engineering modelling,
design and optimisation in order to help the research effort and guide investors and policy-
makers towards the most effective technologies. In this Chapter1, two of the most promising
processes will be analysed and assessed: the conversion of lignocellulosic biomass by
hydrolysis and subsequent fermentation and the gasification of lignocellulose followed by
syngas fermentation. The Chapter is structured as follows: first literature concerning techno-
economic modelling of lignocellulose ethanol conversion processes is extensively reviewed,
then the EHF process is considered in terms of modelling, process optimisation, heat and
power generation and assess its performance when varying some critical parameters. The
financial assessment closes this section. Secondly the GF process is then taken into account:
the technical and financial performances evaluations mirror the analysis and optimisation
previously carried out for the EHF process. The last section discusses and compares the main
results concerning the two production processes and draws some conclusions.
1 Portions of this Chapter have been published in Piccolo and Bezzo (2007) and Piccolo and Bezzo (2009).
34 Chapter 2
2.1 Literature survey
In the early ‘90s a network for the study of biomass-to-ethanol conversion called
‘‘Biotechnology for the Conversion of Lignocellulosics’’ under the sponsorship of the
International Energy Agency with the participation of research groups from USA, Canada and
Sweden has been promoted (Saddler, 1992), aiming of the design of a feasible biomass-to-
ethanol process. One of the strengths of this task force was the active participation of different
groups with expertise in each of the multi-component steps that constitute a feasible biomass-
to-ethanol process, which were meant to provide information for the development of more
accurate techno-economic models. Before a techno-economic model could be developed, the
key equipment and process steps were defined (Gregg and Saddler, 1995). This effort led to
the first generic process from wood design (Gregg and Saddler, 1995).
Other early works dealing with process synthesis for the production of fuel ethanol from
biomass were oriented to the estimation of production costs of ethanol from wood chips and
to the analysis of the interdependence of process parameters. In particular, the following
parameters were defined as the most significant: wood cost, enzyme costs, efficiency of the
cellulose hydrolysis, ethanol yield from pentoses, efficiency of fractionation process, and the
selling price of the by-product lignin (Nguyen and Saddler, 1991). These parameters were
assumed as useful to benchmark a conceptual process design.
The significant variety of pretreatment methods of biomass has led to the development of
many flowsheet options for ethanol production. Von Sivers and Zacchi (1995) analyzed three
pretreatment process for the ethanol production from pine: concentrated acid hydrolysis, two-
stage hydrolysis by steam explosion using SO2 and dilute acid, and steam explosion using
SO2 followed by the enzymatic hydrolysis. Through sensitivity analysis, these authors showed
that none of the processes could be discarded as the less rentable. Using commercial process
simulators like Aspen Plus® (Aspen Technologies, Inc., USA), this group of authors have
evaluated different modifications of the ethanol production process from willow wood
employing separate fermentations of hexoses and pentoses.
Alternative process configurations development followed hand in hand biotechnological
advancement aiming of engineering microorganisms capable of efficiently fermenting both
hemicellulosic and cellulosic substrates. Lynd (1996) and Lynd et al. (1996) gave an excellent
overview of 1996 state of the art technology, assessed the different processing steps and the
merge of conversion steps into fewer reactors (consolidation) that may have occurred over
time, and especially focused on the microorganisms development (Lynd et al. 2002).
However, there is only a qualitative indication of the technological and economic impacts of
future technologies without detailed systems analysis.
A pilot plant designed for the conversion of lignocellulosic biomass into ethanol was built by
the US National Renewable Energy Laboratory (NREL) and operated with the aim of
supporting industrial partners for the research and development of biomass ethanol
Techno-economic comparison between conversion technologies 35
technology (Nguyen et al., 1996). In this plant, tests in continuous regime for the utilization of
lignocellulosic residues of low cost and great availability like corn fiber were carried out
(Schell et al., 2004). The objective of these tests consisted in the assessment of the operation
of the integrated equipments and in the generation of data type of plants allowing for the
acquisition of valuable experience considering the future implementation of the industrial
process, as well as the feedback of the models utilized during the design step. In addition,
feasibility studies carried out by NREL were supposed to help industrial partners in making
decisions about the potential implementation of these technologies for fuel ethanol production
(Kadam et al., 2000; Mielenz, 1997).
Along with the experience gained in the pilot plant runs, NREL has developed an exhaustive
model for the design and costing of biomass- to-ethanol process (Wooley et al., 1999a and b).
The motivation for such a model was the demand for greater reliability and credibility in
predicting the costs of bioethanol production considering the increasing demand for cost
competitiveness and guiding the process development (Wooley et al., 1999b). The model
process designed by NREL comprises a hydrolysis of wood with dilute acid followed by a
simultaneous saccharification and co-fermentation (SSCF, see § 1.8.4) process utilizing
cellulases produced in situ by genetically engineered Z. mobilis with the ability of
transforming both glucose and xylose into ethanol. The process is energetically integrated
using the heat generated during the combustion of methane formed in the anaerobic treatment
of wastewater from pretreatment and distillation steps (Wooley et al., 1999a). In addition, the
burning of lignin allows for the production of energy for the process and a surplus in form of
electricity. For the simulation with Aspen Plus®, a database of the physical–chemical
properties of the main compounds involved during fuel ethanol production from wood chips
has also been structured (Wooley and Putsche, 1996).
This model is completed with capital cost estimations obtained from vendor quotes and using
the Icarus® cost estimation software (by Aspen Technologies, Inc., USA). It allowed for the
definition of the most promising research directions through simulation and process analysis
of the best proposals aimed at reducing ethanol production costs using lignocellulosic
feedstocks (Wooley and Ibsen, 2000). The production of one litre of ethanol by this process
was calculated US$0.396, whereas the ethanol production cost from corn was US$0.232
(McAloon et al., 2000).
Nagle et al. (1999) proposed an alternative configuration that involves a total hydrolysis of
yellow poplar using a three-stage countercurrent dilute-acid process validated at experimental
level. The obtained hydrolyzate is co-fermented by the recombinant strain of Z. mobilis. In
this case, the lignin is recovered prior the fermentation.
Gong et al. (1999) report a fractionation process employing corn cob and aspen wood chips as
feedstocks and utilizing alkaline pretreatment with ammonia that favours the separation of
lignin and extractives. After this step, the hemicellulose is hydrolyzed with dilute acid and
36 Chapter 2
releasing sugars are fermented by xylose assimilating yeast; finally the cellulose is converted
into ethanol by batch SSF using a thermotolerant yeast strain.
Iogen Corporation, a major manufacturer of industrial enzymes in Canada, developed a SHF
process comprising a dilute-acid-catalyzed steam explosion and the removal of the major part
of the acetic acid released during the pretreatment, the use of Saccharomyces cerevisiae as a
fermenting organism, distillation of broth, ethanol dehydration and disposal of stillage in
landfill (Tolan, 2002).
Reith et al. (2002) have reviewed different processes for production of biomass ethanol and
concluded that verge grass, willow tops and wheat milling residues could be potential
feedstock for fuel ethanol production in the conditions of the Netherlands. These authors
constructed a model using Excel® for the system description of generic biomass-to-ethanol
process. This process involves the evaporation of the stream from saccharification step in
such a way that the sugar concentration allows for a final ethanol concentration of at least 8.5
vol.% in the fermentation broth. In addition, pretreatment using Ca(OH)2 was included in the
analysis. The advantage of using this type of pretreatment is that inhibitors are not formed
implying that a detoxification step is not necessary. The evaluation showed that currently
available industrial cellulases accounts for 36–45% of ethanol production costs, and therefore,
a 10-fold reduction in the cellulase costs and a 30% reduction in capital costs are required in
order to reach ethanol production costs competitive with starch ethanol.
Wingren (2003) proposed a techno-economic comparison between the two dominating
process configurations for softwood conversion: SHF and SSF and determined where
bottlenecks in the two process lie. A sensitivity analysis was also conducted for evaluating the
impact of the cost and/or the load of enzymes on the overall production cost of ethanol.
Later modifications involve the co-fermentation of both hexoses and pentoses using
genetically modified strains of microorganisms like yeasts or bacteria.
Using the recombinant Z. mobilis strain patented by NREL, Lawford and Rousseau (2003)
tested two configurations for ethanol production using the conceptual design based on SHF
developed by Iogen. These authors demonstrated that a configuration involving the
continuous pentose fermentation using the recombinant Z. mobilis strain, and the separate
enzymatic hydrolysis followed by continuous glucose fermentation using a wild type strain of
Z. mobilis is the most appropriate in comparison to the use of the co-fermentation process
after the enzymatic hydrolysis or the use of an industrial yeast strain during the glucose
fermentation.
Ghosh and Ghose (2003) report the model process for bioethanol production proposed by the
Indian Institute of Technology (IIT) in Delhi (India). This process involves two pretreatment
steps: steam explosion for xylose production followed by solvent pretreatment for
delignification of biomass. The released pentoses are utilized for single cell protein
production, whereas the cellulose undergoes simultaneous saccharification and fermentation.
Techno-economic comparison between conversion technologies 37
The SSF reactor is coupled with vacuum cycling and has a stepwise feeding of cellulose. The
process has been tested in pilot plant using rice straw as a feedstock. However, the obtained
product is hydrous ethanol (95% v/v) and the production costs (US$0.544/L) are higher than
those expected for the production of dehydrated ethanol through the NREL model process
(US$0.39). The adoption of an adsorption separation stage (instead of distillation) increases
the cost of ethanol by about 50%.
Hamelinck et al. (2005) gave new insight in the development pathway of producing ethanol
from lignocellulosic, by modelling and comparing routes for the research, development and
implementation of large-scale conversion processes. In this study poplar is used as the base
feedstock. Improvement options for both individual process steps and the whole plant
(integration, scale up) are assessed, which lead to key configurations that are claimed to come
available in time, as development progresses. These configurations were analysed for their
technical and economic performance. An inventory was made of the process components,
their stage of development, and their applicability in different process configurations. Experts
were consulted to identify the potential barriers, uncertainties, and development time. The
assessment includes technologies that are not yet commercially available. Promising system
configurations for present and future, were selected. These configurations were analysed
using Excel® and Aspen Plus®. The results on technical modelling, process economics and the
sensitivity towards several parameters were reported.
Pan et al. (2005) from the University of British Columbia and Lignol innovations (Canada)
report the preliminary evaluation of the so-called Lignol process for processing softwoods
into ethanol and co-products. This process makes use of the organosolv process for obtaining
high quality lignin allowing the fractionation of the biomass prior to the main fermentation.
For this, the process utilizes a blend of ethanol and water at about 200°C and 27.6 bar. For
ethanol production, SHF or SSF has been tested. Streams containing hemicellulose sugars,
acetic acid, furfural and low molecular weight lignin are also considered as a source of
valuable co-products. Until now, the Lignol process has only been operated in a three-stage
batch mode but simulations studies indicate an improved process economics by operating the
plant in continuous mode (Arato et al., 2005).
Cardona and Sanchez (2004, 2006) simulated several technological configurations for the
production of fuel ethanol from biomass considering variations in the pretreatment, cellulose
hydrolysis, fermentation, separation and effluent treatment steps and taking into account the
integration possibilities. The simulations were performed using mostly Aspen Plus®. Energy
expenditures were utilized for the analysis and comparison of the proposed flowsheets. The
obtained results showed that the most appropriate flowsheet should include a dilute-acid
pretreatment, SSCF, distillation coupled with pervaporation, and evaporation and recycling of
part of the wastewater to be utilized as process water.
38 Chapter 2
Only few recent reports, mostly related to private-sector initiatives deal with the techno-
economic evaluation of the GF process. A feasibility study, concerning the process design
development and the investment and production cost assessment was performed by the
Eindhoven University of Technology in connection with Ingenia Consultants & Engineers
(VanKasteren, 2005). They concluded that ethanol production via gasification and
fermentation is competitive with the cellulosic process in Europe, even on the relatively small
scale studied (30.000 tons/year) and they calculated ethanol prices in the range of 0.60 €/L.
In the US at least two private company (BRI Energy, Inc., Mississippi Ethanol LLC) are
actively seeking to commercialize technology for fermentation of syngas (Bruce, BRI Energy
Inc., 2006). BRI Energy, Inc. has announced their intention to build two commercial facilities
near Oak Ridge, Tennessee, United States. One facility would convert coal-derived syngas to
ethanol, and the other would convert municipal solid waste via gasification to ethanol
(Powelson, 2006). Nevertheless little detailed documentation is publicly available to enable
an independent evaluation of BRI’s technology.
A more detailed report (Mississippi, LLC, 2002) was published in 2002 by NREL and
Mississippi Ethanol, LLC (ME), owner of a gasification facility, and of much of the
infrastructure necessary for the entire plant. As a result of this evaluation, a fermentation
process and facility has been defined that can match the pre-existing gasification process. For
an input stream of 30 tons/day of dry cellulosic waste products to the gasifier, this plant is
supposed to produce 4000 gallons of ethanol per day. The team estimated that a capital cost in
the range of 7-10 millions of dollars. The report concluded that there is an excellent potential
and that the ME process and intended facility can be used to profitably and successfully
produce ethanol.
2.2 Aim of the study
The EHF process is possibly the most mature process for the transformation of lignocellulosic
materials into ethanol. On the other hand, as reported in § 2.1, the GF process has been
somehow neglected in the scientific literature (at least when compared to the EHF process),
notwithstanding the promising results demonstrated in the few works appeared so far (e.g.
Datar et al., 2004). However, the technology potential (which is already available as a
commercial process) has nonetheless been widely recognised (Ragauskas et al., 2006) and
recently awarded through financing by the U.S.A. Department of Energy. Therefore, here the
process has been chosen and assessed as a possible alternative to EHF for the production of
bioethanol. This study aims at achieving the following goals. The first one is to deliver a
technical and economical comparison between two of the most important processes for the
conversion of lignocellulose to bioethanol. In general, it is difficult to assess different
processes when analysed by different research groups as preliminary assumptions, process
Techno-economic comparison between conversion technologies 39
design, financial modelling and data are rather “sensitive” to specific expertise, simplifying
hypotheses and data availability. Our purpose is to apply the same methodology to carry out
the technical and financial analyses for both processes so that the final results are indeed
comparable. Secondly, this work is willing to represent the first comprehensive analysis of the
GF process (with the partial exception of Mississippi Ethanol LCC, 2002). Although the
process is still in its early development (at least from what can be derived from published
material) and some data definitely still exhibit a significant uncertainty, the work aims at
assessing process design, potential optimisation directions and the effect of most important
parameters on the overall yield and financial indexes. Finally, a step forward in the
optimisation and analysis of the EHF process, is intended too. The use of pinch analysis and a
new design approach aim further reduction in the utilities demand. The effect of the improved
design is assessed in terms of energy efficiency, overall yield, product costs and financial
profitability. A processing capacity of 700,000 t/yr of dry biomass wood is assumed.
2.3 The EHF process: modelling
The process model was implemented on the Aspen Plus® v. 13.2 process simulator, a
modelling tool performing rigorous material and energy balance calculations. The accuracy of
the property data bank is of paramount importance for the reliability of the simulation results.
The physical property database for biomass material, specifically developed by NREL
(Wooley and Putsche, 1996), is used. The system thermodynamics are described by using an
NRTL model (except for the CO2 solubility modelled in terms of Henry's law).
Several flowsheet configurations have been proposed in the recent literature from ethanol
production for biomass (Cardona and Sànchez, 2006). The NREL's design for ethanol
production (Wooley et al., 1999a) and (Wooley et al., 1999b) with a new concept recovery
section is taken as a base case. The flowsheet is illustrated in Figure 2.1.
40 Chapter 2
S1 S2 S3
S4
S5
S7
S8
S9
S6
Figure 2.1 Flowsheet for the SSCF process with a new concept recovery section.
The process feed (160,950 kg/h) is assumed to be constituted of wet hardwood chips with the
following composition (Wooley et al., 1999a and b) and (Cardona and Sànchez, 2006):
• cellulose 22.1%;
• hemicellulose 9.9%;
• lignin 20.4%;
• moisture 47.4%.
A dilute acid steam explosion is taken as the pre-treatment step. The operating conditions are
defined as follows: temperature T = 190 °C, pressure P = 10 bar, residence time τ = 10 min
(Wyman et al., 2005). The above pre-treatment is chosen as it is one of the most extensively
tested technologies; however, note that, in general, the pre-treatment process should be
tailored to the specific lignocellulosic material (Galbe and Zacchi, 2007).
The conversion yield in terms of mass fraction of hemicellulose hydrolysed to hemicellulose
content is 0.75.
Ethanol production takes place in the SSCF reactor. Cellulase is used as a biocatalyst for the
cellulose hydrolysis and is assumed to be bought from dedicated producers. The fermenter is
operated at 40 °C and atmospheric pressure. The cellulose conversion into fermentable sugar
is 0.80; the actual sugar fermentation into ethanol is carried out by a recombinant Z. mobilis
bacterium: it is assumed that 92% of hexoses (glucose and fructose) and 80% of pentoses
(mainly xylose) are converted into ethanol. The outlet flow is a beer at 5.0% w/w ethanol.
The streams compositions are given in Table 2.1.
Techno-economic comparison between conversion technologies 41
Table 2.1 EHF process: main streams variables (streams’ numbers refer to Figure 2.1)
Stream S1 S2 S3 S4 S5 S6 S7 S8 S9 T [°C] 30 40 30.0 115 85.0 93.3 148.3 76.8 146.8 P[bar] 1 1 1 5 1 1 5 1 10
Mass flow [kg/h] 160950 236927 425329 114449 304813 35457 29000 22220 458 Vapor fraction 0 0 0 0 0 0 1 1 1 Mass fraction
EtOH - - 0.050 0.055 0.047 0.412 0.217 0.920 0.920 CO2 - - 0.001 0.001 0.001 0.010 0.005 0.000 -
Water 0.474 0.636 0.835 0.931 0.800 0.573 0.775 0.072 0.059 Glucose - - 0.006 0.007 0.006 - - - - Xilose - 0.059 0.005 0.006 0.005 - - - - Lights - 0.001 0.001 0.005 0.003 0.007 0.020 Xylan 0.103 0.017 0.013 - 0.013 - - - -
Cellulose 0.221 0.150 0.023 - 0.023 - - - - Lignin 0.203 0.138 0.105 - 0.105 - - - -
The effect of small amounts of side-products has been considered in the simulation: this is an
important (and often neglected) point as side-products (particularly, light ones) affect the final
recovery configuration. Light side-products have been represented by including a small
amount of acetaldehyde (after the CO2 removal stage, the fermentation broth still contains
0.1% w/w CO2 and 0.06% w/w acetaldehyde). As illustrated in Fig. 2.2, an integrated
separation scheme is designed. The separation scheme is patterned after those used in the
existing corn ethanol industry (Jacques et al., 2003) and (Franceschin et al., 2008). A multi-
effect distillation scheme is adopted in order to minimize steam consumption.
PRESSURIZEDSTRIPPER
5 bar
SOLIDS COLUMN
RECTIFIER
LIGHT PRODUCTS COLUMN10 bar
EtOH 92%
LIGHTS
EtOH 92%
DECANTER
REBOILER
Figure 2.2 EHF process: recovery system diagram (bold lines represent the hot streams).
42 Chapter 2
A decanter splits the input stream into two substreams: i) a fraction rich in solids, which is fed
to an atmospheric column (first stripper) recovering 99% of the product in the distillate
(composition: about 40% ethanol by weight); ii) a second fraction with no solids, which is
sent to a pressurized column (second stripper): the distillate (20% ethanol by weight) is used
to deliver some of the duty required by the reboiler in the final rectifying column. The stream
compositions are reported in Table 2.2. This unit is designed to obtain at least a 92% purity in
the side stream so that molecular sieves can be used to dehydrate the ethanol. A 2% of
ethanol, dragged along by light products, purged from rectifier head, is recovered in a 10-tray
still, operating at 10 bar.
Table 2.2 EHF process: steam and related energy requirements for most energy intensive unit operation; HP and LP stands for High Pressure (13 bar) and Low Pressure (4 bar) steam, respectively.
HP [kg/L EtOH] HP [MJ/L EtOH] LP [kg/L EtOH] LP [MJ/L EtOH]
Pre-treatment 1.67 3.32 0.64 1.37
Distillation 1.22 2.39
Evaporation 2.03 4.34
The bottoms of the first stripper are fed to a centrifuge to separate the solids from the liquid
solution, which is further concentrated through a triple-effect evaporator (the effects operate
at 0.6 bar, 0.31 bar and 0.20 bar, respectively).
The pressurized stripper and rectifier stillage are conveyed to a water treatment section where
biogas is produced through anaerobic fermentation: the methane generated in the water
treatment section is obtained from literature data (Cardona and Sànchez, 2006).
The base case simulation results in an ethanol production of 312 L/ton of dry biomass (in the
specific case, 20.9 t/h of ethanol are obtained, while CO2 emissions are equal to 20 t/h).
2.4 The EHF process: energy optimisation
The flowsheet previously described can be further optimised to reduce the energy
consumption. A Pinch Technology Analysis (PTA) (Linnhoff and Flower, 1978) approach has
been carried out with concern to the recovery section. According to acknowledged practice,
all the heat exchangers and the hot (i.e. to be cooled) and cold (i.e. to be heated) streams were
identified. The ΔTmin representing the minimum temperature difference between the hot and
the cold sides in all the process heat exchangers is set to 10 °C. The pinch point (i.e. the single
temperature at which ΔTmin occurs) is found at 81.8 °C. Accordingly, for the hot streams the
pinch temperature is 86.8 °C and for the cold streams is 76.8 °C. The construction of the
composite curve allows pointing out the minimum amount of external heating and cooling for
Techno-economic comparison between conversion technologies 43
global process (Figure 2.3). A cascade of heat exchangers is defined between hot and cold
streams, in order to recover all the heat according to the composite curve construction.
0 50 100 150 200 250 3000
50
100
150
200
250Hot Utility
Cold utility
Tem
per
atu
re [°
C]
Enthalpy [GJ/h]
Figure 2.3 EHF process: grand composite curve.
The analysis shows that 23 heat exchangers (evaporators included) are needed. The composite
curve analysis (basically confirmed by a successive simulation) shows that, after the pre-
treatment and fermentation steps, about 196 GJ/h need to be supplied to the process, while
about 281 GJ/h should be removed. Supplementary water and steam are needed in the power
production section. Global utilities consumption (including steam for the pre-treatment step)
is calculated as 3.8 kg of 13 bar steam/L EtOH (of which 1.2 kg/L EtOH for product
recovery), 3.0 kg of 4 bar steam/L EtOH, 294.1 kg of cold water/L EtOH. The steam
consumption in the molecular sieves was estimated to be equal to 1.1 MJ/L EtOH (Jacques et
al., 2003). The total energy consumption is therefore 8.5 MJ/L EtOH. Table 2.3 summarises
the energy demand of the most energy intensive operations. Simulation results significantly
improve the estimation of energy needs reported in the literature so far (Table 2.3),
demonstrating the effectiveness of the optimised design.
44 Chapter 2
Table 2.3 EHF process: energy requirements [MJ/L EtOH] reported in literature.
Stage This case Cardona and Sanchez (2006)
Lynd et al., 1996
Hamelinck et al. (2005)
Hinman et al. (1992)
Pre-treatment 4.69 4.23 2.46 2.46 Distillation 2.39 5 5
9.95
Dehydration 1.11 27.89
Evaporation 4.34 4.35
2.5 The EHF process: heat and power production
The transformation of lignocellulose into ethanol is energy self-sufficient. In fact, the solid
residues exhibit a heating value of about 29.54 MJ/kg (Cardona and Sànchez, 2006). The
solid residues together with the concentrated syrup from the evaporators are burnt in a
fluidized-bed combustor. The moisture of the combined feed is 55% and its average heating
value is 9.54 MJ/kg. Additionally, through the anaerobic treatment of the columns stillage
biogas (60% methane; heating value: 20 MJ/m3) is obtained.
The solid residues and biogas energy content are exploited to produce steam for a turbine
system, as in Wooley et al (1999a). A 62% energy efficiency is assumed for the boiler.
Calculations show that 2.60 kg/kg dry wood of superheated (510 °C, 104.5 bar) steam can be
obtained in the boiler. The simulation of a multiple-stage steam turbine demonstrates that for
the plant being considered about 37.9 MW of electricity can be generated (operation
assumptions are reported in Table 2.4). Considering that the overall electric power demand is
estimated as 32 MW (Wooley et al. 1999b), about 250 MJ of electricity surplus per ton of dry
wood is eventually obtained.
Table 2.4 EHF process: multistage turbine operating conditions and performances.
Stage Pressure out [bar] ηisoentropic Steam [kg/h] Power [MWe]
1 13 0.90 101200 33.1
2 4.4 0.38 80784 2.9
3 0.1 0.30 38016 1.9
To summarise, for the process being considered, about 420 MW as biomass heating value
produce 156 MW of ethanol and about 5.9 MW of electric power, i.e. 0.39 energy units are
obtained for one energy unit of lignocellulosic biomass.
Techno-economic comparison between conversion technologies 45
2.6 The EHF process: process sensitivity analysis
Current research focuses on different strategies for improving the performances and the
economics of bioethanol production. In particular, a big effort is put on producing
biotechnological advancements for high productivity enzymes (stable at higher temperature so
as to increase the reaction rate, and tolerant to higher concentrations of products). A
sensitivity analysis can be performed to evaluate the impact of a general progress on the
process performances. Two potential future scenarios are discussed. Assuming that the yield
in the conversion reactor will increase over the years, mid-term and long-term scenarios are
simulated. Main assumptions are reported in Table 2.5 (Lynd et al., 1996) and (Hamelinck et
al., 2005).
Table 2.5 EHF process: yields characterising different scenarios.
Hemicellulose
hydrolysis
Cellulose
Hydrolysis
Hexoses
fermentation
Pentoses
fermentation
Concentration
of broth [w%]
Mid-term scenario 0.825 0.880 0.950 0.935 7.0
Long-term scenario 0.865 0.920 0.970 0.970 10.0
Simulation results show that according to the mid-term scenario, the amount of ethanol can be
increased up to 362 L/ton of dry biomass; the long-term scenario foresees a potential of about
390 L of ethanol per ton of dry biomass.
Product concentration in the fermentation broth sensibly affects the utilities demand, too.
According to the mid-term scenario, LP and HP steam consumptions are reduced by 4% and
5%, respectively; with concern to the long-term scenario, a decrease of 12% and 15% is
obtained for LP and HP steam consumptions. One direct result is that for the case being
investigated the net electric output increases from 5.9 MW up to 6.6 MW (270 MJ/ton of dry
wood) for the mid-term scenario and up to 7.7 MW (315 MJ/ton of dry wood) for the long-
term scenario, because less duty is required to separate a more concentrated mixture. There is
also a reduction in cooling water demand: 8% and 13% for the mid- and long-term scenarios,
respectively.
2.7 The EHF process: financial analysis
The process design study has been used to predict production cost and to assess its market
potential. The process flow and balances were used to size equipments, and assess variable
and fixed costs. The only products considered in this study are ethanol and electricity. For
comparisons with gasoline a base of 70 $/bbl of oil is assumed; the gasoline production cost is
roughly 0.50 €/L.
46 Chapter 2
2.7.1. Equipment sizing and cost estimation
Equipment sizing follows from the simulation models (heat exchangers, columns,
compressors) and from literature data (Wooley et al., 1999a). The total annual investment is
calculated by a factored estimation, based on knowledge of major items of equipment (as
found by direct sizing and cost correlation) and indexed to the year of interest using the
Chemical Engineering Index (Chem. Eng. 144 , 2007). The installation investment costs for
separate units are added up. A simplified investment model (Douglas, 1988) is used to
estimate the total project investment (TPI). Main estimated costs are reported in Table 2.6.
Table 2.6 EHF process: equipments and total investment cost.
Installation costs [M$] Source
Pretreatment 31.52 Wooley et
al. (1999a)
Heat exchangers 10.87 Calc
Stills 4.27 Calc
Fermentation section 12.86 Wooley et
al. (1999a)
Compressors 0.31 Calc.
Steam turbine 44.5 Calc.
WWT 10.40 Wooley et
al. (1999a)
TPI [M$] TPI [M€]
Onsite 114.74 270.78 203.44
+30% 149.16 352.02 264.47
The ethanol production cost is calculated by dividing the total annual costs (annual
investment, operating and maintenance, raw materials, electricity supply/demand) by the
produced amount of fuel. Operational costs are given as a percentage of TCI (Total Cost of
Investment) and are derived from literature as well as consumables' purchase cost (Hamelinck
et al., 2005). For the base case a 54 €/t dry biomass ton is considered. Table 2.7 summarises
cost component allocation (a 5-year depreciation time is assumed).
Techno-economic comparison between conversion technologies 47
Table 2.7 Production cost components (TPC is the Total Production Cost)
€ per year ( 10-5) €/L
Biomass 366 0.173
Other raw materials 563 0.266
Utilities 25 0.012
Labour 95 0.044
Waste disposal 7 0.003
Depreciation (5 years) 291 0.138
Electricity credit -16 -0.011
TPC 1321 0.556
TPC (excl. depreciation) 821 0.487
If a depreciation time of 10 years is taken into account, the ethanol production cost decreases
to 0.56 €/L. However, for a new production in a very changing (and risky) market and with
rapidly evolving technologies, we think it is more sensible to shorten the depreciation time.
The crude oil price should be at around 90 $/bbl to have comparable costs of production. If a
10-year depreciation time is considered, similar costs are obtained for a crude oil price of
about 80 $/bbl.
2.7.2. Payback analysis
The financial analysis is carried out by means of a number of profitability indexes. The
following hypotheses are assumed
– interest rate: 10%;
– load: 8000 h;
– investment path: 20% in first year, 30% in second and 50% in last year;
– working capital: 15% of TCI;
– electricity price (supply and demand): 0.05 €/kWh;
– fractional income tax rate: 35%.
The double declining balance depreciation method is adopted. Based on the above
assumptions two different scenarios are taken into account. The first one (PB10) considers a
technical life time for the plant of 15 years, depreciation time and a payback time of 10 years;
the second one assumes a 10-year life time and 5 years for both the depreciation and the
payback times.
The product selling price is determined as the one allowing the defined payback period. This
results as 0.68 €/L for PB10 and 0.80 €/L for PB5, which are sensibly higher than the current
market price for ethanol at about 0.58 €/L (note that such price is usually further reduced in
the case of long-term supply contracts as is usually the case in the ethanol industry (Solomon
et al., 2007)).
48 Chapter 2
A cash flow analysis is carried out for both instances. From Table 2.8, it can be seen that the
Net Present Value (NPV) is negative for PB10 and is positive (about 9.4 M€) for PB5. That
means that with the price allowing a 10-year payback period, at the end of plant life, the
project adds no monetary value: not necessarily the consequence is that the project is
unprofitable; however, it stresses that the investment may be risky and the decision whether to
invest or not should take into account a deeper product market analysis as well as a more
detailed cost estimation analysis. On the other hand in a PB5 scenario, the project will be in
the status of cash inflow at the end of plant life. However, ethanol needs selling at a very high
price: presently, that does not seem viable unless relying on some forms of government
subsidies.
Table 2.8 EHF process: economic indexes for the PB10 and PB5 scenarios.
NPV [M€] IRR [%] ROI [%]
PB10 -22.1 8.16 20.5
PB5 22.7 11.0 32.5
Other profitability indexes are here estimated (Table 2.8): these are the ROI (Return Of
Investment, defined as the ratio of profit to investment) and the IRR (Internal Rate of Return,
defined as the discount rate that results in a NPV of zero of a series of cash flows). The IRR is
possibly the most meaningful index due to its discounted nature. In general, a project is a
good investment proposition if its IRR is greater than the rate of return that could be earned
by alternative investments. Thus, the IRR should be compared to an alternative cost of capital
including an appropriate risk premium. For a project involving a rather high risk level the
suggested IRR is usually 15% (Douglas, 1988). Calculated values for ethanol plant are well
below this threshold limit, resulting in a poorly profitable investment choice. Furthermore,
note that the analysis is based on the possibility of selling ethanol at the prices indicated
above. That would be possible either in case of peaking of oil prices (in order to have the
same selling price per energy unit, crude oil price should be at about 100 $/bbl for the PB10
instance and about 110 $/bbl for the PB5 case) or through some government intervention in
terms of financial subsidies (that, in fact, could even allow a higher selling price).
Furthermore, IRR is determined for the case with ethanol price set at 0.58 €/L, in order to
assess process profitability in the actual market conditions. For a 15-year plant life the IRR
index is slightly positive (1.7%) and for a 10-year plant it is even negative (−2.6%). This last
value, meaningless from the economic point of view, suggests that the investment, with the
product price imposed by current market laws, is definitely not profitable.
Techno-economic comparison between conversion technologies 49
2.7.3. Product cost sensitivity
The effect of different parameters on ethanol selling price is investigated. It is assumed that
the power generation is not sensitive to the variation of such parameters. Although not strictly
correct, the assumption is justified by the fact that power generation capital costs are not
significantly affected and profits from electricity sold to the grid are a minor contribution
(unless government subsidies as the EU Green Credits are taken into the balance).
One of the most important variable is the feedstock cost, which accounts for about 35.5% of
the total product cost (excluding depreciation). Table 2.9 summarises the results based on
such sensitivity analysis. It can be seen that with a feedstock cost of 36 €/ton of dry biomass a
reduction in cost production of more than 10% of that associated with the base case would
occur. This decrease also affects the ethanol selling price, determining a reduction of about 8–
9% in both the PB5 and PB10 instances.
Table 2.9 EHF process: ethanol price sensitivity to feedstock cost.
Feedstock cost
[€/dry ton biomass]
TPC10
[€/L EtOH]
TPC5
[€/L EtOH]
PB10
[€/L EtOH]
PB5
[€/L EtOH]
63 0.59 0.65 0.71 0.83
54 0.56 0.63 0.68 0.80
45 0.53 0.60 0.65 0.77
36 0.50 0.57 0.62 0.74
Cellulase is another component cost which plays a decisive role in determining the product
cost. Its average charge is estimated from literature data (Hamelinck et al., 2005). Assuming
that its cost may decrease with time, a sensitivity analysis is carried out. Table 2.10
summarises the effects on the ethanol price. The case with cellulase production performed in
seed reactors is also investigated. This case involves reduced operational costs, but, on the
other hand, a decrease in ethanol production (because a biomass fraction is channelled to the
seed reactors) and a significant increase in the capital investment (Wooley et al., 1999a). This
last aspect strongly affects prices, in particular if a short payback is desired.
Table 2.10 EHF process: ethanol price sensitivity to cellulase cost.
Cellulase cost [€/L EtOH] TPC10
[€/L EtOH]
TPC5
[€/L EtOH]
Price payback 10
[€/L EtOH]
Price payback 5
[€/L EtOH]
0.13 0.56 0.63 0.68 0.80
0.10 0.52 0.59 0.65 0.77
0.07 0.50 0.56 0.62 0.74
Own production 0.46 0.54 0.62 0.76
50 Chapter 2
The technological advancements previously discussed are here assessed in financial terms: as
can be seen from Table 2.11, higher conversion yields and broth concentration result in a
significantly lower ethanol selling price.
Table 2.11 EHF process: ethanol cost sensitivity to conversion yields
Case TPC10
[€/L EtOH]
TPC5
[€/L EtOH]
Price
payback 10
[€/L EtOH]
Price
payback 5
[€/L EtOH]
Base case 0.56 0.63 0.68 0.80
Mid-term scenario 0.46 0.52 0.57 0.68
Long-term scenario 0.41 0.47 0.42 0.60
2.8 The GF process: modelling
Thermochemical gasification is the conversion by partial oxidation at elevated temperature of
a carbonaceous feedstock into a gas product. The partial oxidation can be carried out using
air, oxygen, steam, or a combination of these. Gasification occurs in sequential steps: drying
(to evaporate feedstock moisture), pyrolysis (to give gas, vaporized tars and a solid char
residue), gasification (or partial oxidation of the solid char, pyrolysis tars and pyrolysis
gases).
Numerous models (e.g. Varhegyi et al., (1997) and Rostami et al. (2004)) have been
developed so far to describe the pyrolysis of biomass by taking into account kinetics, heat
and/or mass transport. However, in a general-purpose analysis as the one in this paper, such
models are of little use since parameters and results are very much dependent on the specific
pyrolysis conditions and reactors. On the other hand, also models based on thermodynamic
equilibrium calculations (e.g. Gueret et al. (1997) and Lee and Sanchez (1997)) are not
suitable to describe pyrolysis as equilibrium is not usually reached. For this reason the
treatment of the pyrolysis step was simplified and modelled by setting the yield of different
products according to literature experimental data (Zanzi et al., 1996). The outlet composition
in terms of CO, CO2, CH4, H2, C2H4, char (whose physical and chemical properties are
assumed to be the same as carbon graphite) and tars (described as anthracene) is reported in
Table 2.12. The experimental data refer to a moisture content of 5.0%, which, in general, is
obtainable only through a ventilated drying house. For the process being considered that could
be practically achieved by using exhausted fumes from the power generation system and,
therefore, it is not going to affect the overall energy balance in a significant way. In general,
the effect of water in the gasification is to increase the H2 fraction with respect to CO.
Therefore, being CO the most important reactant for the biological fermentation into ethanol,
Techno-economic comparison between conversion technologies 51
dry biomass is a benefit. If natural ventilation is used for biomass drying, the final moisture
content is usually around 10–15%, which does not represent an issue.
Table 2.12 GF process: pyrolysis products distribution.
Tars 0.2
Chars 5.6
Gas 83
Product gas composition (dry)
CO 45.7
CO2 7.5
H2 34
CH4 11.7
C6H6 0.6
C2+ 0.5
Pyrolysis products react with the oxidizing agent to give permanent gases (CO, CO2, H2) and
a lesser quantity of hydrocarbon gases. Char gasification is the interactive combination of
several gas–solid and gas–gas reactions in which solid carbon is oxidized to carbon monoxide
and carbon dioxide, and hydrogen is generated through the water–gas shift reaction
(Bridgwater, 1995): equilibrium conditions are more likely to occur because of the higher
temperature and the “less heterogeneous” reaction conditions.
An equilibrium model of the gasification process is therefore developed and validated by
comparison with experimental data (Bridgwater, 1995). Oxygen is considered as the oxidizing
agent; experimental data as well as the system thermodynamics show that the gasification
should be run at a high temperature, i.e. at least 1000 °C. The composition of the biomass in
terms of the constituting elements is summarised in Table 2.13 (Zanzi et al., 1996).
Table 2.13 GF process: biomass elemental analysis and LHV.
w% C 48.4
w% N 0.2
w% H 5.6
w% O 45.8
LHV [MJ/kg dry] 18.7
52 Chapter 2
The outlet composition is obtained by minimising the Gibbs energy at T = 1000 °C. Ratios of
0.3 kg of O2 per kg of dry biomass are typical values, reported for different gasification
processes (Hamelinck and Faaij., 2001). The gasifier yield (kmol gas/ton of dry biomass) is
equal to 66.6, while the cold gas efficiency is equal to 0.70. Results are summarised in Table
2.14 where they are also compared to a typical gas composition for an oxygen-blown gasifier
(Klass, 1991).
Table 2.14 GF process: comparison between typical experimental gas composition and simulation results.
Dry gas composition (mol%) Exp. data Calc. data
H2 32 39.2
CO 48 45.4
CH4 2 0.6
CO2 15 14.7
C2 - -
The main deviations from the expected value concern the hydrogen and methane
compositions. This may be related to a different biomass water content and/or to a number of
non-equilibrium conditions that may establish because of temperature gradients in the
heterogeneous phase (Kilpinen et al., 1991). In fact, by considering pseudo-equilibria in the
system (Prins et al., 2007) we indeed verified a better agreement with the reported
experimental data. However, once again, since there exists a significant variability in the
experimental data reported in the literature, we considered it more “reasonable” to represent a
general behaviour rather than tuning the results on some specific data.
Since syngas composition may vary a lot accordingly to feedstock and gasifier configuration,
a preliminary sensitivity analysis was carried out to investigate the effect of gas composition
on the ethanol yield by considering a rather common range of variability in the experimental
data published in the literature (for pure oxygen fed gasifiers operating in similar conditions).
Experimental data demonstrate that most variability in the gas composition is related to
hydrogen, which is significantly less important in the final ethanol yield. CO is less sensitive
and furthermore its variations are somehow balanced by an opposite variation in the hydrogen
production. In general, it was verified that some variability in the syngas composition does
not affect the analysis significantly: we think it is fair to assume about a 15% error in the
potential yield calculated in the base case.
The outlet gas stream is cooled down (by producing steam) and then fed to the fermentation
tank. Literature (e.g. Spath and Dayton (2003); Mississippi Ethanol LCC Final report (2002);
Clausen, 2006) is not consistent about product gas conversion yields. In this work, it was
decided to rely on data derived from. (Mississippi Ethanol LCC Final report (2002)), which
Techno-economic comparison between conversion technologies 53
represents the most complete study on the topic published so far. The fermentation is carried
out by bacterium C. ljungdahlii at 39 °C and atmospheric pressure. The conversion yield of
CO is set to 53.1% with respect to ethanol and 4% with respect to acetic acid; as regards H2 it
is assumed that 18.8% will convert to ethanol, while 1.4% will turn into acetic acid. Ethanol
concentration in the broth is set to 2.4% in weight and acetic acid concentration is 0.4%.
The recovery section (illustrated in Fig. 2.4) is once again defined according to multi-effect
scheme: a pressure stripper operating at 2.1 bar through direct steam injection and a pressure
rectifier operating at 1 bar.
RECTIFIER 1 bar
P-1
REBOILER
STRIPPER 2.1 bar
STEAM
EtOH 92%
Figure 2.4 GF Product recovery scheme. (the bold line represents the hot stream)
Although an optimisation procedure through PTA was carried out in this case, too, the results
show that due to the very low ethanol concentration tolerated in the fermentation broth, the
product recovery remains a very energy intensive operation. The optimisation shows that
5.4 kg steam/L EtOH are required.
The outlet gas from the fermentation unit is fed to a burner and fuel gases are used to generate
superheated steam in a boiler.
The process overall material balance is reported in Table 2.15. It can be seen that 203.5 L of
ethanol per ton of dry biomass are obtained.
54 Chapter 2
Table 2.15 GF process: gasifier-fermenter material balance.
INPUT [kg/h] OUTPUT [kg/h]
Dried Biomass 84670
Oxygen 25400
Outlet from gasifier 111243
Ethanol 13611
Acetic acid 2002
2.9 The GF process: heat and power production
The co-generation system consists of a combustor, a number of heat exchangers and a
multistage steam turbine (Magnusson, 2005). In the burner exhausted gases from the
fermentation tank are burnt with preheated air (250 °C). The air flow is set in order to obtain a
ratio of oxygen in the flue gases with respect to the inlet air equal to 0.6: this is done to limit
the maximum temperature to 1110 °C.
Feed water (143 t/h) enters the steam boiler and in the economiser is heated to about 25 °C
below saturation temperature (330 °C). It is then fed into the evaporator where saturated
steam is raised at 150 bar. Finally, in the superheater, steam is pushed to turbine inlet
conditions: 540 °C and 140 bar. The specifications for steam turbine system are reported in
Table 2.16. Note that also the steam generated in the cooling of the gasifier output stream
(46 t/h of steam at 25 bar and 316.6 °C) enters the second stage of the turbine. After the third
stage 89 t/h of 4 bar steam are separated and conveyed to the distillation needs.
Table 2.16 GF process: cogeneration process features and performances.
Stage Pressure out [bar] ηisoentropic Power [MWe]
1 25 0.90 19.2
2 6 0.89 15.4
3 4 0.38 1.6
4 0.5 0.33 3.2
The process is self-sufficient from an energetic point of view. About 39.4 MW can be
generated. Considering that the process power demand is about 14 MW (Bioengineering
Resources Inc (2006)), and power demand for oxygen production 259 kWh/ton of O2
(Hamelinck and Faaij., 2001), a significant power surplus (18.9 MW) is available and can be
sold to the grid: about 780 MJ of electricity surplus per ton of dry wood can be sold to the
grid.
Techno-economic comparison between conversion technologies 55
To summarise, from about 420 MW of biomass, about 101 MW of ethanol and 18.9 MW of
excess electricity can be obtained in this process, i.e. 0.29 energy units are obtained for one
energy unit of lignocellulosic biomass (significantly less than in the EHF process).
2.10 The GF process: sensitivity analysis
A critical parameter in assessing the process performance concerns the conversions in the
fermentation reactions. Other references suggest that sensibly higher conversions can be
obtained in the fermentation reactor (for instance, Spath and Dayton (2003)) declare that 90%
of CO and 70% of H2 can be converted into ethanol on lab-scale facilities). Such conversions,
if confirmed, would obviously change the overall technology potential. In this study, it was
decided to consider the effect of a 15% and 50% conversion increase in both CO and H2 with
respect to the base case. These improvements are categorised as mid- and long-term scenarios
and are summarised in Table 2.17 (the possibility of a higher broth concentration is also
assumed).
Table 2.17 GF process: hypotheses for the mid and long term scenarios.
Case Yield
EtOH/CO
Yield
EtOH/H2 Concentration
Base case 53.10 18.80 2.4%
Mid-term scenario 61.10 21.60 3.0%
Long-term scenario 80.0 28.00 5.0%
Simulation results show for the mid- and long-term scenarios an increase in the ethanol
production up to 228 L and 282 L per ton of dry biomass, respectively; conversely, electric
energy surplus is reduced to about 650 MJ and 270 MJ per ton of dry biomass, respectively.
In terms of energy balance (ethanol heating value plus electricity sold to the grid), the mid-
and long-term scenarios show an overall increase up to about 113 MW and 139 MW,
respectively.
2.11 The GF process: financial analysis
Similar to what was done for the EHF, process equipments size and installation cost are
assessed through direct factored estimation or from literature sources (Hamelinck and Faaij.,
2001). Table 2.18 summarises the estimated installation costs.
56 Chapter 2
Table 2.18 GF process: equipments and total investment costs.
Installation costs [M$] Source
Pretreatment 38.2 (Douglas , 1988)
Gasifier 73 (Douglas , 1988)
Cyclones 1.8 (Douglas , 1988)
Fermentation vessels 12.87 (Douglas , 1988)
Stills 2.68 Calc.
Heat exchangers 9.45 Calc.
O2 plant 27.63 (Douglas , 1988)
Steam turbine 53.83 (Douglas , 1988)
TCI [M$] TCI
[M€]
Onsite 219.46 517.93 389.12
+30% 285.30 673.31 505.86
2.11.1 Cost estimation
The cost of the product is determined from the annual production cost. Calculations do not
consider the biocatalyst cost, which is presently not available on market. Table 2.19 outlines
cost allocations (a 5-year depreciation time is assumed).
Table 2.19 GF process: production cost components.
€ per year ( 10-5) €/L
Biomass 366 0.265
Other raw materials 1.5 0.001
Utilities 1 0.001
Labour 25 0.181
Depreciation (5 years) 711 0.516
Electricity credit -78 -0.055
Total production cost 1251 0.908
TPC excluded depreciation 543 0.394
Same calculations for a 10-year depreciation time give a total product cost of 0.65 €/L. In the
GF process the burden of the capital cost is very important.
For the GF process the difference between the energy cost of ethanol when compared to
gasoline is even higher than that in the EHF process. Crude oil price should be at around 125
Techno-economic comparison between conversion technologies 57
$/bbl to have comparable costs of production. Even if a 10-year depreciation time is
considered, similar costs are obtained for a crude oil price of about 95 $/bbl.
2.11.2 Payback analysis
The PB5 and PB10 instances based on the same hypotheses assumed for the EHF process are
assessed. Main economic indexes are summarised in Table 2.20. Results are not so different
from the EHF process. The IRR index is well below the recommended 15% value, even if a
very high ethanol selling price could be imposed to the fuel market (and in this case a
significant income also derives from the selling of electricity).
Table 2.20 Economic indexes for GF process.
Case Ethanol Price
[€/L EtOH]
NPV
[M€]
IRR
[%]
ROI
[%]
PB10 0.89 -48.9 7.7 20.2
PB5 1.20 5.9 10.4 31.9
If the present market price of ethanol (0.58 €/L) is assumed, the IRR index for PB5 and PB10
results respectively in 0.3 and −4.1%: these values are symptomatic of a definitely
unprofitable project investment.
Note that in order to have the same selling price per unit of energy, the price of crude oil
should rise to about 120 $/bbl in the case of the PB10 scenario and about 160 $/bbl in the case
of the PB5 case.
2.11.3 Product cost sensitivity
The effect of different parameters on ethanol selling price is investigated. As before, one of
the most important variable is the feedstock cost, which accounts for 67% of the total product
cost (without depreciation). Table 2.21 summarises the results based on such sensitivity
analysis. A feedstock available at 36 €/dry ton would determine a reduction (with respect to
the base case) on the production cost of about 11% (TPC10) and 8% (TPC5). However, the
ethanol selling price is reduced of only 7.8% for PB10 and 5% for PB5.
58 Chapter 2
Table 2.21 GF process: effect feedstock cost on production cost and ethanol selling price.
Feedstock cost
[€/dry ton biomass]
TPC 10
[€/L EtOH]
TPC 5
[€/L EtOH]
PB10
[€/L EtOH]
PB5
[€/L EtOH]
63 0.71 0.98 0.96 1.28
54 0.65 0.91 0.89 1.20
45 0.62 0.89 0.87 1.19
36 0.58 0.84 0.82 1.14
The effect of fermentation reaction conversion yields on product price is assessed for the mid-
and long-term scenarios previously discussed. Results are summarised in Table 2.22.
Table 2.22 GF process: effect of fermentation yields on production cost and ethanol selling price.
Case TPC 10
[€/L EtOH]
TPC 5
[€/L EtOH]
PB 10
[€/L EtOH]
PB 5
[€/L EtOH]
Base case 0.65 0.91 0.89 1.20
Mid-term scenario 0.59 0.82 0.80 1.08
Long-term scenario 0.50 0.68 0.72 0.94
2.11.4 Additional comments on the GF process
The GF process appears to be a less mature technology than the EHF process, at least from
the information available in the scientific literature. One major challenge that needs tackling
is how to increase the H2 and CO conversion in the fermentation reactor. On the one side, a
higher conversion would require more efficient micro-organisms for the fermentation
reactions. On the other side, a critical issue is to enhance the mass transfer between the gas
phase (reactants) and the liquid biological broth. For some aspects, this is a typical chemical
engineering issue, which had to be dealt with in several traditional processes. However,
although several technological solutions can be taken from elsewhere, biological systems do
present some peculiar challenges: for instance, any novel reactor design should take into
account the effect of mixing and shear stress on the cell growth and on the fermentation
kinetics. Additionally, it is important to assess whether a higher mass transfer may cause a
higher concentration of pollutants and inhibitors in the broth, so that a more expensive
upstream gas cleaning technology may be necessary. Finally, some biotechnological
advancement is advocated to guarantee a suitable selectivity in the fermentation process and
to improve the bacteria resistance to ethanol concentration in the broth: that would allow
processing more concentrated solutions and decreasing the energy cost for ethanol recovery.
Techno-economic comparison between conversion technologies 59
2.12 Final remarks
In this analysis two conversion technologies for the lignocellulose conversion into ethanol
have been assessed in terms of yield and profitability.
The first technology is the enzymatic hydrolysis and fermentation (EHF) process. A further
improvement in the recovery design in order to reduce the process energy consumption has
been demonstrated. The improved design and a comprehensive use of information from
previous works have allowed to better assess the present process profitability and the effect of
critical process and finance parameters. Although the production cost of ethanol is not so far
from the production cost of gasoline (just before submitting this paper crude oil hit a new
record at over 80 $/bbl), the complexity of the fuel market advocates for an investment
payback of not more than 5 years; as a result the high capital cost causes the ethanol selling
price to be set at about 0.80 €/L, which is quite beyond the present market value of fuel-grade
ethanol. Furthermore, even if such price were presently viable, the IRR index still signals that
the investment would still be rather risky and might not be the best business on the market.
The analysis shows that still substantial technological improvements are needed to allow the
lowering of the selling price in a significant way and make the technology attractive on a
large-scale business.
The second technology investigated is the gasification and fermentation (GF) process. Much
less material has been published so far on this technology and one important contribution of
this work has been to deliver a first comprehensive process analysis and to assess it versus the
EHF process. Although quite an impressive yield could theoretically be achieved if some of
the lab results were achievable industrially, the present state of the art of the technology does
not seem to be mature enough for an attractive business. In fact, the burdens of large capital
cost, energy expensive recovery and a moderate final yield determine a very high production
cost and the need of a very high ethanol selling price (about 1.20 €/L) in order to obtain a
short-term payback of the investment. Only substantial technological improvements can
decrease the ethanol selling price and make the technology a sensible alternative to the EHF
process. Nonetheless, it is important to highlight that the GF process exhibits quite a potential
in electric power generation (significantly more than the EHF process): that could be an
important advantage in countries where electricity is particularly expensive or where power
generation from renewable sources is somehow subsidised (as is the case in many European
countries through the Green Credits scheme). Also note that a potential technological
advantage for the GF process is the use of gasification: although running biomass gasification
in a reliable and consistent way is still a rather complex issue, it is a very flexible technology
(much more than the pre-treatment and hydrolysis steps in the EHF process).
One important index to assess the performance of energy processes is the Energy Return on
Investment (EROI), i.e. the ratio between the gross energy output (ethanol and electricity in
our case) and the gross energy input (farming energy costs, transport, process, etc.) according
60 Chapter 2
to the definition given by Hammerschlag (2006). Although its calculation (and its very
definition) is often very questionable (Mulder and Hagens, 2008), some approximated
estimation (based on the gross energy input suggested by Lynd and Wang, (2004) has been
carried out; an EROI of about 3.8 was obtained for the EHF process, whereas the EROI value
for the GF process was calculated to be equal to 2.6. The EROI values are consistent with the
simulation results and indicate a lower energy efficiency for the GF process.
Chapter 3
Experimental investigation of enzyme adsorption on SO2 steam-pretreated
materials
Lignocellulose hydrolysis is a complex key unit operation in lignocellulosic ethanol:
extensive research has been made to identify the many parameters that determine the rate of
reaction. The rate limiting factors in enzymatic hydrolysis of lignocellulose can be divided in
two main categories. These factors are either related to the substrate or to the enzyme. The
substrate related factors, which have been suggested to impact the process kinetic are
cristallinity, accessible surface area, particle size, lignin distribution. Enzyme related factors
are end-product inhibition, thermal and shear force inactivation, extent of productive and
unproductive adsorption of enzymes. An overview of these different aspects is presented in
the first part of the Chapter1. To tackle the problem in its complexity we decided to focus on
the role of a limited number of parameters. Enzymatic catalysis of cellulose is known to be an
heterogeneous process and enzyme adsorption on the substrate is the key prerequisite
mechanism (Ryu et al., 1984). Enzyme adsorption is a surface phenomenon and hence likely
to be related to substrate morphological features. For this reason we chose to characterize
substrates through their accessible surface area and pores distribution. The essential emphasis
on “real” process substrates led to considerations on the different pretreatment options, which
have a strong impact on the morphological features of the materials: thus the effect of
different pretreatment conditions on two different lignocellulosic substrates (spruce and wheat
straw) has been assessed. Finally the relationship between substrates features and enzyme
adsorption and the final hydrolysis kinetic has been investigated.
1 Portions of this Chapter have been published in Piccolo et al. (2010).
62 Chapter 3
3.1 Enzymatic hydrolysis of lignocellulose
3.1.1 Enzymes related rate limiting factors
The original hypothesis on the mechanism of cellulose hydrolysis by Reese (Reese et al.,
1950; Reese and Mandels 1971; Reese, 1956), involves phenomena of physical disruption of
insoluble cellulose in addition to endo- and exo-acting enzymes. The importance of such
disruption, as well as the cellulase components responsible for it, is still not entirely clear.
Coughlan (1985) used the term “amorphogenesis” to describe physical changes (i.e., swelling,
segmentation, or destratification of cellulose) that enhance enzymatic hydrolysis and render
crystalline cellulose more accessible to cellulase. When cellulase enzyme systems act in vitro
on insoluble cellulosic substrates, three processes occur simultaneously: 1) chemical and
physical changes in the residual (not yet solubilised) solid-phase cellulose; 2) primary
hydrolysis, involving the release of soluble intermediates from the surface of reacting
cellulose molecules; and 3) secondary hydrolysis, involving hydrolysis of soluble
intermediates to lower molecular weight intermediates, and ultimately to glucose.
3.1.1.1 Enzyme mixtures activities
The biochemical analysis of cellulase systems from aerobic and anaerobic bacteria and fungi
has been comprehensively reviewed during the past two decades. Components of cellulase
systems were first classified based on their mode of catalytic action and have more recently
been classified based on structural properties (Henrissat et al., 1998b). Three major types of
enzymatic activities are found: endoglucanases, exoglucanases and β-glucosidases.
Endoglucanases cut at random at internal amorphous sites in the cellulose polysaccharide
chain, generating oligosaccharides of various lengths and consequently new chain ends.
Exoglucanases act in a processive manner on reducing or nonreducing ends of cellulose
polysaccharide chains, liberating either glucose (glucanohydrolases) or cellobiose
(cellobiohydrolase) as major products. Exoglucanases can also act on microcrystalline
cellulose, presumably peeling cellulose chains from the microcrystalline structure (Teeri,
1997). β-Glucosidases hydrolyze soluble oligosaccharides and cellobiose to glucose. The
insoluble, recalcitrant nature of cellulose represents a challenge for cellulase systems. A
general feature of most cellulases is a modular structure often including both catalytic and
carbohydrate-binding modules (CBMs). The CBM effects binding to the cellulose surface,
presumably to facilitate cellulose hydrolysis by bringing the catalytic domain in close
proximity to the substrate, insoluble cellulose. The presence of CBMs is particularly
important for the initiation and processivity of exoglucanases (Teeri et al., 1998a). Revisiting
the original model of cellulose degradation proposed by Reese et al. (1950), a possible
additional noncatalytic role for CBMs in cellulose hydrolysis was proposed: the “sloughing
Experimental investigation of enzyme adsorption on SO2 steam-pretreated materials 63
off” of cellulose fragments from cellulosic surfaces of, e.g., cotton fibres, thereby enhancing
cellulose hydrolysis (Din et al., 1994). Cellulases from aerobic fungi have received more
study than have those of any other physiological group, and fungal cellulases currently
dominate the industrial applications of cellulases (Gusakov and Sinitsyn, 1992; Nieves et al.,
1998; Sheehan and Himmel, 1999).
In particular, the cellulase system of T. reesei has been the focus of research for 50 years
(Mandels and Reese, 1957; Reese, 1956; Reese and Mandels, 1971; Reese et al., 1950). T.
reesei produces at least two exoglucanases (CBHI and CBHII), five endoglucanases (EGI,
EGII, EGIII, EGIV, and EGV), and two β-glucosidases (BGLI and BGLII (Kubicek and
Pentillä, 1998; Nogawa et al., 2001; Takashima et al., 1999). The necessity for the two
exoglucanases (cellobiohydrolases) has been attributed to their particular preferences for the
reducing (CBHI) and nonreducing (CBHII) ends of cellulose chains of microcrystalline
cellulose. This notion has also been supported by the exo-exo synergy observed between these
two enzymes (Henrissat et al., 1985; Medve et al., 1994; Nidetzky et al., 1994a).
Crystallography has elucidated the three-dimensional structures of the two cellobiohydrolases
(Divne et al., 1994; Rouvinen et al., 1990). CBHI contains four surface loops that give rise to
a tunnel with a length of 50 Å; CBHII contains two surface loops that give rise to a tunnel of
20 Å. These tunnels proved to be essential to the cellobiohydrolases for the processive
cleavage of cellulose chains from the reducing or nonreducing ends. The three-dimensional
(3-D) structure of CBHI confirmed that cellobiose is the major hydrolytic product as the
cellulose chain passes through the tunnel. Occasionally, cellotriose or glucose is released
during initial stages of hydrolysis (Divne et al., 1994). The structure of EGI (structurally
related to CBHII) also has been resolved (Kleywegt et al., 1997) to reveal the presence of
shorter loops that create a groove rather than a tunnel. The groove presumably allows entry of
the cellulose chain for subsequent cleavage. A similar groove was shown for the structure of
EGIII (Sandgren et al., 2000), an endoglucanase that lacks a CBM. Cellobiohydrolase activity
is essential for the hydrolysis of microcrystalline cellulose. CBHI and CBHII are the principal
components of the T. reesei cellulase system, representing 60 and 20%, respectively, of the
total cellulase protein produced by the fungus on a mass basis (Wood, 1992). The important
role of CBMs for both enzymes to ensure binding and processivity has been shown clearly
(Palonen et al., 1999). However, both the cellobiohydrolases are very slow at decreasing the
degree of polymerization of cellulose. Endoglucanases are thought to be primarily responsible
for decreasing degree of polymerization by internally cleaving cellulose chains at relatively
amorphous regions, thereby generating new cellulose chain ends susceptible to the action of
cellobiohydrolases (Teeri et al., 1998a). The need for five endoglucanase species in the T.
reesei cellulase system has not been clearly explained, particularly considering that
endoglucanases (with EGI and EGII as major species) represent less than 20% of the total
cellulase protein of T. reesei. Cellobiose, the major product of CBHI and CHBII activity,
64 Chapter 3
inhibits the activity of the cellobiohydrolases and endoglucanases (Holtzapple et al., 1990;
Medve et al., 1998; Mosier et al., 1999). The production of at least two β-glucosidases by T.
reesei facilitates the hydrolysis of cellobiose and small oligosaccharides to glucose. Both
BGLI and BGLII have been isolated from culture supernatants, but a large fraction of these
enzymes remains cell wall bound (Messner et al., 1990; Usami et al., 1990). T. reesei
produces β-glucosidases at low levels compared to other fungi such as Aspergillus species
(Reczey et al., 1998). Furthermore, the β-glucosidases of T. reesei are subject to product
(glucose) inhibition (Messner et al., 1990; Gong et al., 1977; Glick and Pasternak, 1989)
whereas those of Aspergillus species are more glucose tolerant (Decker et al., 2000; Gunata
and Vallier, 1999; Watanabe et al., 1992; Yan and Lin, 1997). T. reesei cellulase preparations,
supplemented with Aspergillus β-glucosidase, are considered most often for cellulose
saccharification on an industrial scale (Reczey et al., 1998; Sternberg et al., 1977).
3.1.1.2 Synergism
Cellulase systems exhibit higher collective activity than the sum of the activities of individual
enzymes, a phenomenon known as synergism. Four forms of synergism have been reported:
(i) endo-exo synergy between endoglucanases and exoglucanases, (ii) exo-exo synergy
between exoglucanases processing from the reducing and non-reducing ends of cellulose
chains, (iii) synergy between exoglucanases and β-glucosidases that remove cellobiose (and
cellodextrins) as end products of the first two enzymes, and (iv) intramolecular synergy
between catalytic domains and CBMs (Din et al., 1994; Teeri, 1997).
Synergism between endoglucanases and cellobiohydrolases has been shown for EGI
(Väljamäe et al., 1998), and EGII (Medve et al., 1998), and EGIII (Nidetzky, 1994a).
However, synergism between endoglucanases has not been clearly demonstrated.
3.1.1.3 Inhibition
The rate of enzyme-mediated hydrolysis of cellulose is inhibited by products of hydrolysis
and is also potentially inhibited by fermentation products if hydrolysis and fermentation are
carried out at the same time. As reviewed elsewhere (Mosier et al., 1999; Philippidis et al.,
1993), cellulose hydrolysis is inhibited by cellobiose and to a much lesser extent by glucose
for cellulase from both Trichoderma spp. and C. thermocellum. β-Glucosidase in T. reesei is
highly sensitive to inhibition by glucose. Whether inhibition by soluble hydrolysis products is
important for microbial cellulose utilization depends on whether such products accumulate in
the microenvironments in which hydrolysis occurs. Inhibition of the hydrolysis rate by
soluble products has been incorporated into a substantial number of models. Competitive
inhibition is the most common mechanism in the literature, but other uncompetitive and
noncompetitive mechanisms have also been proposed (Zhang and Lynd, 2004). Both the
Experimental investigation of enzyme adsorption on SO2 steam-pretreated materials 65
structural information (Davies et al., 1997; Teeri et al., 1998a, 1998b) and a considerable
body of experimental data indicate that individual cellulase enzymes are inhibited
competitively by cellobiose and glucose. However, it appears that mixtures of cellulase
components can exhibit behaviour consistent with mechanisms other than competitive
inhibition under some conditions (Gusakov et al., 1985a, 1985b; Gusakov and Sinitsyn, 1992;
Holtzapple et al., 1984, 1990). The mechanistic basis for this phenomenon is not fully
understood and has received little if any examination in the light of structural information
gleaned during the 1990s.
3.1.1.4 Adsorption
The first step in cellulose hydrolysis is thus the binding of the cellulase enzymes on the
surface of cellulose fibrils. It has been shown that the rate of adsorption is rapid compared to
the actual hydrolytic activity of the enzymes, thus making the amount of adsorbed cellulase
an important factor in the effectiveness of the reaction (Steiner et al., 1988). The mechanism
of enzyme adsorption on pure cellulose has been widely studied, using either purified
enzymes (Medve et al., 1997; Medve et al., 1998; Wood et al., 1989) or commercial mixtures
(van Tilbeurgh et al., 1985; Chanzy and Henrissat, 1985; Henrissat et al., 1985). Enzymes can
bind to the solid surface either specifically or non-specifically, by e.g. hydrogen bonding,
electrostatic or hydrophobic interactions (Brash and Horbett, 1995). Other adsorbed proteins,
as well as low-molecular weight ions in the interfacial region, may affect the adsorption.
Electrostatic forces contribute to the binding, but they do not dominate proteins adsorption in
all conditions (Norde and Haynes, 1995).
Working with 26 cellulase preparations, 10 of them highly purified, Klyosov (1990) showed a
strong correlation between hydrolysis rates and values of the adsorption equilibrium constant.
Quantitative description of the adsorption of cellulase(s) to cellulose generally involves
expressing the concentration of a cellulose-enzyme complex as a function of a vector of
variables relevant to cellulase adsorption that describe the state of the system. In most
adsorption models, such “state variables” include the total amount of cellulase present, the
total amount of substrate present, substrate-specific and enzyme-specific parameters that
impact adsorption (e.g., affinity and capacity), and variables that describe the physical and
chemical environment (e.g., temperature and ionic strength). Experimental determination of
the concentration of cellulose enzyme complex, [CE], is usually carried out by taking the
difference between total cellulase present and unabsorbed cellulase, e.g. for a substrate
containing only cellulose:
[ ]=[ ]-[ ]fCE E E (3.1)
66 Chapter 3
where [E] is the total concentration of binding sites on the enzyme and [Ef] is the
concentration of binding sites on the enzyme not adsorbed to cellulose. Techniques for direct
measurement of adsorbed enzyme would be desirable but are seldom employed (Mansfield et
al., 1999). Equilibrium is assumed in many adsorption models. The equilibrium assumption is
often justified by the observation that the time required for adsorbed cellulase to reach a
constant value is short relative to the time required for hydrolysis. Most studies find that
adsorbed cellulase reaches a constant value in 90 minutes, and many studies have found 30
min to be sufficient (Boussaid and Saddler, 1999; Chernoglazov et al., 1988; Kim et al., 1998,
1994 and 1992, Lee and Woodward, 1989; Ooshima et al., 1983; Rabinovich et al., 1983;
Singh et al., 1991; Strobel et al., 1995; Stutzenberger and Lintz, 1986), whereas complete
hydrolysis of cellulose usually requires a day or more. The simplest representation of
adsorption equilibrium is via an equilibrium constant, Kd:
[ ][ ]
[ ]f
d
E CK =
CE (3.2)
where [C] is the concentration of accessible binding sites on cellulose not adsorbed to
enzyme. Kd, [Ef], [C], and [CE] are taken here to have units of micromoles per litre. Other
internally consistent units can also be used, and the use of units other than micromoles per
litre for Kd is considered below. As an alternative to equilibrium models, some models
(Converse et al., 1988; Nidetzky and Steiner, 1993, Nidetzky et al., 1994b) employ a dynamic
description of adsorption such as
d[ ]
[ ][ ] - [ ]d f f r
CE= k E C k CE
t (3.3)
where kr/kf = Kd.
Studies by Rabinovich et al. (described in Klyosov, 1990) involving various cellulases and
cellulose samples indicate that once a cellulase-cellulose complex is formed, the enzyme stays
bound to the cellulose for a significant period (e.g., 30 min or more), during which hundreds
of catalytic events occur.
3.1.2 Substrates related rate limiting factors
Important substrate parameters affecting enzymes adsorption and the overall hydrolysis
process include the material crystallinity, the accessible surface area, the particle (chip) size
and the lignin distribution (Chang and Holtzapple, 2000; Mooney et al., 1998; Ramos et al.,
1993; Grethlein, 1985; Fan et al., 1980; Fan et al., 1981).
Experimental investigation of enzyme adsorption on SO2 steam-pretreated materials 67
3.1.2.1 Crystallinity Index (CrI)
Crystallinity has often been thought of as providing an indication of substrate reactivity, and
is prominently featured in the model of Wood (1975) as well as in other models. The
crystallinity of dried cellulose samples can be quantitatively measured from the wide-range
X-ray diffraction pattern (Krassig, 1993). Cellulose hydrolysis rates mediated by fungal
cellulases are typically 3–30 times faster for amorphous cellulose as compared to high
crystalline cellulose (Lynd et al., 2002). This observation led investigators in the 1980s to
postulate a model for cellulose structure consisting of amorphous and crystalline fractions
(Fan et al., 1980, 1981; Lee et al., 1983). If this hypothesis were correct, it would be expected
that crystallinity should increase over the course of cellulose hydrolysis as a result of
preferential reaction of amorphous cellulose (Betrabet and Paralikar, 1977; Ooshima et al.,
1983). However, several studies have found that crystallinity does not increase during
enzymatic hydrolysis (Lenze et al., 1990; Ohmine et al., 1983; Puls and Wood, 1991; Schurz
et al., 1985; Sinitsyn et al., 1989). Several treatments that decrease crystallinity also increase
surface area, and it has been suggested that the increased hydrolysis rates observed with
substrates arising from such treatments may be due to increasing adsorptive capacity rather
than substrate reactivity (Caulfield and Moore, 1974; Howell and Stuck, 1975; Lee and Fan,
1982). Comparing the hydrolysis rates on various sources of model cellulosic substrates,
Fierobe et al. (2002) concluded that accessibility of cellulose is a more important factor than
crystallinity index in determining the hydrolysis rate.
3.1.2.2 Degree of Polymerization
The DP of cellulosic substrates determines the relative abundance of terminal and interior h-
glucosidic bonds, and of substrates for exo-acting and endo-acting enzymes, respectively.
Measurement of DP begins with dissolution of cellulose using a technique that does not alter
chain length. DP can be measured with different techniques: membrane or vapor pressure
osmometry, cryoscopy, ebullioscopy, determination of reducing end concentration, or
electron microscopy (Krassig, 1993). The weight average polymerisation degree (DPW) can
be measured based on light scattering, sedimentation equilibrium, and X-ray small angle
scattering, and the viscosity average polymerisation degree (DPV) is measured based on
viscosity. The distribution of DPs among a population of cellulose molecules can be measured
by size exclusion chromatography (Yau et al., 1979). Cellulose solubility decreases drastically
with increasing DP due to intermolecular hydrogen bonds. The DP of cellulosic substrates
varies greatly, from <100 to >15000, depending on substrate origin and preparation.
3.1.2.3 Lignin
Clearly, the composition of the raw material as such will influence the cellulase adsorption.
The removal or redistribution of lignin has been shown to influence the degradability of
68 Chapter 3
lignocellulose substrates (Converse and Optekar, 1993; Lynd et al., 2002). The negative
influence of lignin on enzymatic hydrolysis has several explanations. For a representative
lignocellulosic substrate, cellulases have been found to adsorb both to the cellulosic and lignin
components of the substrate (Sutcliffe and Saddler, 1986). This implies that lignin could have
a negative effect on the hydrolysis, since there would be a competitive unproductive
adsorption of cellulase on the lignin (Sutcliffe and Saddler, 1986; Bernardez et al., 1993;
Ooshima et al., 1990; Eriksson et al., 2002). In addition, it has been suggested that residual
lignin can act as a steric hindrance to cellulolytic enzymes, thus preventing the effective
binding to cellulose chains (Mandfield et al., 1999).
3.1.2.4 Accessibility
The 3D structure of substrate particles (including microstructure) in combination with the size
and shape of the cellulase enzymes under consideration determine whether β-glucosidic bonds
are or are not accessible to enzymatic attack. Cellulosic particles have both external and
internal surfaces. In general, the internal surface area of cellulose is 1–2 orders higher than the
external surface area (Chang et al., 1981), but this is not always the case, for example, in the
case of bacterial cellulose. The internal surface area can be measured by small angle X-ray
scattering (SAXS), mercury porosimetry, water vapor sorption, and size exclusion (Grethlein,
1985; Neuman and Walker, 1992; Stone et al., 1969). The internal surface area of porous
cellulose particles depends on the capillary structure and includes intraparticulate pores (1–10
nm) as well as interparticulate voids (>5 Å) (Marshall and Sixsmith, 1974). Grethlein (1985)
found linear correlations between the initial hydrolysis rate of pretreated biomass and the pore
size accessible to a molecule with a diameter of 51 Å, similar to the size of T. reesei cellulase
components. But the surface exposed to dextran cannot distinguish the specific active
cellulose surface area at which enzymatic hydrolysis occurs from the surface area which is not
a site for enzymatic attack (Chanzy et al., 1984; Gilkes et al., 1992; Lehtio et al., 2003),
resulting in potential overestimation of effective cellulaseaccessible area. External surface
area is closely related to shape and particle size, and can be estimated by microscopic
observation (Gilkes et al., 1992; Henrissat et al., 1988a; Reinikainen et al., 1995; Weimer et
al., 1990; White and Brown, 1981). For example, the external surface area of Avicel is 0.3
m2/g (Weimer et al., 1990). Increasing cellulase adsorption and cellulose reactivity with
decreasing particle size has been reported (Kim et al., 1992; Mandels et al., 1971). However,
this may be due to causes other than increased external area, perhaps decreasing mass transfer
resistance, since external surface is thought to be a small fraction of overall surface area for
most substrates. The gross cellulose accessibility is generally measured by the sorption of
nitrogen, argon or water vapor, dimensional change or weight gain by swelling in water or
organic liquids, and exchange of H to D atoms with D2H. The most widely used procedure for
specific surface area (SSA) is the Brunauer-Emmett-Teller (BET) method using nitrogen
Experimental investigation of enzyme adsorption on SO2 steam-pretreated materials 69
adsorption. Due to variations in the experimental conditions such as adsorption time, vacuum
time and vacuum pressure (Marshall and Sixsmith, 1974), sample preparation (Grethlein,
1985; Lee et al., 1983), and sample origin and features (Marshall and Sixsmith, 1974; Weimer
et al., 1990), a wide range of gross area values have been reported in the literature even for the
same substrate. The typical SSA values for Avicel span the range 1.8–22 m2/g (Fan et al.,
1980; Lee et al., 1983; Marshall and Sixsmith, 1974). Because a nitrogen molecule is much
smaller than cellulase, it has access to pores and cavities on the fiber surface that cellulase
cannot enter. Therefore, there is limited basis to infer that SSA measured using the BET
method is a key determinant of enzymatic hydrolysis rate (Mansfield et al., 1999). Recently,
new semiquantitative procedures (Modified Simons’staining technique and water retention
values measurements) have been developed and effectively used to assess the accessibility of
lignocellulosic substrates (pine) after different pretreatment methods and operating conditions
(Chandra et al., 2008; Chandra et al., 2009).
3.2 Motivations for the experimental investigation
In view of above, it is clear that the pretreatment of lignocellulosic material is an important
step to improve enzymatic hydrolysis of the polymeric carbohydrates into simple sugars,
which is necessary for e.g. conversion of lignocellulose to ethanol or other products by
fermentation. The rate of hydrolysis and the cost of the enzymatic degradation step are still
quite substantial, although much progress has been made in decreasing the cost of enzymes
(Himmel et al., 1999; Gregg et al., 1998). Optimization of pretreatment methods, such as acid
catalyzed steam explosion, is to a large extent done by empirical methods based on direct
measurements of the digestibility of obtained material. An increased understanding of the
desired properties of the pretreated material leading to an efficient enzymatic hydrolysis
would, however, clearly be beneficial, allowing for both new leads for pretreatment
development and a priori predictions of degradability of pretreated materials, and may also
facilitate the development of better enzymes.
Formation of enzyme-cellulose complexes is a prerequisite for cellulose hydrolysis, and such
complexes are a central feature of most conceptual and quantitative models for cellulose
hydrolysis. Enzyme adsorption is therefore a crucial phenomenon and, as it acts as a typical
surface phenomenon, it is likely that surface properties have a huge effect on its mechanism,
rate and extent. Unfortunately, the description of the system and the identification of the
phenomena affecting the process become significantly more complicated as soon as a “real”
lignocellulosic material is treated. In general, there are surprisingly few reports on the effect
of directly measured specific surface area on the hydrolysis rate in lignocellulosic materials
(Grethlein, 1985; Wong et al., 1988; Converse et al., 1990; Sinitsyn et al. 1991; Thompson et
al., 1992). The choice of pretreatment conditions will furthermore most certainly affect the
70 Chapter 3
surface area – and thereby the available surface area for enzyme adsorption - but may also
change the ratio between accessible lignin and cellulose surface areas. The objective of the
study was to investigate enzyme adsorption and hydrolysis of pretreated spruce and wheat
straw and relate these to the morphological effects caused by the treatment. Avicel cellulose
was included in the study as a model substrate. Enzyme adsorption measurements were made
using three different methods; direct protein adsorption measurements by the Bradford
method, assessment of Filter Paper Activity (FPA), which returns a “total” cellulase
adsorption, and assessment of hydroxyethylcellulose (HEC) hydrolysis, which gives a
measurement of adsorbed endoglucanases. The pretreated materials were analyzed for their
carbohydrate and lignin contents, and the total specific surface area and the pore size
distributions were determined using BET. The pretreated materials were also studied using
SEM. The correlation between enzyme adsorption properties, hydrolysis, and the material
morphology is discussed.
3.3 Materials & Methods
3.3.1 Substrates
A comparative study was carried out on seven different substrates: Avicel, taken as substrate
reference, spruce pre-treated at two different conditions and wheat straw pre-treated at four
different conditions. Avicel PH-101 (i.e. microcrystalline cellulose) was purchased from
Fluka. Product number: 11363 (EC No. 2326749. Spruce hydrolyzates were prepared by
steam explosion in a batch reactor with SO2 impregnation at the department of Chemical
Engineering, Lund University using a 10 L reactor (previously described by Stenberg et al.,
1998). Two different pretreatment conditions were used for the same spruce material: a)
temperature 210°C, SO2 content 2.5% (w/w) and residence time 5 min (denoted S1 in the
following), b) temperature 190°C, residence time 10 min, same SO2 content as before (S2).
The first pretreatment condition was chosen based on previous experience to produce a
hydrolyzate, which was well suited for enzymatic degradation without a too large degradation
of formed monomeric sugars from the hemicellulose. Four different pretreatments were
explored for wheat straw. In all cases a sulphuric acid soaking at 0.2% (w/w) was made of the
straw material, which was followed by pretreatment at different conditions. The mildest
conditions were at a temperature of 190°C and residence time of 2 min (denoted WS1 in the
following). The second conditions were at a temperature of 190°C and a residence time of 5
min (WS2). Thirdly a temperature of 190°C, and a residence time 10 min was used (WS3),
and finally a temperature of 210°C with a residence time of 10 min was tested (WS4). In the
case of wheat straw, the conditions which are reported to give the best overall process
performances, i.e. a good enzymatic hydrolysis without a too large degradation of monomeric
Experimental investigation of enzyme adsorption on SO2 steam-pretreated materials 71
sugars from the hemicellulose, are the third conditions (WS3). All pretreated substrates were
washed with distilled water and stored at 4°C. The compositional analysis of the materials
was made using NREL (National Renewable Energy Laboratories) standard procedures
(Sluiter et al., 2008; Ruiz and Ehrman, 1996). The results are reported in Table 3.1 and 3.2,
for the solid and the liquid fraction, respectively.
Table 3.1 Composition of the solid fractions in % on a dry weight basis of the steam pretreated substrates studied. S1 and S2 refer to pretreated spruce material, whereas WS1, WS2, WS3 and WS4 refer to pretreated wheat straw material.
Material WIS
[%]
Glucan
[%]
Mannan
[%]
Xylan
[%]
Galactan
[%]
Arabinan
[%]
AIL
[%]
Spruce, S1 14.9 46.7 1.9 1.6 1.2 1.2 42.0
S2 13.4 48.6 2.9 2.1 1.2 1.2 35.7
Wheat straw, WS1 14.9 37.8 1.8 9.1 0.0 1.7 29.2
WS2 16.0 38.7 0.0 8.2 0.0 1.4 29.2
WS3 13.4 41.4 0.0 1.4 0.0 1.0 32.2
WS4 10.0 47.4 1.5 0.0 0.0 1.1 30.9
AIL = Acid insoluble lignin
Table 3.2 Composition of the liquid fractions obtained after steam pretreatment of the substrates studied. S1 and S2 refer to pretreated spruce material, whereas WS1, WS2, WS3 and WS4 refer to pretreated wheat straw material.
Glucose[g/L ] Xylose g/L ] Galactose g/L ] Arabinose[g/L Mannose g/L ]
Spruce, S1 12.20 8.71 3.21 2.07 19.48
S2 9.17 10.10 3.58 2.38 23.04
Wheat straw, WS1 5.195 46.971 4.931 8.396 0.000
WS2 5.727 48.555 5.139 8.098 0.000
WS3 5.275 41.844 4.465 5.165 1.824
WS4 3.584 18.475 2.216 2.397 1.307
3.3.2 Enzymes
A commercial cellulase mixture (Celluclast 1.5L provided by Novozymes A/S, Bagsvaerd,
Denmark) was used in the experiments. The cellulase enzyme had an activity of 46.8
FPU/mL. No extra β-glucosidase was supplemented in the experiments.
72 Chapter 3
3.3.3 BET measurements
The Brunauer-Emmett-Teller (BET) method - often used for the determination of the specific
surface area of inorganic catalysts - is based on nitrogen adsorption onto the material surface
at different pressures. Surface area, total pore volumes, at a relative pressure of about 0.994,
and pore size distributions were determined on a Micromeritics ASAP 2400 after outgassing
for 10 days at 40°C. Before degassing, the materials were dried. Different drying conditions
were chosen in order to investigate the impact on the biomass structure of the dewatering
process. Some samples were dried for 48 h in an oven at 105°C, whilst other samples were
dried for 5 days at room temperature (20°C). Avicel, stored at room temperature, was not
further dried before degassing.
3.3.4 Adsorption isotherms studies
Adsorption isotherms studies for the pretreated substrates whose BET surface had been
assessed were conducted at a chosen adsorption time of 90 min and at constant temperature
using different enzyme-substrate ratios. It has been widely observed that the time required for
adsorbed cellulase to reach a constant value is short relative to the time required for
hydrolysis. Different concentrations of enzyme solution were added to the substrate in 50 mL
plastic Falcon test tubes at a final dry matter loading of 10 g/L. The pH was adjusted at 4.8 by
addition of NaOH. After 90 minutes of incubation at the selected temperature, the supernatant
was collected, centrifuged for 5 minutes at 3500 rpm and filtered through low protein binding
syringe filters (DISMIC® 10 – 13 CP, Cellulose Acetate, pore size 0.20 μm). The residual
cellulase content or activity in the liquid fraction was assessed using three different assays:
the Bradford method for overall protein content determination, the Filter Paper Activity
(FPA) assay for the overall CBHs and EGs activity, and finally the hydroxyethylcellulose
(HEC) assay for the determination of the endoglucanase activity. The experiments were first
performed at 4°C to avoid changes in substrate properties due to extensive hydrolysis.
Afterwards, a temperature of 30°C, which corresponds to the temperature of the hydrolysis
experiments, was chosen. With concern to the enzyme preparations, we investigated a range
of dilutions between 10% v/v enzyme (5.4 mg protein/ml) to 0.03% v/v enzyme (0.02 mg
protein/ml).
The filtrate was analyzed with the three assays mentioned above, according to the procedures
described by Ghose (1987) and Bradford (1976). The amount of bound cellulase at a given
time point was calculated as the difference between the initial cellulase activity (or protein
concentration) and the measured cellulase activity (or protein concentration) in the liquid
fraction at that time.
Experimental investigation of enzyme adsorption on SO2 steam-pretreated materials 73
3.3.5 Hydrolysis studies
Hydrolysis experiments were performed in 300 mL baffled Erlenmeyer flasks, at a pH value
of 4.8 and a temperature of 30°C, in distilled deionised water, using Avicel, the two
differently pretreated spruce samples, and the four differently pretreated wheat straw samples
as substrates. The WIS (Water Insoluble Solids) content was 10 g/L (i.e. about 1% w/v) and
the total volume was 200 mL. Two different enzyme loads were tested: 2 mL and 0.067 mL,
corresponding to 47 FPU/g WIS and 1.6 FPU/g WIS, respectively. The experiments started by
pipetting the commercial enzyme solutions (Celluclast 1.5) into the substrate solutions. To
ensure proper mixing, the flasks were put in a temperature controlled shaker. The incubation
time was 30 h and samples were withdrawn after 1, 2, 3, 4, 6, 8, 10, 20, 30 h to monitor
hydrolysis. The experiments were carried out without ensuring sterile conditions and without
addition of antibiotics as the incubation time was too short to allow for significant
contamination effects. Duplicates experiments were made in all cases. Each sample was first
centrifuged, than filtered through a small syringe filter (DISMIC® 13 – 13 CP, Cellulose
Acetate, pore size 0.20 μm) to remove particles. The filtrate, without any further pretreatment,
was analyzed by HPLC (Shimazdu, Kyoto, Japan) to measure hydrolysis product (glucose and
cellobiose). The HPLC was equipped with a refractive index detector (RID-10A). The column
was a Biorad Aminex HPX-87P (Hercules, CA, USA) with de-ashing refill cartridges prior to
the main column. The eluent was purified water at a flow of 0.6 mL/min and the temperature
was 85°C. The cellulose conversion, x, was calculated using equation 1:
00.9 0.95 2G+ G
X =C
(3.4)
where [C]0 is the initial cellulose concentration, [G2] is the concentration of cellobiose and [G]
is the concentration of glucose, all in (g/L).
3.3.6 Scanning Electron Microscopy
Pretreated material for SEM were washed with deionized water and then dried at 30°C for at
least 24 h. A sample of each material was mounted on a stub (d = 10 mm) using double-
coated tape. They were then coated with gold in a Balzers SCD004 sputter coater and finally
examined in a JEOL JSM 6700F (FegSEM) microscope, operating at an accelerating voltage
of 5 kV and an average working distance of 8 mm.
74 Chapter 3
3.4 Results
3.4.1 BET measurements of surface area and pore size distribution
Since the first step in hydrolysis will involve an interaction between the endoglucanases and
cellobiohydrolases adsorbing onto the cellulose surface, the specific surface area as well as
the pore size distribution is likely to play a significant role for at least the initial rate of
hydrolysis. The internal surface area of porous cellulose particles depends on the capillary
structure and includes intraparticle pores (1–10 nm) as well as interparticle voids (>5 Å)
(Marshall and Sixsmith, 1974). The pores size distribution is important in determining the
fraction of pores accessible to the enzymes. The pretreated materials as well as the Avicel
material were subjected to BET analysis, providing information about the specific surface
area (Table 3.3) as well as pore size distribution (Figure 3.1).
Table 3.3 Measured specific surface area (SSA) by BET for the seven substrates considered in the study.
Substrate Room temperature
drying [m2/g] Oven drying (105 °C) [m2/g]
Avicel 1.1±0.0 N.A
Spruce, S1 2.0±0.1 2.4±0.1
S2 1.6±0.1 1.2±0.0
Wheat straw, WS1
WS2
WS3
WS4
1.9±0.2
2.1±0.3
2.8±0.2
3.1±0.0
2.5±0.1
3.0±0.3
3.3±0.1
4.1±0.2
N.A. = Not analyzed
*Error of measurement ± 0.9%
Experimental investigation of enzyme adsorption on SO2 steam-pretreated materials 75
10 100 10000
2
4
10 100 10000
2
4
Por
e ar
ea d
A/d
(logD
) [s
q. m
/g] Avicel
S1S2
Pore diameter [A]
WS1 WS2 WS3 WS4
Por
e A
rea
dA/d
(logD
) [s
q m
/g]
Pore diameter [A]
(a) (b) Figure 3.1 Pore area distribution from BET measurements. (a) Pretreated spruce and (b) Pretreated wheat straw.
The pretreated spruce materials, S1 and S2, have rather similar pore size distribution patterns,
with a peak at 80-100 Å (Figure 3.1a), whereas the wheat straw materials have their
maximum at larger pore areas (Figure 3.1b). Avicel is characterized by a more flat
distribution with a weak maximum at 30 Å. The fraction of the total surface accessible to
enzymes for each substrate, assuming a minimum required pore size of 54 Å, was calculated
from the distributions (Table 3.4). With the exception of (untreated) Avicel and the mildest
pretreated wheat straw (WS1), the accessible fraction was relatively similar for the different
materials (about 65% of the total specific surface area).
Table 3.4 Calculated fraction of accessible SSA for the seven substrates considered in the study.
Substrate Room temperature
drying Oven drying (105 °C)
Avicel 0.43 N.A.
Spruce, S1 0.67 0.69
S2 0.64 0.68
Wheat straw, WS1
WS2
WS3
WS4
0.55
0.67
0.67
0.66
0.48
0.60
0.59
0.66
N.A. = Not analyzed
The drying procedure was expected to affect the materials, and to assess the magnitude of
these effects drying at two different temperatures – room temperature and 105 ºC (i.e.
standard oven drying) - were tested for all the pretreated materials (Table 3.3-3.4 and Figure
76 Chapter 3
3.2). The fraction of pores smaller than 200 Å tended to increase of for substrates dried in the
oven, especially for the wheat straw materials (cf. Figure 3.2c-f).
10 100 1000
0
2
4
Dried 20°C Dried 105°C
Por
e ar
ea d
A/d
(logD
) [s
q. m
/g]
Pore diameter [A] 10 100 1000
0
2
4
Po
re A
rea
dA
/d(l
og
D)
[sq
m/g
] Dried 20°C Dried 105°C
Pore diameter [A]
(a) (b)
10 100 10000
2
4
6
Dried 20°C Dried 105°C
Por
e A
rea
dA/d
(logD
) [s
q m
/g]
Pore diameter [A] 10 100 1000
0
2
4
6
Dried 20°C Dried 105°C
Por
e A
rea
dA/d
(logD
) [s
q m
/g]
Pore diameter [A]
(c) (d)
10 100 10000
2
4
6
Dried 20°C Dried 105°C
Por
e A
rea
dA
/d(lo
gD)
[sq
m/g
]
Pore diameter [A] 10 100 1000
0
2
4
6
Dried 20°C Dried 105°C
Por
e A
rea
dA/d
(logD
) [s
q m
/g]
Pore diameter [A]
(e) (f) Figure 3.2 Effect of drying temperature on pore area distribution from BET measurements. (a) S1, (b) S2, (c) WS1, (d) WS2, (e) WS3 and (f) WS4.
Experimental investigation of enzyme adsorption on SO2 steam-pretreated materials 77
3.4.2 Adsorption experiments
Following the determination of surface area characteristics, the adsorption properties of the
materials were assessed. The protein concentration, as well as the hydrolytic activity on
reference substrates (filter paper and HEC) in the liquid phase were determined after
incubation of various amounts of cellulase enzymes with a fixed amount of substrate, giving
the adsorption isotherms - i.e. the relation between the amount of adsorbed enzyme (or
activity) and the amount of added enzyme (or activity) (Figure 3.3-3.5). As to be expected,
the different macromolecular compositions of the substrates spruce and wheat resulted in
qualitatively different adsorption properties of these materials when using the Bradford
protein assay. By comparing the isotherms for Avicel, and the two spruce materials (S1 and
S2) (Figure 3.3a) it can be concluded that the extent of adsorption follows the measured BET
areas. This was also seen for the different wheat straw material (Figure 3.3b).
0 200 400 6000
60
120
180
Avicel S1 S2
[mg
prot
eins
/g W
IS]
Ads
orbe
d
[mg proteins/g WIS] Added
0 200 400 6000
40
80
[mg
pro
tein
s/g
WIS
] A
dsor
bed
[mg proteins/g WIS] Added
WS1 WS2 WS3 WS4
(a) (b)
Figure 3.3 Adsorption isotherms at 4°C using the Bradford protein assay. (a) Pretreated spruce: S1, S2 and Avicel. (b) Pretreated wheat straw: WS1, WS2, WS3, WS4 and Avicel. The standard deviations are given only on one side of the data points in order to facilitate reading. (Note that (a) and (b) have a different y-axis scale)
By comparing the isotherms, based on FPA, it can be concluded that the extent of adsorption
follows the available specific surface area very well with S1 giving higher adsorption than S2
and Avicel, and a consistently positive correlation between adsorption and available specific
surface area for the wheat straw materials. The wheat straws also show higher adsorption than
the spruce materials (Figure 3.4). A different behaviour is, however, seen when the HEC
assay was used. The adsorption isotherm for Avicel is higher than for S2 and most of the
wheat straw materials.
78 Chapter 3
0 200 400 6000
30
60
90 Avicel S1 S2
[FP
U/g
WIS
] A
dded
[FPU/g WIS] Added 0 200 400 600
0
100
200
300 WS1 WS2 WS3 WS4
[FP
U/g
WIS
] A
dded
[FPU/g WIS] Added
(a) (b) Figure 3.4 Adsorption isotherms at 4°C using the FPA assay. (a) Pretreated spruce: S1, S2 and Avicel. (b) Pretreated wheat straw: WS1, WS2, WS3, WS4 and Avicel. The standard deviations are given only on one side of the data points in order to facilitate reading. (Note that (a) and (b) have a different y-axis scale)
In addition, when considering the available specific surface area the pretreated wheat straw
materials have relatively low adsorption compared to the spruce materials and WS1 and WS2
have practically no EG adsorption at all (Figure 3.5). This may be explained by a different
behaviour of the endoglucanases in a lignocellulosic matrix.
0 3000 60000
1000
2000 Avicel S1 S2
[IU
/g W
IS]A
dsor
bed
[IU/g WIS]Added 0 3000 6000
0
800
1600
[IU
/g W
IS]A
dso
rbed
[IU/g WIS]Added
WS3 WS4
(a) (b) Figure 3.5 Adsorption isotherms at 4°C using the HEC assay. (a) Pretreated spruce: S1, S2 and Avicel. (b) Pretreated wheat straw: WS1, WS2, WS3, WS4 and Avicel. The standard deviations are given only on one side of the data points in order to facilitate reading. (Note that (a) and (b) have a different y-axis scale)
Experimental investigation of enzyme adsorption on SO2 steam-pretreated materials 79
The effect of temperature on protein adsorption was investigated by running the adsorption
experiments on S1, S2 and Avicel also at 30°C (Figure 3.6). However, no significant changes
in the amounts adsorbed could be found as a result of different temperature in this study (cf.
Figure 3.7) indicating that the enzyme adsorption can be discussed and related to the
hydrolysis experiments.
0 200 400 6000
60
120
180
[mg
prot
eins
/g W
IS]
Ads
orbe
d
[mg proteins/g WIS] Added
Avicel S1 S2
0 3000 6000
0
1000
2000 Avicel S1 S2
[IU
/g W
IS]A
dso
rbed
[IU/g WIS]Added
(a) (b) Figure 3.6 Adsorption Experiments. Ratio between the amount of enzyme adsorbed vs. the amount of enzyme added for different substrates at 30°C determined through Bradford method (a) and HEC assay (b). The error bar has been reported only below the experimental point to facilitate the reading; obviously, error is symmetrical.
0 200 400 6000
50
100
150
[mg
prot
eins
/gW
IS]A
dsor
bed
[mg proteins/gWIS]Added
30°C 4°C
0 200 400 6000
50
100
150
[mg
prot
ein
s/gW
IS]A
dsor
bed
[mg proteins/gWIS]Added
30°C 4°C
(a) (b)
80 Chapter 3
0 200 400 6000
50
100
150
[mg
pro
tein
s/gW
IS]A
dsor
bed
[mg proteins/gWIS]Added
30°C 4°C
(c)
Figure 3.7 Effect of temperature on the adsorption isotherms for pretreated spruce using the Bradford protein assay. (a) Avicel, (b) S1 and (c) S2. Adsorption experiments were run at 4°C and 30°C.The standard deviations are given only on one side of the data points in order to facilitate reading.
There are conflicting reports on the effect of temperature on the adsorption of cellulases. It
has been observed that an increase in temperature may cause either a decrease (Kim et al.,
1992; Ooshima et al., 1983) or an increase (Kyriacou et al., 1988) in the adsorption of
cellulases. Other studies (Tomme et al., 1990; Lee et al., 1982) have reported only a small
effect of the temperature on the adsorption even when changing the temperature from 4°C to
50°C.
3.4.3 Hydrolysis experiments
Enzymatic hydrolysis studies were performed to assess the relation between the amount of
enzyme adsorbed and the rate of hydrolysis. Glucose and cellobiose concentrations were
measured during the first 30 h of hydrolysis for high (47 FPU/g WIS) (Figure 3.8 and 3.9) and
low (1.6 FPU/g WIS) enzyme dosages (Figure 3.9 and 3.10).
Experimental investigation of enzyme adsorption on SO2 steam-pretreated materials 81
0 10 200
2
4
6
300 10 20 30
0
2
4
6
Glu
cose
Con
cent
ratio
n [g
/L]
Time [h]
WS1 WS2 WS3 WS4
Glu
cose
Con
cent
ratio
n [g
/L]
Time [h]
AvicelS1S2
(a) (b)
Figure 3.8 Sugar release during enzymatic hydrolysis using at high enzyme loading. (a) shows glucose concentration profile, respectively, for S1, S2 and Avicel. And (b) shows glucose concentration profile, respectively, for WS1, WS2, WS3, WS4. The standard deviations are given only on one side of the data points in order to facilitate reading.
0 10 200
1
2
3
30
Cel
lobi
ose
Con
cent
ratio
n [g
/L]
Time [h]
AvicelS1S2
0 10 20
0
1
2
3
30
Cel
lobi
ose
Con
cent
ratio
n [g
/L]
Time [h]
WS1 WS2 WS3 WS4
(a) (b)
Figure 3.9 Sugar release during enzymatic hydrolysis using at high enzyme loading. (a) shows cellobiose concentration profile, respectively, for S1, S2 and Avicel. And (b) shows cellobiose concentration profile, respectively, for WS1, WS2, WS3, WS4. The standard deviations are given only on one side of the data points in order to facilitate reading.
Interestingly, the glucose profiles for Avicel and S1 nearly overlap. The rate of hydrolysis is
significantly lower for the S2 material, in agreement with the specific surface area and
adsorption isotherms. Also for wheat straw, a higher specific surface area gives a higher rate
of hydrolysis although the glucose profiles are close to each other. The conversion after 4 h
82 Chapter 3
(Table 3.5) is higher for S1 than for Avicel and S2, at both high and low enzyme dosage. The
initial reactivity of wheat straw samples is much higher compared to the spruce materials, and
increases from WS1 to WS4, as pretreatment severity increases, in the case of high enzyme
load.
Table 3.5 Cellulose conversion after 4 hours hydrolysis for the seven substrates considered in the study.
Substrate Conversion at high enzyme
dosage [%]
Conversion at low enzyme dosage
[%]
Avicel 19.7 1.9
Spruce, S1 39.6 3.3
S2 15.6 2.3
Wheat straw, WS1 64.2 9.2
WS2 70.9 7.7
WS3 84.0 8.0
WS4 91.8 6.1
The difference in conversion is partly maintained also after 30 h (Table 3.6). However, at the
higher enzyme load the conversion for all the wheat straw substrates is almost complete for
all differently pretreated materials, with the exception of WS1. At the lower enzyme dosage
the conversion is rather similar for the different straw materials, but surprisingly slightly
lower for WS4.
Table 3.6 Cellulose conversion after 30 hours hydrolysis for the seven substrates considered in the study.
Substrate Conversion at high enzyme
dosage [%]
Conversion at low enzyme dosage
[%]
Avicel 37 4.6
Spruce, S1 80 6.7
S2 42 4.0
Wheat straw, WS1 96.8 25.6
WS2 100 24.1
WS3 100 23.6
WS4 100 19.4
Experimental investigation of enzyme adsorption on SO2 steam-pretreated materials 83
0 10 200.0
0.2
0.4
30 0 10 200.0
0.2
0.4
Glu
cose
Con
cent
ratio
n [g
/L]
Time [h]
AvicelS1S2
30
Glu
cose
Con
cent
ratio
n [g
/L]
Time [h]
WS1 WS2 WS3 WS4
(a) (b)
Figure 3.10 Sugar release during enzymatic hydrolysis using at low enzyme loading. (a) shows glucose concentration profile, respectively, for S1, S2 and Avicel. And (b) shows glucose concentration profile, respectively, for WS1, WS2, WS3, WS4. The standard deviations are given only on one side of the data points in order to facilitate reading.
0 10 200.0
0.4
0.8
1.2
30
AvicelS1S2
Cel
lobi
ose
Con
cent
ratio
n [g
/L]
Time [h]
0 10 20 300.0
0.4
0.8
1.2
(a) (b)
Figure 3.11 Sugar release during enzymatic hydrolysis using at low enzyme loading. (a) shows cellobiose concentration profile, respectively, for S1, S2 and Avicel. And (b) shows cellobiose concentration profile, respectively, for WS1, WS2, WS3, WS4. The standard deviations are given only on one side of the data points in order to facilitate reading.
Cel
lobi
ose
Con
cent
ratio
n [g
/L]
Time [h]
WS1 WS2 WS3 WS4
84 Chapter 3
3.4.4 SEM pictures analysis
The pretreated materials were analyzed with SEM to get an appreciation of the morphological
changes. During pretreatment, the natural structures of lignocellulose are broken-up, leaving a
highly heterogeneous solid fraction (Brownell and Saddler, 1987; Donaldson et al., 1988;
Zeng et al., 2007; Kristensen et al., 2008). Several spots were therefore studied in each
material. The results from the SEM analysis illustrate the typical changes in structure of
steam-exploded wheat straw (Figure 3.12) and spruce (Figure 3.13) at different pretreatment
severities. In the wheat straw samples the individual fibres and cell types are partially
separated (Figure 3.12A, D, G and J). Fragments of broken cell-walls also seem to have been
produced to some extent in all pretreatments of wheat straw. At higher magnification the
surface of the individual fibres can be examined (Figure 3.12B, E, H and K). Already at the
mildest pretreatment condition some deposited cell-wall fragments can be seen on the fibres
(Figure 3.12B). However, this gets more accentuated at harsher pretreatment conditions
(Figure 3.12E, H and K). At more severe pretreatment, the outer lignin-rich cell-wall
structures appear to be extensively disrupted, exposing the inner layers of the cell-wall
(Figure 3.12H and K).
Interestingly, harsher pretreatment seems to result in a more porous surface, as seen at the
highest magnification (cf. Figure 3.12C, F, I and L), which has not been illustrated with SEM
before. Possibly, lignin is more extensively re-distributed at more severe pretreatments. At the
highest magnification droplet-like structures can be seen which may be condensed lignin
(Brownell and Saddler, 1987; Donaldson et al., 1988; Kristensen et al., 2008). The uneven
surfaces seen in Figure 3.12I and 3.12L could also be a result of hemicellulose removal since
WS3 and WS4 contain significantly less hemicellulose (Table 3.1). These results agree
satisfactorily with, and may explain, the higher specific surface area from the BET analysis.
Experimental investigation of enzyme adsorption on SO2 steam-pretreated materials 85
Figure 3.12 SEM pictures of pretreated wheat straw. The first, second and third column represents 100X, 5000X and 50000X magnifications, respectively. WS1: (A-C), WS2: (D-F), WS3: (G-I) and WS4: (J-L).
Except from the fiber separation, similar effects of steam-explosion were seen also on the
pretreated spruce materials although the latter materials were even more heterogeneous. In the
spruce samples the most obvious difference between S1 and S2 was the more extensive
rupture and fragmentation in S1 (cf. Figure 3.13A and D). However, Figure 3.13C and F
suggest that the higher specific surface area of S1 may be explained by a higher porosity,
although this was not fully conclusive due to the material heterogeneity.
86 Chapter 3
Figure 3.13 SEM pictures of pretreated spruce. First, second and third columns represent 100X, 5000X and 50000X magnifications, respectively. S1: (a-c) and S2: (d-f).
3.5 Discussion
A fundamental problem in enzymatic lignocellulose conversion, to ethanol or any other
carbohydrate based fermentative product, is the low rate of hydrolysis of the cellulose. A
pretreatment, e.g. steam pretreatment, speeds up this process significantly, most certainly due
to several different effects. From the heterogeneous nature of enzymatic degradation, one
might expect that the increase in specific surface area – and the changed distribution of pore
volume size – brought about by the pretreatment would be important. A higher specific area
should lead to a faster rate of hydrolysis – at least initially – provided that the surface is
indeed accessible to enzyme adsorption. This may not be the case due to either steric
hindrance (e.g. too small pore sizes) or the chemical composition of the free surface area. The
purpose of the study was to simultaneously assess the changes in specific surface area, surface
morphology, enzyme adsorption and enzymatic hydrolysis caused by varying the pretreatment
conditions in SO2 catalyzed steam pretreatment of wheat straw and spruce. Measuring the
specific surface area of this kind of materials is non-trivial. For measurement of the specific
surface area we used the BET method, which is widely used in assessing specific surface
areas of ceramic support material for traditional catalysts. Not only the surface area, but also
the pore area or pore volume distribution can be obtained by this method. A problem when
using BET is that it requires dry samples. By comparing materials dried at different
temperatures in the investigation, it was indeed confirmed that some changes in the material
Experimental investigation of enzyme adsorption on SO2 steam-pretreated materials 87
result from the drying procedure (cf. Figure 3.2 and Table 3.3). The absolute values of the
specific surface areas are therefore not the same as the actual area in real pretreatment
slurries. Solvent drying procedures can be used to better maintain the fine capillary structure
(Grethlein, 1985). However, for the purpose of comparing surface areas from different
pretreatment, the method is useful. BET areas for pretreated spruce and wheat straw have not
been previously reported, to the best of the authors´ knowledge. However, dilute acid
pretreated silvergrass has been assessed using BET and the obtained areas were correlated
with the sugar yield in the pretreatment (Guo et al., 2008). The reported BET areas were in
the same range (1.5 – 4.5 m2/g) as the areas obtained experimentally (Table 3.3). Compared to
when solute exclusion techniques have been used, the BET method results in relatively low
specific surface areas for pretreated lignocellulose. It has however been reported that results
from nitrogen adsorption (dry samples) are proportional to results based on adsorptions of
dyes (wet samples) (Chandra et al., 2008; Yu and Atalla, 1998).
In the current study, a more severe pretreatment was found to give a larger specific surface
area for both spruce and wheat straw (Table 3.3). For wheat straw, the specific surface area
increased with more than 50% from the mildest to the harshest conditions. This was also
illustrated by the SEM study (Figure 3.12 and 3.13) in which cell-walls were ruptured to
different extents, as could be seen already at the lowest magnification, which is in agreement
with previous works (Donaldson et al., 1988 and Kristensen et al., 2008). At the highest
magnification an increased porosity was observed as a result of increased pretreatment
severity, especially in the wheat straw samples (Figure 3.12C, F, I and L). Pore formation has
previously been reported for pretreated softwood (Donaldson et al., 1988), but in a recent
study on pretreated wheat straw these structures were not observed (Kristensen et al., 2008).
Interestingly, the pore size distribution (in the available range) for both spruce and wheat
straw (Figure 3.1) peaks at about the same pore diameter as the pores seen in the SEM
pictures. Thus, the increased porosity at harsher pretreatments, observed by SEM, is possibly
responsible for the higher rates of hydrolysis in these samples. Most likely the specific surface
area would increase even more when increasing the pretreatment severity further, however, at
the expense of degradation of formed monosaccharides from the hemicellulose hydrolysis
(Mosier et al., 2005). A significant degradation of xylose is for instance apparent in the liquid
fraction analysis for WS4 (Table 3.2). The accessible fraction of the surface area (assuming a
pore size > 54 Å is required) increased somewhat between WS1 and WS2, but was then
approximately constant at 65%. The available surface area has been suggested as the most
important factor for the rate of hydrolysis of cellulosic materials (Fierobe, 2002) and positive
correlations between degradability and pore accessibility/pore volume have been reported in
several studies (Grethlein, 1985; Wong et al., 1988; Sinitsyn et al., 1991; Thompson et al.,
1991; Chandra et al., 2008; Weimer et al., 1990; Burns et al., 1989; Grethlein et al., 1984).
Grethlein (1985) obtained a nearly perfect linear relation between available specific surface
88 Chapter 3
area (i.e. above 51Å size pore diameter) and the initial glucose yield for different, dilute acid
pretreated, lignocellulosic materials. Other studies where the initial rate of hydrolysis shows a
positive correlation to the available specific area include Wong et al. (1988) (Pinus radiata),
Thompson et al. (1992) (mixed hardwood) and Sinitsyn et al. (1991) (sugar cane bagasse).
Initial cellulose conversion has also been correlated with the amount of adsorbed dye on
different lignocellulosic materials (Chandra et al., 2008). In addition, kinetic parameters for
the hydrolysing reactions have shown strong positive correlation with specific surface area of
pure cellulose (Lee et al., 1983). It was evident that a larger surface area – for each material -
gave a higher adsorption of cellulase protein as assessed by the Bradford method and also by
the FPA assay (Table 3.3 and Figure 3.3-3.4). However, the difference in material properties
distorted a direct correlation between amounts of adsorbed enzyme and accessible specific
surface area across different materials. A higher total protein adsorption was found for spruce
than for wheat straw, despite a lower accessible specific surface area (cf. Figure 3.3). One
well-known factor, which most likely is highly important here, is the difference in lignin
content (Gharpuray et al., 1983; Schwald et al., 1988). The lignin has been shown to give
unspecific adsorption of cellulase enzymes (Eriksson et al., 2002) and the lower lignin content
of wheat straw (Table 3.1) may therefore affect the adsorption. However, not only the amount
of lignin per se, but also the distribution and composition of the lignin will matter (Mooney et
al., 1998; Wong et al, 1988; Ooshima et al., 1990) which complicates explanation of the
adsorption patterns, especially between the spruce and wheat straw samples. Interestingly, the
HEC assay, which shows binding of endoglucanases, showed virtually no adsorption on either
WS1 or WS2 (Figure 3.5b), although these materials had a high FPA adsorption.
This would indicate a high binding of CBHs, but only little binding of EGs. Previous studies
have shown that the cellulose binding domain of the CenA endoglucanase of Cellulumonas
fimi adsorbs strongly to crystalline cellulose (Gilkes et al., 1992), while the catalytic domain
of CBH has been shown to bind to amorphous regions preferentially (Ståhlberg, 1991). From
this perspective, the different behaviour in the HEC assay may be explained by considering
the different affinity towards crystalline and amorphous fractions by EGs and CBHs,
respectively. An alternative explanation of the different bindings of EGs may be the distinct
variation in xylan content between WS1-2 and WS3-4. CHBs and EGs have been reported to
adsorb differently to also to lignins, which may explain the differences (Palonen et al., 2004).
In line with the FPA analysis, (but in contrast to the total protein adsorption), the initial rate of
hydrolysis (4 hour measurement) is higher for the wheat straw material than for the spruce
(Table 3.5 and Figure 3.8 and 3.9). The hydrolysis experiments show that the Avicel (100%
cellulose) material and S1 (roughly 50% cellulose) behave more similarly than expected
based on the protein adsorption. As discussed above unproductive adsorption on lignin is a
likely explanation for both these observations. Since the hydrolysis rate is proportional to the
extent of the productive binding, the hydrolysis experimental results suggest that S1 and
Experimental investigation of enzyme adsorption on SO2 steam-pretreated materials 89
Avicel exhibit comparable productive surface areas. This result is not surprising if we
consider that, on the one side, S1 has a specific surface area which is about twice that of
Avicel, but on the other hand, only 50% of the total amount of material is cellulose.
Accordingly, only 50% of the total specific surface in S1 is actually “productive”. At the
lower enzyme dosage the hydrolysis pattern of the different materials changes, and the rates
of hydrolysis are no longer clearly related to the specific surface areas (Table 3.5, Figure 3.10
and 3.11). A possible explanation is that at very low enzyme concentration, nearly all the
enzyme is adsorbed to the fibers, and available area becomes unimportant within the range. In
this situation characteristics such as surface composition and lignin distribution would more
strongly affect the hydrolysis. Thus, the fact that Avicel was more readily hydrolysed
compared to S1 could possibly be a result of unproductive binding due to the high lignin
content in S1. In conclusion, this study shows a clear connection between the specific surface
area and the pretreatment severity for the materials studied. This was also illustrated with
SEM. The increased surface area gives, for each substrate, an increased overall protein
adsorption, and gives a higher initial rate of hydrolysis. Not surprisingly, the difference in
chemical composition between wheat, spruce and Avicel prevents a simple comparison
between digestibility based only on the accessible surface area. The surface chemistry in
terms of e.g. binding on lignin and difference in affinity based on crystallinity will necessarily
add to the overall performance.
Chapter 4
Lignocellulose hydrolysis kinetic modelling
Enzymatic hydrolysis is a complex phenomenon. In fact, the full extent of this complexity is not
represented in any quantitative model proposed to date. Depending on the purpose at hand, either
relatively simple or complex models have been reported. In this Chapter1, different adsorption and
hydrolysis models have been reviewed and classified based on the degree of complexity. This
analysis was the starting point to develop a new concept model, characterized, on one hand, by the
same structural patterns whose effectiveness in describing phenomena have been proven in
literature, and, on the other hand, embedding as critical input parameters, experimentally
determined SSA and α, substrate features strongly affecting process, as demonstrated by the
experimental investigation.
Model parameters have been identified and the sensitivity of the main process variables against
different parameters has been assessed. Finally the validity of the model in reproduce experimental
profiles has been tested.
4.1 Quantitative description
The rate of an enzymatic reaction depends on a number of different enzyme and substrate properties
and reaction conditions. An enzymatic reaction is usually divided into several consecutive steps:
adsorption, reaction and desorption. Enzymes are catalysts increasing the reaction rates and/or
making new reaction paths available. In homogenous catalysis the reactant and catalyst are in the
same phase, for example dissolved in a solution.
The homogenous reaction can be described by a first order reaction rate:
[ ]r k S (4.1)
where k is the rate constant and [S] the substrate concentration.
The heterogeneous reaction involves for example a solid substrate and a catalyst in solution. The
reaction rate of this kind of catalysis is often described with a Michaelis-Menten expression, which
is based on the following reaction scheme:
1Portions of this Chapter have been published in Piccolo et al. (2009).
92 Chapter 4
1 2
1
k k
kS E ES E B
(4.2)
The rate of the reaction is described by:
[ ]
[ ]M
k SrK + S
(4.3)
where k is the rate constant and KM is the Michaelis-Menten constant. The Michaelis-Menten
constant is described by:
2
1
M
k kKk
1 (4.4)
where the different k1, k-1, and k2 are the adsorption and desorption rates.
One way of describing k in Eq. 4.1 is to include a Michaelis-Menten dependence on cellulase
concentration [E]:
[ ]
[ ]reac
maxeq reac
E ek kK + E e
(4.5)
where kmax is the maximum specific reaction rate (h-1), ereac is the specific activity of the enzyme
(activity/g of enzyme) and Keq is enzyme saturation constant (activity/L).
However most models for the rate of enzymatic catalysis are based on the mathematical product of
the concentration of the enzyme substrate complex and a proportionality factor relating this
concentration to the reaction rate:
[Cr = k CE] (4.6)
where rC is the cellulose hydrolysis rate (substrate units/[volume*time]) and k is the rate constant, a
proportionality factor between the concentration of the enzyme-substrate complex [CE] and rC
(units as needed for dimensional consistency). An adsorption model is used to describe quantity
[CE].
4.1.1 Adsorption modelling: review
The most common description of cellulase adsorption is the Langmuir isotherm, derived assuming
that adsorption can be described by a single adsorption equilibrium constant and a specified
adsorption capacity. In contrast to Michaelis-Menten, the Langmuir equation does not assume that
the substrate is in excess relative to the enzyme, but takes into account that the substrate can be
saturated with respect to enzyme. The Langmuir isotherm may be represented as:
Lignocellulose hydrolysis kinetic modelling 93
1max P f
aP f
W K EE =
+ K E (4.7)
in which Ea is the adsorbed cellulase (mg or μmol cellulase/L), Wmax is the maximum cellulase
adsorption = (AmaxS) (mg or μmol cellulase/L), Amax is the maximum cellulase adsorption per g
cellulose (mg or μmol cellulase/g cellulose), S is cellulose concentration (g cellulose/L), Ef is free
cellulase (mg or μmol cellulase/L), and KP is the dissociation constant (KP=Ea/(Ef S)) in terms of
L/g cellulose. Lynd et al. (2002) present in their wide review about the microbial cellulose
utilization, a compilation of values of adsorption parameters for cellulases isolated from different
microorganism and for diverse substrates. In addition to equilibrium adsorption models, a dynamic
adsorption model has been used by some investigators (Converse et al., 1988; Converse and
Optekar, 1993; Nidetzky and Steiner, 1993; Nidetzky et al., 1994c). The Langmuir equation is
widely used because in most cases it provides a good (and often very good) fit to the data, and it
represents a simple mechanistic model that can be used to compare kinetic properties of various
cellulase–cellulose systems. However it is evident that cellulase binding does not comply with
assumptions implicit in the Langmuir model due to one or more of the following: 1) partially
irreversible cellulase adsorption (Palonen et al., 1999); 2) interaction among adsorbing cellulase
components, especially at high concentrations (Jeoh et al., 2002); 3) multiple types of adsorption
sites, even for one cellulase molecule (Linder and Teeri, 1997; Carrard and Linder, 1999); 4)
cellulase entrapment by pores of cellulose (Lee et al., 1983); and 5) multicomponent cellulase
adsorptions in which each component has different constants (Beldman et al., 1987). In light of
these considerations, several equilibrium models representing alternatives to simple Langmuir
adsorption have been proposed, including two-sites adsorption models (Linder et al., 1996; Medve
et al., 1997; Stålhberg et al., 1991; Woodward et al., 1988a), Freundlich isotherms (Medve et al.,
1997), and combined Langmuir Freundlich isotherms (Medve et al., 1997).
4.1.2 Hydrolysis modelling: review
Quantitative description of cellulose hydrolysis is useful in different stages of processing of
biomass to fermentable sugars. They span the entire domain of operations, namely enzyme
characterization and modification, substrate preparation, reactor design, and optimization of
operational policies.
There are two types of modelling approaches, empirical and mechanistic modelling. Empirical
models relate the factors using mathematical correlations, without any insight into the underlying
mechanism. These are easy to develop and useful in enzyme characterization and substrate
preparation. Mechanistic models are developed from the reaction mechanisms, mass transfer
considerations and other physical parameters that affect the extent of hydrolysis. As these models
address the underlying dynamics of the process, they can be extensively used in every stage.
Mechanistic models vary in their complexity based on the intended use of the models. These
94 Chapter 4
models are quite useful in describing the reaction mechanisms, mass transfer considerations and
other physical parameters that affect the extent of hydrolysis
4.1.2.1 Empirical models
Nonmechanistic models in the literature provide correlations for either fractional conversion or the
rate of reaction as a function of various factors. Factors incorporated into models with conversion as
the output include enzyme loading and substrate concentration (Sattler et al., 1989) as well as
pretreated biomass properties (Chang and Holtzapple, 2000; Gharpuray et al., 1983; Koullas et al.,
1992). Factors incorporated into models with rate as the output include hydrolysis time (Karrer et
al., 1925; Miyamoto and Nisozawa, 1945), enzyme loading (Miyamoto and Nisozawa, 1945), and
cellulose conversion (Ooshima et al., 1982). A few nonmechanistic models are considered here by
way of example. Nonmechanistic models developed prior to the early 1980s are considered in detail
in the reviews of Lee et al. (1980) and Ladisch et al. (1981). An example of a model with
conversion extent as an output is that proposed by Gharpuray et al. (1983). Those authors used
regression to develop an exponential model to describe the influence of characteristics of pretreated
wheat straw on the conversion of cellulose X measured after 8 h:
0.998 0.257 -0.3882.044( ) (100 ) ( )X = SSA - CrI L (4.8)
in which SSA is measured by BET, and L is residual lignin content. Their results indicated that an
increase in surface area and a decrease in the crystallinity and lignin content enhance hydrolysis,
with specific surface area as the most influential of the structural features, followed by the lignin
content. Chang and Holtzapple (2000) reported a model to correlate maximum conversion in
relation to residual lignin, crystallinity index, and acetyl content. They found that lignin content and
CrI have the greatest impact on final conversion, whereas acetyl content had a smaller effect.
Koullas et al. (1992) also attempted to relate maximum conversion with CrI and degree of
delignification, and obtained a similar conclusion about CrI and lignin effects. Sattler et al. (1989)
developed the following equation to describe final fractional conversion after enzymatic hydrolysis
of pretreated poplar in relation to cellulase loading:
0 0
[ ]
[ ] [ ] [ ]maxYY =
C C K + EE
(4.9)
where Y/[C]0 gives the fraction of substrate hydrolyzed; [E] is given in FPU/g initially added
substrate (FPU/g substrate); and Ymax/[C]0 is the fraction of substrate which could maximally be
hydrolyzed at an infinite enzyme loading, i.e., maximum digestibility. Later, Adney et al. (1994)
applied this model to describe hydrolysis of cellulose such as Sigmacell 50 and various pretreated
wood-powders. An example of a model with reaction rate (V) as an output is that proposed by
Holtzapple et al. (1984c):
Lignocellulose hydrolysis kinetic modelling 95
2max
1/2 max
(X - X)V =t X
(4.10)
where Xmax is the maximum conversion, X is conversion, and t1/2 is the time after which is reached
0.5*Xmax. Prompted by the observation that rate declines with increasing conversion, Ooshima et al.
(1982) proposed the relationship:
d
d
V kVX (4.11)
where V is the hydrolysis rate and X is conversion.
4.1.2.2 Mechanistic Models
Zhang and Lynd (2004) reviewed in detail the works concerning the modelling of cellulose
hydrolysis and pointed out that most of the proposed models for the design of industrial systems fall
in the category of mechanistic models, i.e. models taking into account the substrate concentration or
one of the enzymatic activities as a state variable. These models meet the requirement of including
the minimum of necessary information for the description of the process. Mechanistic models can
be used for data correlation but also for reactor design and identification of important
characteristics. These models are based on the reaction paths shown in Figure 4.1.
Cellulose Cellobiose r1
Glucose r3 r2
Figure 4.1 Hydrolysis reaction rates.
Some models only include reaction r3, i.e. the direct path from cellulose to glucose; others also
consider the intermediate cellobiose and thus include reactions r1 and r2 as well. Reactions r1 and r3
are examples of heterogeneous catalysis reactions and thus the reaction rates are described by Eq.
4.6; r2, which is a homogenous reaction, is described by Eq. 4.1. The two equations (4.1 and 4.6)
are the foundation in all mechanistic models but they have been modified to describe different
aspects, such as end-product inhibition, changed substrate reactivity and enzyme deactivation, into
account.
Mechanistic models with respect to substrate and enzyme are based on an adsorption model but use
a single variable to describe the state of the substrate and describe the action of cellulase in terms of
a single solubilizing activity. A representative model in this category is the HCH-1 model developed by Holtzapple et al. (1984a, 1984b), which describes the initial rate of hydrolysis by:
96 Chapter 4
[ ][ ]
( [ ] [ ]
k S E iV =+ S +e E )
(4.12)
in which k is a rate constant; φ, a lumped affinity constant; e, the number of cellulose sites covered
by an adsorbed enzyme molecule, and i the fraction of total enzyme which is not inhibited by
product. The quantity i represents inhibition by glucose [G] and cellobiose [G2] according to:
1/(1 [ ] [ ] )I1 2 I2i G /K + G /K (4.13)
in which KI1 and KI2 are inhibition constants. This model was used to simulate a total of 50 different
hydrolysis conditions with a 10-fold range in enzyme concentration and a 30-fold range in cellulose
concentration. Agreement with experimental data was rather good, and appeared better than some
older models (Howell and Stuck, 1975; Huang, 1975).
Mechanistic models with respect to enzyme only involve variables in addition to concentration to
describe the state of the substrate. The widely observed trend of declining rate with increasing
conversion appears to be a central motivation for many models in this category. Models describing
an assumed change in shape and surface area over the course of hydrolysis have been proposed
(Converse and Grethlein, 1987; Converse et al., 1988; Luo et al., 1999; Oh et al., 2001; Philippidis
et al., 1992, 1993). However, none of these models have been tested against experimental data to
our knowledge.
Several ‘‘two-substrate’’ models have been proposed that partition cellulose into a less reactive
highly crystalline fraction, and a more reactive amorphous fraction (Fan and Lee, 1983; Gonzalez et
al., 1989; Gusakov et al., 1985a,b; Nidetzky and Steiner, 1993; Peitersen and Ross, 1979; Ryu and
Lee, 1982; Scheiding et al., 1984). Although such models have met with some success in terms of
correlating data, the trend of increasing CrI with increasing conversion—which would be expected
if amorphous cellulose in fact reacts first—has not been conclusively confirmed by experimental
data. An example of a two-substrates model is that of Wald et al. (1984), which includes shrinking
cellulose spheres with an amorphous shell and a shrinking core as well as inhibition of cellulose
hydrolysis by cellobiose and liquid-phase hydrolysis of cellobiose by h-glucosidase with inhibition
by glucose.
The NREL has funded projects concerning the modelling of biomass-to-ethanol conversion as in the
case of continuous SSF of wood performed by South et al. (1995). This study was based on the
experimental data obtained in a previous work of these same authors using commercial fungal
cellulases (South et al., 1993). In this study, a kinetic model considering the cellulose conversion,
the formation and disappearance of cellobiose and glucose, the formation of cells and the
biosynthesis of ethanol, was structured. In addition, a Langmuir- type model taking into account the
adsorption of cellulases on the solid particles of cellulose and lignin, and expressions describing the
dependence of cellulose conversion on the residence time of non-soluble solid particles of biomass
were considered.
Lignocellulose hydrolysis kinetic modelling 97
This last description confers great validity to the model since it provides a better approximation to
real processes, which cannot be suitably explained by the traditional models for CSTR considering
soluble substances.
South et al. (1995) used a conversion-dependent rate constant to account for declining specific
activity of cellulase–cellulose complexes over the course of hydrolysis:
( ) 1nk X k X c (4.14)
Those authors found an empirically determined value of n equal to 5.3, indicative of the very strong
decline in rate with increasing conversion and in general agreement with direct specific activity
measurements (Nutor and Converse, 1991; Ooshima et al., 1991).
Mechanistic models with respect to substrate (only) involve concentration as the only substrate state
variable and two or more solubilizing activities. Examples of models in this category are based on
endoglucanase and exoglucanase. Nidetzky et al. (1994b) described saturation of the hydrolysis rate
in terms of the concentration of a particular cellulase component, Ei, as follows:
( )i
ii max
E i
EV E =VK + E
(4.15)
in which i is either 1 (for exoglucanase) or 2 (for endoglucanase), and KEi is a half-saturation
constant. Based on this relationship, the following equation was proposed for the rate of hydrolysis
in the presence of both exoglucanase and endoglucanase:
1 2 1 2
1 21 2 1 2 ,
2 2 1
( , ) ( ) ( ) syn maxE E E E
E EV E E V E V E VK K K E K E E E
2
(4.16)
in which Vsyn,max is the maximum synergistic hydrolytic rate, and K1,K2 were the half-saturation
constants corresponding to enzyme 1 and 2 in binary combination. The experimental results and
model prediction clearly showed that the optimal ratio of exoglucanase to endoglucanase is a
function of the total cellulase concentration, with higher enzyme concentrations needing less
endoglucanase to achieve the maximum synergistic effect. The model of Beltrame et al. (1984)
accounts for exoglucanase, endoglucanase, and β-glucosidase on textile cotton and cellulose pulp at
various temperatures. The variable values can be adjusted depending on experimental conditions to
fit experimental data well. About half of the mechanistic models cited by Zhang and Lynd (2004)
are based on the Michaelis–Menten model, which is valid when the limiting substrate is in excess in
relation to the enzyme (Lynd et al., 2002). In light of the small fraction of β-glucosidic bonds
accessible to enzymatic attack, this condition is particularly limiting for cellulosic substrates.
Excess substrate may be achieved in fundamentally oriented work, e.g., to characterize specific
activity under laboratory conditions, but is seldom achieved in applications involving cellulose
hydrolysis. Models based on a Langmuir adsorption model do not implicitly assume excess in either
98 Chapter 4
enzyme or substrate, and thus have a considerably broader range of potential application. Although
adsorption models other than the Langmuir model have been proposed, few have been incorporated
into kinetic models that lead to a prediction of hydrolysis rate. Inhibition of the hydrolysis rate by
soluble products has been incorporated into a substantial number of models. Competitive inhibition
is the most common mechanism in the literature, but other uncompetitive and noncompetitive
mechanisms have also been proposed. Both the structural information (Davies et al., 1997; Teeri et
al., 1998a,b) and a considerable body of experimental data indicate that individual cellulase
enzymes are inhibited competitively by cellobiose and glucose. However, it appears that mixtures
of cellulase components can exhibit behaviour consistent with mechanisms other than competitive
inhibition under some conditions (Gusakov et al., 1985a, 1985c; Gusakov and Sinitsyn, 1992;
Holtzapple et al., 1984b, 1990). The mechanistic basis for this phenomenon is not fully understood
and has received little if any examination in the light of structural information obtained during the
1990s.
4.1.2.3 Functionally and structurally based models
A few functionally based models, involving multiple substrate variables and solubilizing activities,
have been proposed in the literature. Moo-Young and co-workers (Okazaki and Moo-Young, 1978;
Suga et al., 1975) developed models based on the Michaelis-Menten model and assuming that all β-
glucosidic bonds are accessible that incorporated two solubilizing activities (endoglucanase and
exoglucanase) as well as β-glucosidase. In addition, these investigators used concentration and DP
as substrate variables. The model predicts (Suga et al., 1975) that substrate DP changes as a
function of time in the presence of endoglucanase, and that exoglucanase and endoglucanase
synergism occurs for the degradation of longer chain cellulose molecules. Later, the model of
Okazaki and Moo-Young (1978) predicted that the degree of endo-exo synergism is strongly
impacted by DP. Converse and Optekar (1993) considered competitive adsorption of exoglucanase
and endoglucanase for a limited number of sites, and, using surface area as a substrate state
variable, predicted a lower degree of synergism under oversaturating conditions— that is, when
cellulase is in substantial excess relative to the substrate, due to competitive adsorption. Fenske et
al. (1999) used virtual DP and surface area as substrate state variables in addition to concentration
to give insights into inhibition of cellulase activity by insoluble substrates. In the case of three of
the four functionally based models listed (Fenske et al., 1999, Okazaki and Moo-Young, 1978, Suga
et al., 1975), no comparison to experimental data has been made. Converse and Optekar (1993)
compared model results to a single set of experimental data with a focus exclusively on synergism.
Recently Zhang and Lynd (2006) have proposed a new functionally based model representing the
action of three different enzymes (CBHI, CBHII and EGI) and incorporating two measurable and
physically interpretable substrate parameters: the degree of polymerisation (DP) and the fraction of
β-glucosidic bonds accessible to cellulase Fa (Zhang and Lynd, 2004). However the applicability of
the model is limited by the fact that currently there is no rational basis to estimate some of the
parameters included.
Lignocellulose hydrolysis kinetic modelling 99
Finally, models based on structural features of cellulase components and their interaction with their
substrates are termed “structurally based models”. To a much greater extent than models in other
categories, structurally based models are useful for molecular design as well for developing an
understanding on the relationship between cellulase structure and function. Derivation of
meaningful kinetic models based on structural models cannot be done at this time, and awaits major
advances in the general field of inferring protein function from structure.
4.1.3 Declining rate
Although initial rates are often used for biochemical characterization, it is of interest from both
fundamental and applied perspectives to understand and describe the enzymatic hydrolysis of
cellulose over the entire course of reaction. A near-universal feature of cellulose hydrolysis
observed in many studies over several decades is that the rate declines sharply as the reaction
proceeds (corresponding to increasing values of X) in a batch hydrolysis. Measurements of rate in
conjunction with adsorbed enzyme (Desai and Converse, 1997; Nutor and Converse, 1991;
Ooshima et al., 1991) confirm that the phenomenon of declining rate with increasing conversion is
observed on a specific (rate per adsorbed enzyme) as well as on an absolute basis. Enzyme
inactivation due to thermal effects (Caminal et al., 1985; Gonzàles et al., 1989; Converse et al.,
1988), formation of an inactive enzyme-substrate (lignin) complex (Gusakov and Synitsyn, 1992;
Ooshima et al., 1990; Sutcliffe and Saddler, 1986), and inhibition by hydrolysis products (Caminal
et al., 1985, Gusakov et al., 1985; Lee and Fan, 1983) have been implicated as important factors
underlying the decreasing-rate phenomenon. However, it is significant to observe that this
phenomenon has been documented in studies in which neither inactivation nor inhibition appears
operative (Väljamäe et al., 1998; Zhang et al., 1999). Several studies have attributed declining rates
of hydrolysis to a corresponding change in substrate reactivity. One subset of these studies
postulates two types of cellulose that differ in their susceptibility to enzymatic attack (Gonzàles et
al., 1989; Huang, 1975; Nidetzky and Steiner, 1975; Pietersen and Ross, 1979; Sattler et al.,1989;
Wald et al., 1984). While this “two-substrate” hypothesis cannot be rejected based on the literature
to date, it also appears that the difference between the more reactive and less reactive substrate
fractions is attributable primarily to factors other than crystallinity. If this difference were due to
crystallinity, then cellulose crystallinity should increase over the course of reaction. However,
relatively constant crystallinity over the course of enzymatic hydrolysis has been observed in
studies involving a variety of cellulase systems (Dermoun and Bélaich, 1988; Fan et al., 1980;
Gama and Mota, 1997; Lee et al., 1983), although such crystallinity measurements may be due to
artifacts (Weimer et al., 1995). A second subset of studies feature a continuous decline in substrate
reactivity rather than two distinct substrate types. Working with pretreated poplar and the T. reesei system, Nutor and Converse (1991) found that the rate of cellulose hydrolysis per adsorbed
cellulase decreased monotonically by 1 to 2 orders of magnitude over the course of reaction. The
model proposed by South et al. (1995) Eq. 4.14 represents this declining specific activity of the
cellulase-cellulose complex over the course of simultaneous saccharification. Working with purified
100 Chapter 4
cellulase components from T. fusca, Zhang et al. (1999) concluded that substrate heterogeneity
causes the nonlinear kinetics exhibited during hydrolysis of filter paper whereas product inhibition
and enzyme inactivation were rejected as explanations for this phenomenon. The explanation of
Ooshima et al. (1991) is that synergistic interaction between cellulase components becomes less
effective with increasing conversion. Väljamäe et al. (1998) attribute the rate decline to steric
hindrance due to nonproductive cellulose binding in combination with surface erosion.
Most kinetic models do not consider the changes in the hydrolysis rate during the course of the
reaction, and that those models that do this, are based mainly on empirically adjusted parameters
and not on a mechanistic approach. For instance, the model of SSF process developed for the case
of unpretreated wastepaper using commercial cellulases and S. cerevisiae for both batch and two-
stage continuous regimes (Philippidis and Hatzis, 1997) made use of an exponential decay term to
describe the time-dependent decline in the rate of cellulose hydrolysis. With the help of an
exhaustive sensitivity analysis, the model showed the digestibility of substrate (as a result of
pretreatment), cellulase dosage, specific activity, and composition have a great effect on ethanol
yield. This confirms that major research efforts should be oriented to the development of more
effective pretreatment methods and production of cellulases with higher specific activity.
4.2 Modelling approach
4.2.1 Adsorption model
The focus of the study was not to propose a new phenomenological adsorption model but rather to
present a model structure which can be properly identified, given the actual information potential of
experimental data.
Accordingly, the structure of the Langmuir equation, which is widely used because it provides a
good (or often very good) fit to experimental data and represents a simple mechanistic model that
can be used to compare kinetic properties of various cellulase–cellulose systems, was maintained.
Specific surface areas and a measure of pore accessibility were embedded in the model.
1
max P fa
P f
W K EE =
+ K E (4.17)
Variables and parameters on Eq. 4.17 are thus changed as follows: Ea is the adsorbed cellulase (mg
cellulase/g WIS); Wmax is the maximum cellulase adsorption (mg cellulase/g WIS) defined as:
( )max maxW A SSA (4.18)
with Amax the maximum cellulase adsorption/m2 on the substrate (mg cellulase/m2 substrate), SSA
the substrate specific area (m2/g WIS) and α is the fraction of pores accessible to enzyme as
Lignocellulose hydrolysis kinetic modelling 101
calculated from pores size distribution; Ef is the free cellulase (mg cellulase/L); and KP is the
dissociation constant.
4.2.2 Hydrolysis model
The adsorption model has been embedded in an overall hydrolysis model. Referring to the three
reaction rates reported in Figure 4.1 the model consist of the material balances:
1 3
dC = -r - rdt
(4.19)
31.111 1.053dG = rdt
2r (4.20)
11.0562dG r rdt
2 (4.21)
Where C, G, G2 are the concentration [g/L] of cellulose, glucose and cellobiose, r2 is the
homogeneous reaction rate expressed through a Michaelis-Menten scheme (Eq. 4.22):
2
22
M 2
k Gr
K G
(4.22)
where KM is the Michaelis-Menten constant [g/L] and k2 is the lumped specific rate constant,
proportional to the effective β-glucosidase concentration:
*2 2 gk k e E (4.23)
where k2* is the specific cellobiose hydrolysis rate [g/(IU*h)], E is the amount of enzyme
supplemented [g] and eg is the specific β-glucosidase activity of the enzyme supplemented [IU/g].
r1 and r3 are heterogeneous reaction rates expressed as:
[ ] , 1,i ir k EC C i 3 (4.24)
in which ki is a kinetic constant, [EC] is an appraisal of the productive binding [mg proteins/g WIS],
based on experimental evidences. As discussed in Chapter 3, a comparable hydrolysis rate was
observed for Avicel and S1 which suggested that S1 and Avicel exhibit comparable productive
surface areas. Since S1 has a specific surface area which is about twice that of Avicel, but on the
other hand, only 50% of the total amount of material is cellulose, then only 50% of the total specific
surface in S1 is actually “productive”. Based on these speculations we considered reasonable to
express the extent of productive binding as a function of cellulose fraction fC.
[ ] a CEC E f (4.25)
where Ea is calculated through the Langmuir modified equation (Eq. 4.17) and fC is the current
cellulose fraction.
102 Chapter 4
Overall substrate conversion is given by the conversion X:
00.9 0.95 2G+ GX =
C (4.26)
where [C]0 is the initial cellulose concentration.
Table 4.1 summarises the parameters and the variables that appear in the model.
Table 4.1 Parameters and variables of hydrolysis kinetic model.
Model parameters Model variables
Amax Maximum cellulase adsorption
KP Dissociation constant
k1 Kinetic constant
k3 Kinetic constant
k2* Specific cellobiose hydrolysis rate
eg Total β-glucosidase activity of the enzyme
KM Michaelis-Menten constant
SSA Substrate Specific surface area
α Fraction of accessible surface
fC Cellulose fraction
C Cellulose concentration
G2 Cellobiose concentration
G Glucose concentration
E Enzyme concentration
Ea Bound enzyme concentration
[EC] Concentration of the enzyme-cellulose
complex
r1 Reaction rate
r2 Reaction rate
k2 Lumped kinetic constant
r3 Reaction rate
X Conversion
Before the model can be used to simulate and optimise the operation of the reactor, all parameters
that appear in it must be assigned a fixed value. Some of these, namely SSA, α, fC and eg are
considered as input parameters information and are experimentally determine. The remaining
parameters should be identified through an estimation procedure, using experimental data.
As the experimental investigation described in Chapter 3 did not take into account β-glucosidase
supplementation and activity, the available experimental data provide no information about the
specific enzyme kinetic. For this reason we decided to assume for parameters k2*
and KM the values
from Philippidis et al. (1993).
Eventually the subset of parameters we aimed at identifying was:
1 3[ , , , ]P maxk k K A
Lignocellulose hydrolysis kinetic modelling 103
4.3 Model identification
The model implementation, simulation and identification, based on statistical methods, are
performed in gPROMS® 3.2 modelling environment (Process System Enterprise Ltd., 2009).
The value of kinetic parameters were estimated using experimental data. Adsorption experiments
and different sets of batch hydrolysis data were examined. The model equations were used to search
parameters values by fitting experimental data. A nonlinear parameter identification procedure
based on the criteria of maximum likelihood was employed.
The model equations 4.17-4.26 represent a non linear system of differential and algebraic equations
(DAE) which can be written as:
(4.27) ( , , , ) 0
( , )
f tg
x x θ
y x θ
Here x is the vector of states variables, t is the time, θ represents the vector of model parameters, y
is the concentration vector that encompasses cellobiose and glucose.
Parameters estimation attempt to determine values for the uncertain physical and variance model
parameters, θ, that maximize the probability that the mathematical model will predict the
measurement values obtained from the experiments. Assuming independent, normally distributed
measurement errors, εijk, with zero means and standard deviations, σijk, the maximum likelihood
goal can be captured through the following objective function:
22
21 1 1
ˆ( )1ln(2 ) min [ln( ) ]
2 2
iji NMNVNEijk ijk
ijki j k ijk
y yN
Φ (4.28)
where N is the total number of measurements taken during all the experiments, NE is the number of
experiments performed, NVi is the number of variables measured in the ith experiment, NMij is the
number of measurements of the jth variable in the ith experiment, σijk is the variance of the kth
measurement of variable j in experiment i (this is determined by the measured variable's variance
model), is kth measured value of variable j in experiment i and yijk is kth predicted value of
variable j in experiment i. ˆ ijky
The maximum likelihood objective function gives the flexibility for several types of variance model
to be specified by the user.
gPROMS® allows defining three different variance models:
a constant variance model, in which the measurement error has a constant standard
deviation ω.
2 2 (4.29)
104 Chapter 4
a constant relative variance model in which the measurement error depends on the
magnitude of the predicted or measured values, mathematically represented respectively by:
2 2 2(y )
)
(4.30)
or
2 2 2ˆ(y (4.31)
a heteroscedastic variance model in which the measurement error depends on the measured
or predicted values but is proportional to yγ/2 or / 2y , respectively 2 2 2( )y (4.32)
or
2 2 2ˆ(y ) (4.33)
Where ω is a proportionality factor, γ is the heteroscedasticity parameter, ε is a very small but non-
zero number calculated by the software, which ensures that the variance has a meaningful definition
for measured or predicted values that are close or equal to zero.
As the estimation of the parameters and the statistical analysis of the results depend strongly on the
given or estimated standard deviations of the measurement errors, attention should be paid to the
formulation of the variance model and the values of the respective variance model parameters.
4.3.1 Parameters estimation run
Given the the highly specific behaviour of different biomass substrates detected during
experimental activity, a direct correlation between amounts of adsorbed enzyme and accessible
specific surface area across different materials. For this reason the set of model parameters
1 3[ , , , ]P maxk k K A
have been specifically estimated for each substrate taken into account.
The variance model which reasonably reproduces the variance of experimental data is a constant
relative variance model with ω equal to 0.1.
The mean value of different parameters resulting from the parameters estimation session together
with different measures of the uncertainty of the parameters estimates are reported in Table 4.2 for
pretreated spruce model and in Table 4.3 for wheat straw model.
Lignocellulose hydrolysis kinetic modelling 105
Table 4.2 Results of the parameters estimation run and statistical significance for pretreated spruce model [tref=1.6499].
Parameter Optimal Estimate 95% CI 95% t-value Standard Deviation
k1 0.001199 0.000065 18.5178 0.000033
k3 0.002961 0.000137 21.5999 0.000070
KP 0.000267 0.000057 4.7351 0.000029
Amax 203.61 32.47 6.2715 16.47
Table 4.3 Results of the parameters estimation run for pretreated wheat straw model [tref=1.6499].
Parameter Optimal Estimate 95% CI 95% t-value Standard Deviation
k1 0.004582 0.000386 11.8668 0.000196
k3 0.006150 0.000137 14.0015 0.000223
KP 0.001751 0.000486 3.6028 0.000247
Amax 50.60 6.47 7.8253 3.29
The 95% confidence intervals (CI) are reported. A 95% confidence region means that if we repeat
the experiments and estimate the parameters out of the repeated experimental data, the value of the
estimated parameters will lie in the confidence region with a 95% probability. The smaller the
confidence intervals, the more accurate is the parameter estimate. Each parameter reported in Table
4.2 and 4.3 presents a CI sufficiently low to consider the parameter, statistically identifiable.
The 95% t-values show the percentage accuracy of the estimated parameters with respect to the
95% confidence intervals. The t-values associated to each parameter θi are compared with the
reference 95% t-value, which is again calculated using internal statistical functions. A t-value larger
than the reference t-value indicates that the corresponding parameter has been accurately estimated
(i.e. the standard deviation and the confidence intervals are small compared to the value of the
estimated parameter. 95% t-values higher than the reference value are associated to the estimates
provided for the parameters set of each material considered, with a lower absolute value for
parameters Amax and KP. The identifiability methodology is fulfilled with an analysis of the sensitivity of the model variables
to the parameters, used to screen parameters significance and detect issues of correlation between
parameters.
106 Chapter 4
4.3.2 Sensitivity Analysis
Parametric sensitivity analysis studies how variation in the model output can be apportioned to the
variation of different parameters.
Absolute sensitivity index of the jth parameter can be given as:
,i
a ijj
yQ
(4.34)
The individual parameter sensitivity indices are estimated over the whole experiment time horizon.
Relative sensitivity to parameters (Eq. 4.35) is useful to compare different parameters dynamic
profiles, because it is normalized and clearly shows where maxima and minima occur for different
sensitivity coefficient.
,ji
r ijj j
yQsc
(4.35)
where scj is the scaling factor for the parameter θj (in this case as scaling factors is assumed the
maximum value of Qa,ij in the time horizon considered).
A 1% variation of the estimated value has been considered for each parameter.
The dynamic sensitivity coefficient profiles obtained for S1 are reported in Figure 4.2 and 4.3 and
for WS3 in Figure 4.4 and 4.5 calculated for a high (2mL) enzyme load hydrolysis experiment.
0 10 20
-1.2
-0.6
0.0
30
k1
k2
KP
Amax
Qa,
1
Time [h]
0 10 20-0.5
0.0
0.5
1.0
30
k1
k2
KP
Amax
Qr,
1
Time [h]
(a) (b)
Figure 4.2 Absolute (a) and relative (b) sensitivity dynamic coefficients of glucose concentration for S1 hydrolysis, calculated at the estimated values of parameters.
Lignocellulose hydrolysis kinetic modelling 107
0 10 20-0.5
0.0
30
k1
k2
KP
Amax
Qa,
2
Time [h]
0 10 20-0.5
0.0
0.5
1.0
30
k1
k2
KP
Amax
Qr,
2
Time [h]
(a) (b)
Figure 4.3 Absolute (a) and relative (b) sensitivity dynamic coefficients of cellobiose concentration for S1 hydrolysis, calculated at the estimated values of parameters.
Even with some differences between different profiles calculated, a high correlation between KP and
Amax is clearly observed. In the case of S1 hydrolysis kinetic constant k1 strongly affects glucose
concentration and, on the other hand, the cellobiose is more dependent on k3. Sensitivity
coefficients dynamic (easily traceable in the case of relative sensitivities) is similar for three (k3, KP,
Amax) over four parameters for Qr,1 (glucose concentration sensitivity to parameters), with the
maximum reached at the end of the experiment, and is similar for k1, KP, Amax in the case of Qr,2
(cellobiose concentration sensitivity to parameters), with a maximum reached at about 10 hours
from the beginning of the experiment. These observations can be useful to re-design more
informative experiments, since they provide hints to optimise sampling intervals.
108 Chapter 4
0 10 20-9
-6
-3
0
30
k1
k3
Kp
Amax
Qa,
1
Time [h] 0 10 20
0.0
0.5
1.0
30
k1
k3
Kp
Amax
Qr,
1
Time [h]
(a) (b)
Figure 4.4 Absolute (a) and relative (b) sensitivity dynamic coefficients of glucose concentration for WS3 hydrolysis, calculated at the estimated values of parameters.
0 10 20-1
0
1
2
3
30
Qa,
2
Time [h]
k1
k3
Kp
Amax
0 10 200.0
0.5
1.0
30
k1
k3
Kp
Amax
Qr,
2
Time [h]
(a) (b)
Figure 4.5 Absolute (a) and relative (b) sensitivity dynamic coefficients of cellobiose concentration for WS3 hydrolysis calculated at the estimated values of parameters.
Glucose and cellobiose concentration in WS3 hydrolysis are strongly impacted by adsorption
parameters KP and Amax which show the same high correlation observed for S1. Parameters k3, KP
and Amax present the same dynamic profile, with a maximum reached by Qr,1 at about 10 hours and
by Qr,2 at about 25 hours.
Lignocellulose hydrolysis kinetic modelling 109
4.3.3 Model riparametrisation
The preliminary sensitivity analysis showed a strong correlation between the adsorption parameters
KP and Amax. This means that any change in one parameter could be compensate by a change in the
other one, hence making it extremely difficult to find a unique estimate for these correlated
parameters. This correlation stems for the model structure itself (Sin et al., 2009, Okazaki and Moo-
Young, 1978, Gan et al., 2003, Kadam et al., 2004). There are several ways to reduce the
correlation: 1) modify the model structure, 2) increase the information content of experimental data
by proper design of experiments, and 3) search for a parameter subset that can be reliably estimated
from the given data (Sin et al., 2009). In this study we tried to doodge parameters identification
procedure choosing a different set of parameters for the estimation procedure.
We introduced a new parameter:
max PP A K (4.36)
and we estimated the new parameters set:
1 2[ , , , ]Pk k K P
The mean value of the estimated parameters as well as the 95% confidence intervals (CI), 95% t-
value and parameters standard deviation are shown in Table 4.4 for spruce model and in Table 4.5
for wheat straw model.
Statistical significance indexes are still satisfactory, as for the original parameters set, and the
uncertainty of the estimate of the new parameter P for pretreated spruce model is reduced if
compared to the original estimated parameter Amax, as testified by the higher 95% t-values. The
improvement is not visible for wheat straw model parameters estimation.
Table 4.4 Results of parameters estimation run and statistical significance for spruce [tref=1.6499].
Parameter Optimal Estimate 95% 95% t-value Standard Deviation
k1 0.001199 0.000066 18.271948 0.000033
k3 0.003003 0.000138 21.727068 0.000070
KP 0.000246 0.000053 4.620340 0.000027
P 0.053691 0.003356 15.999185 0.001702
110 Chapter 4
Table 4.5 Results of parameters estimation run and statistical significance for wheat straw [tref=1.6499].
Parameter Optimal Estimate 95% 95% t-value Standard Deviation
k1 0.004893 0.000437 11.190040 0.000222
k3 0.006579 0.000506 13.011238 0.000257
KP 0.001256 0.000342 3.676676 0.000174
P 0.074812 0.013173 5.679266 0.006693
As a second step of the identificability analysis, the sensitivity analysis was performed to evaluate
parameters collinearity. Absolute and relative dynamic sensitivity coefficients were calculated for a
1% variation of the estimated values of parameters. The calculated profiles, obtained in the
conditions of a high (2mL) enzyme load hydrolysis experiment, for S1 are reported in Figure 4.6-
4.7 and for WS3 in Figure 4.8-4.9.
0 10 20-1.5
-1.0
-0.5
0.0
0.5
30
k1
k3
Kp
P
Qa,
1
Time [h]
0 10 200.0
0.5
1.0
30
k1
k3
Kp
P
Qr,
1
Time [h]
(a) (b)
Figure 4.6 Absolute (a) and relative (b) sensitivity dynamic coefficients of glucose concentration for S1 hydrolysis, calculated at the estimated values of parameters.
Lignocellulose hydrolysis kinetic modelling 111
0 10 20-0.5
0.0
0.5
30
k1
k3
Kp
P
Qa,
2
Time [h]0 10 20 30
-1
0
1
k1
k3
Kp
PQr,
2
Time [h]
(a) (b)
Figure 4.7 Absolute (a) and relative (b) sensitivity dynamic coefficients of cellobiose concentration for S1 hydrolysis, calculated at the estimated values of parameters.
0 10 20-1.5
-1.0
-0.5
0.0
0.5
30
k1
k3
Kp
P
Qa,
1
Time [h]
0 10 20 300.0
0.5
1.0
k1
k3
Kp
P
Qr,
1
Time [h]
(a) (b)
Figure 4.8 Absolute (a) and relative (b) sensitivity dynamic coefficients of glucose concentration for WS3 hydrolysis, calculated at the estimated values of parameters.
112 Chapter 4
0 10 20-1.0
-0.5
0.0
0.5
30
k1
k3
Kp
P
Qa,
2
Time [h]
k1
k3
Kp
P
(a) (b)
Figure 4.9 Absolute (a) and relative (b) sensitivity dynamic coefficients of cellobiose concentration for WS3 hydrolysis, calculated at the estimated values of parameters.
A general positive effect of riparametrization can be observed: parameters collinearity is strongly
reduced for both the spruce and the wheat straw materials. Except for the sensitivity dynamic
coefficients of glucose concentration in S1 hydrolysis, presenting three parameters (k1, k3, P)
characterized by the same dynamics, the other coefficients show a quite distinctive dynamic with
maxima and minima distributed during the whole time duration of the experiment.
4.3.4 Correlation matrix
Consideration on parameters collinearity can be done also through the analysis of correlation matrix
R where Rij are given by:
, ijij
ii jj
VR i j
V V (4.37)
1, =ijR i j (4.38)
Where Vij and Vii are calculated from the variance-covariance matrix V. This matrix contains the
variances and covariances of the estimated process model and variance model parameters. The
square root of each diagonal element, iiV , is the approximated standard deviation of the respective
estimated parameter. The following approximation to the variance-covariance matrix is used:
1* T
*V H ΓΣΓ H-1
0 10 20 300.0
0.5
1.0
(4.39)
k1
k3
Kp
P
Qr,
2
Time [h]
where
Lignocellulose hydrolysis kinetic modelling 113
2 2
2,
2 2
2, ,
i j
i j i j
*
Φ Φθ θ
H
Φ Φθ
(4.40)
2
, ,
2
, , ,
ˆ
ˆ
i j k
i j k i j
y
y
Φθ
Γ
Φ
(4.41)
and 2( ijkdiag )Σ denotes the variance-covariance matrix of the measurement errors (Φ is the
maximum likelihood objective function defined in Eq. 4.28). The variance-covariance matrix of the
estimated parameters, V, is of size p pN N , where Np is the number of all estimated parameters
(process model parameters θ and variance model parameters, ω and γ) whose values do not lie at
one of their respective lower or upper bounds.
Rij coefficient with absolute value close to one in the off-diagonals indicate a high correlation of the
corresponding parameters i and j, and vice versa. The correlation matrix for the original parameters
set estimated in the case of spruce materials is shown in Table 4.6.
It can be noticed that a high absolute value of the pair of parameters in the correlation matrix is
associated to the high correlation between Kp and Amax, observed with the preliminary parameters
sensitivity analysis.
Table 4.6 Correlation matrix for the original set of parameters.
ParameterParameter Number 1 2 3 4
Amax 1 1.0000 0.3992 0.5527 -0.9809
k1 2 0.3992 1.0000 0.5340 -0.4821
k3 3 0.5527 0.5340 1.0000 -0.6420
KP 4 -0.9809 -0.4821 -0.6420 1.0000
Correlation matrix calculated for the new set of parameters (Table 4.7) shows the positive effect of
riparametrisation: correlation coefficients between KP and P are still quite high but less critical than
the values reported for the original set of parameters.
114 Chapter 4
Table 4.7 Correlation matrix for the new set of parameters.
Parameter Parameter Number 1 2 3 4
k1 1 1.0000 0.5306 -0.4815 -0.6010
k3 2 0.5306 1.0000 -0.6480 -0.7583
KP 3 -0.4815 -0.6480 1.0000 0.8713
P 4 -0.6010 -0.7583 0.8713 1.0000
4.4 Data fitting
Model predictive capabilities have been evaluated against experimental data. Data fitting is
presented in Figure 4.10-4.11. It appears that the model, as structured still exhibit some issues. If,
on the one side, the most critical glucose concentration is usually estimated quite satisfactorily
(particularly with wheat straw as in Figure 4.11a-d), the representation of the cellobiose dynamics
can be represented only in a qualitative way (especially for S1, WS1 and WS4). It appears that in
general exists a faster cellobiose initial dynamics, which the model is unable to grasp. The
phenomenon is more emphasized for substrates treated at the most harsh pretreatment conditions
(S1 and WS3-4). A possible explanation is the formation of a fraction of soluble cello-
oligosaccharides which is easily converted to cellobiose during the initial hydrolysis stage.
0 10 200
2
4
30
Con
cent
ratio
n [g
/L]
Time [h]
G2_exp G2_pred G_exp G_pred
0 10 20 3
0
2
4
0
Con
cent
ratio
n [g
/L]
Time [h]
G2_exp G2_pred G_exp G_pred
(a) (b)
Figure 4.10 Comparison between cellobiose (G2) and glucose (G) experimental and predicted profiles for S1 (a) and S2 (b).
Lignocellulose hydrolysis kinetic modelling 115
0 10 200
2
4
30
Con
cent
ratio
n [
g/L
]
Time [h]
G2_exp G2_pred G_exp G_pred
0 10 20
0
2
4
30
Con
cent
ratio
n [g
/L]
Time [h]
G2_exp G2_pred G_exp G_pred
(a) (b)
0 10 200
2
4
30
Con
cent
ratio
n [
g/L
]
Time [h]
G2_exp G2_pred G_exp G_pred
0 10 20
0
2
4
30
Con
cent
ratio
n [g
/L]
Time [h]
G2_exp G2_pred G_exp G_pred
(c) (d)
Figure 4.11 Comparison between cellobiose (G2) and glucose (G) experimental and predicted profiles for WS1 (a), WS2 (b), WS3 (c), WS4 (d).
The limited predictive potential is to ascribe to the oversimplification of model structure performed
in order to tackle identification issues which affect more complex models, which in several studies
resulted over-parameterised with respect of available experimental data (Sin et al., 2009; Kadam et
al., 2004; Gan et al., 2003).
116 Chapter 4
4.5 Discussion
Starting from the observations on the effect of pretreatment on the morphologic properties of
lignocellulosic materials a model for the enzymatic hydrolysis of lignocellulosic materials has been
developed. Specific surface area and the fraction of pores accessible to enzyme, experimentally
determined, have been embedded as critical input parameter into a modified Langmuir-type
adsorption model. Successively the adsorption model has been included in a three reactions
hydrolysis model, based on two heterogeneous reaction rates and a Michaelis-Menten type kinetic.
Parameters estimation procedure have been carried out aiming at identifying a subset of parameters
(the heterogeneous reactions kinetic constant and the adsorption isotherm parameters) for each of
the two substrates considered in the experimental investigation, pretreated spruce and pretreated
wheat straw.
The identification procedure provides a set of mean values of estimated parameters as well as the
uncertainty of the parameters estimated represented as 95% confidence intervals, 95% t-value and
parameter standard deviation. All the parameters are found to have satisfactory statistical
significance, with limited confidence bands and standard deviation and 95% t-value higher than the
reference value.
However the correlation matrix as well as a preliminary parameters sensitivity analysis put on
evidence the strong correlation between the isotherm adsorptions parameters. For this reason we
chose to estimate a new parameter P defined ad the product of the adsorption model parameters
Amax and Kp. The riparametrisation was successful and a new set of new mean values with good
statistical significance have been provided. The correlation matrix and the parameters sensitivity
analysis showed a decrease in the correlation between the parameter of the new set.
Model fitting to experimental data have been evaluated; however the model capability at
representing the cellobiose profile is still quite poor. A likely explanation is the limited number of
parameters of the model which disregards fundamentals phenomena such as change in substrate
reactivity during hydrolysis, end product inhibition, enzyme deactivation, the impact of substrate
morphological features other than the specific surface area. However several studies (Sin et al.,
2009; Kadam et al., 2004; Gan et al., 2003) report identification issues for increasing number of
parameters, due to the strong correlation between fundamentals parameters that we have already
experienced in a very simple model such as the one proposed.
It should be emphasized that more research needs to be done to overcome these identificability
issues. For these models to be reliable for process design purposes, the focus on issues such as
identification analysis and model structure redefinition are fundamental topics in future research.
.
.
Conclusions and perspectives
There is an increasing interest in many countries in the use of fuel ethanol from renewable biomass
as a replacement of fossil fuels for the consideration of environment and energy security.
Lignocellulosic biomass is considered one of most promising feedstock for production of fuel
ethanol due to its global availability and environmental benefits of its use. Consequently wide
varieties of processes for the production of ethanol from lignocellulosic biomass are studied and are
currently under development.
For the first time, within this work, two of the most promising process routes for the production of
lignocellulosic ethanol, namely the EHF and the GF process, have been compared on the basis of
their techno-economic performances.
The final evaluation shows that production costs of fuel ethanol, for both technologies assessed, are
still higher than gasoline production costs, although there is a strong influence of factors as the
prices of oil and feedstock for ethanol production.
Furthermore some unresolved issues, common to both process options and still hindering their
commercialization, have been pointed out:
- further biotechnological advancements are needed to engineer both feedstock and
microorganisms utilized in biological steps in order to maximise yields and decrease the cost
of enzymes production (EHF process).
- there are design, optimization and scale up problems especially for bioreactors which
involve multiphase systems, for the pre-treatment step in EHF process and for the gasifier in
the GF process. The problems are emphasized if continuous systems need arranging:
biomass has no fixed composition and at the state of the art it is impossible to control the
quality of the products coming out the different conversion steps. The development of faster and
more reliable methods for biomass composition measurements is another obstacle to tackle.
- there is a need for disposal of energy intensive unit operations, such as distillation in favour
of systems such as pervaporation and membrane technologies.
Integrations opportunities should also be explored as a possible approach for reducing investment
costs and for improvements of the economic competitiveness of lignocellulosic ethanol production:
integration between different unit operations within the same process, integrations between the two
different technologies considered and integration between first generation and second generation
fuel ethanol processes. Valuable co-products production, other than electricity, should be assessed
in a biorefinery perspective, since a better utilization of all substrates fractions and all residues
streams increases the revenues and improve the overall economics.
A deeper and aggregated understanding of the EHF process has been achieved through the
experimental investigation and the kinetic modelling of lignocellulose hydrolysis step. The effect of
pretreatment severity on the morphological properties of the substrate was measured in terms of the
118 Conclusions and perspectives
BET surface area and pore size distribution. Another result of the experimental activity is the highly
specific behaviour of different biomass substrates since peculiarities in material properties distort a
direct correlation between amounts of adsorbed enzyme and accessible specific surface area across
different materials. Given the correlation between the specific surface area, the extent of adsorption
and the rate of hydrolysis for a specific substrate (pretreated spruce materials and pretreated wheat
straw materials), we found reasonable to embed the specific surface area as a critical parameter of a
new concept adsorption model. The model was then included in a simple deterministic model of
lignocellulose hydrolysis and was identified through experimental data.
Despite its simplicity the model shows an acceptable agreement with experimental data and can be
used in further studies to optimize enzyme loads, substrate concentration, and identify some optimal
feeding and operational policies.
We acknowledge that many phenomena which are known to impact cellulose hydrolysis are not
considered in the model as reported here. Further model improvement could envisage the
incorporation of, for instance, competitive or synergistic adsorption, changes in the specific surface
area during the course of hydrolysis, products inhibition, cellulase deactivation. Finally, the
presence of lignin and hemicellulose give rise to important multiple effects which need to be further
investigated and then considered from a modelling point of view. However, as model complexity
increases, identificability issues arise and a trade-off between the incorporation of vital information
with respect to the reaction mechanism and the unnecessary complication of the model equations
should be advocated.
The integration of a kinetic model of enzymatic hydrolysis process with a model of substrates
pretreatment step is an important objective for future research, as these steps are the most cost-
effective operations in EHF process. A deeper understanding of the effect of different operational
variables on biomass degradability and on the final rate of hydrolysis could facilitate the design of
optimal pretreatments with a positive effect on the overall process economics.
References
Aden, A., M. Ruth, K. Ibsen, J. Jechura, K. Neeves, J. Sheehan, B. Wallace (2002) Lignocellulosic
biomass to ethanol processing design and economics utilizing co-current dilute acid
prehydrolysis and enzymatic hydrolysis for corn stover. Technical Report NREL/TP-510-
32438. National Renewable Energy Laboratory , Golden, CO (U.S.A.).
Aden, A., P. Spath and B. Atherton (2005). The potential of thermochemical ethanol via mixed
alcohols production. Milestone Completion Report of National Renewable Energy Laboratory,
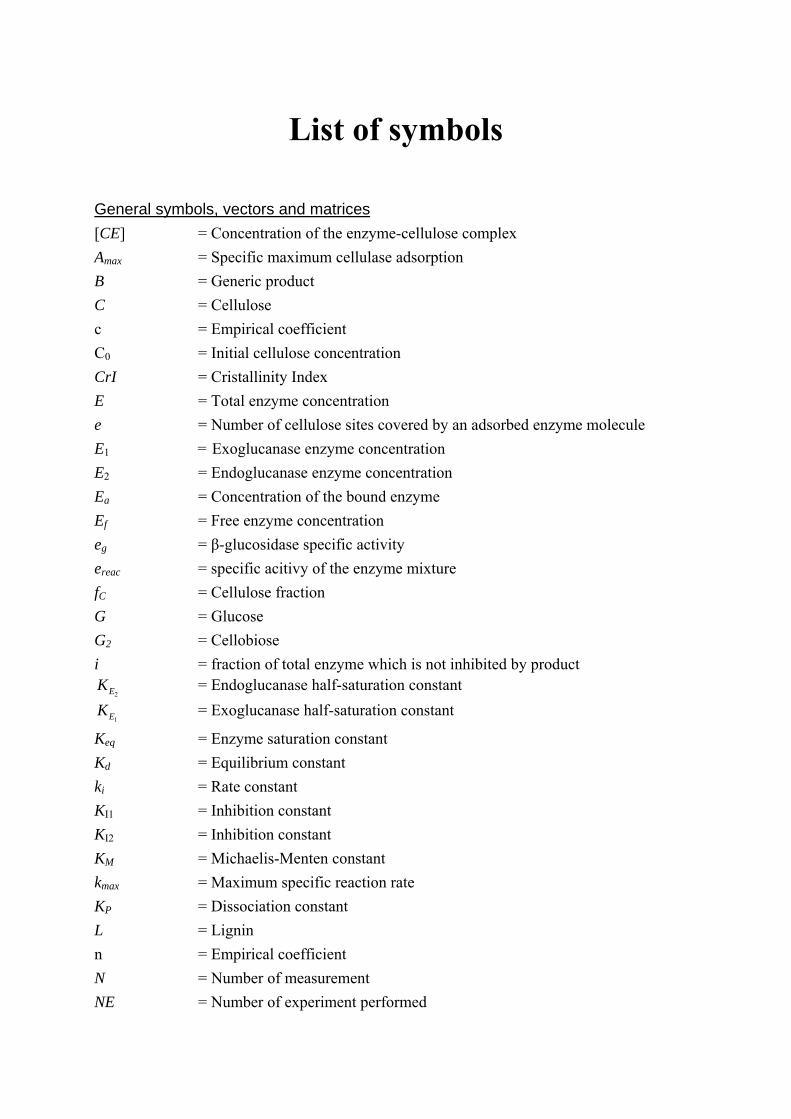
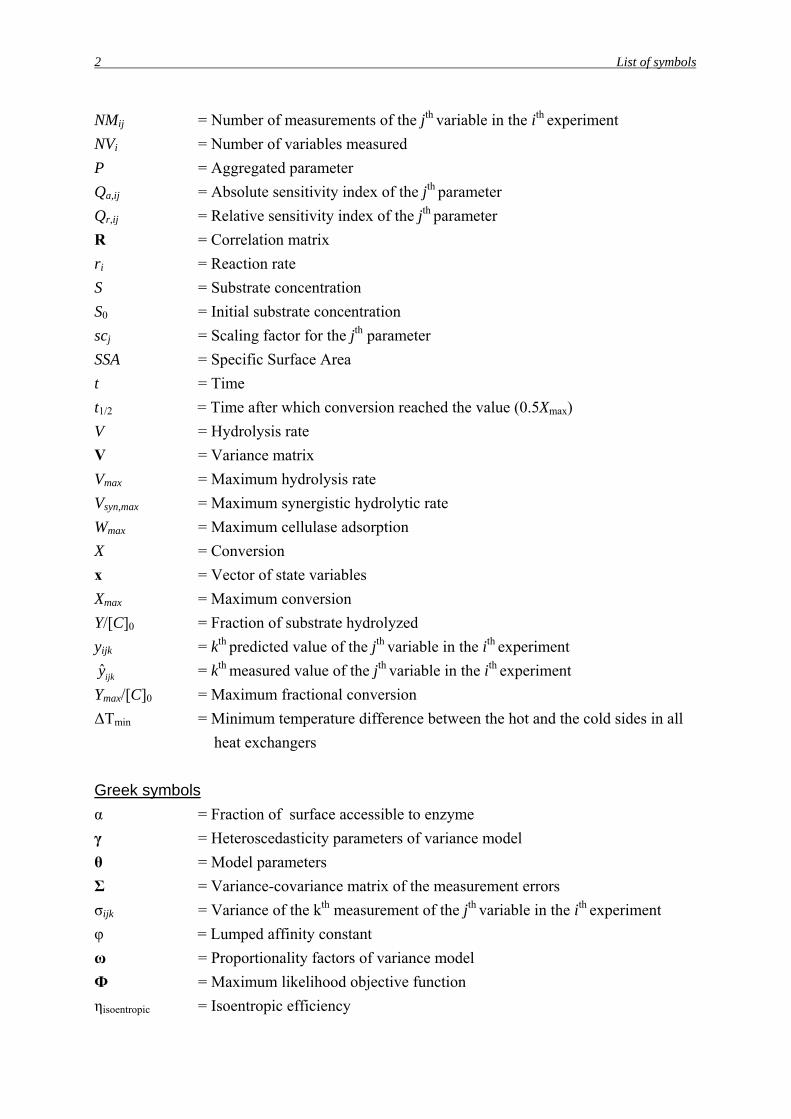
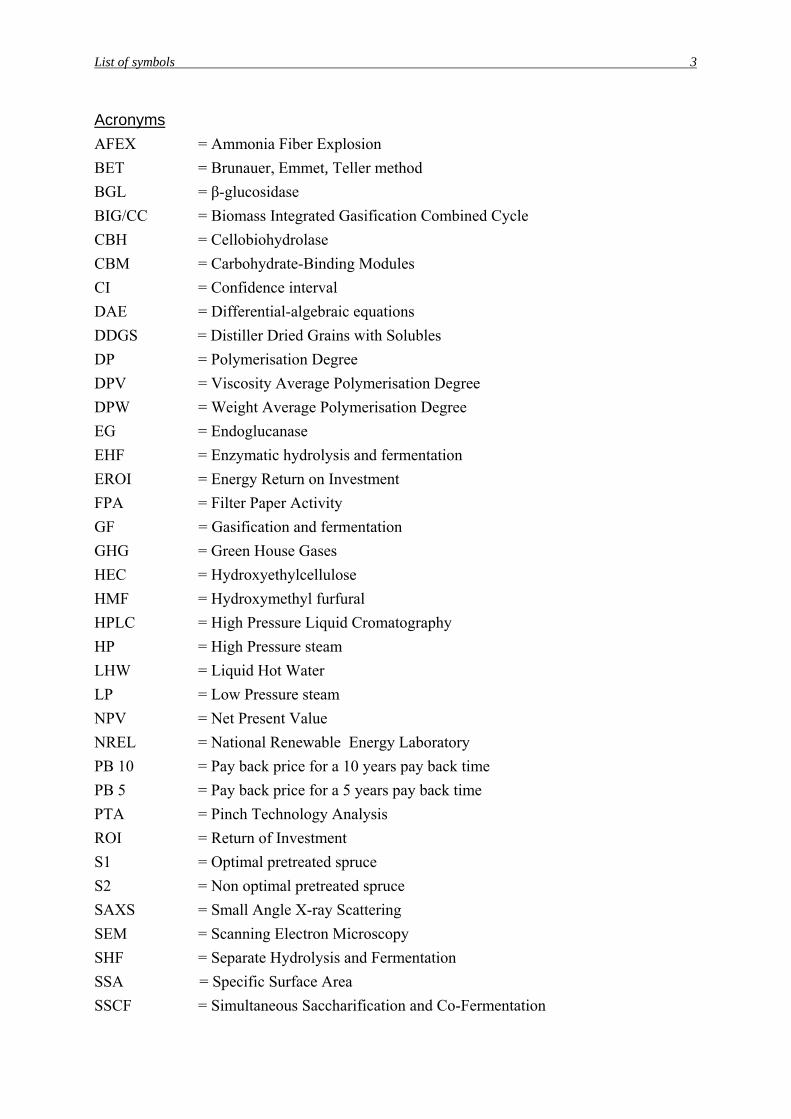
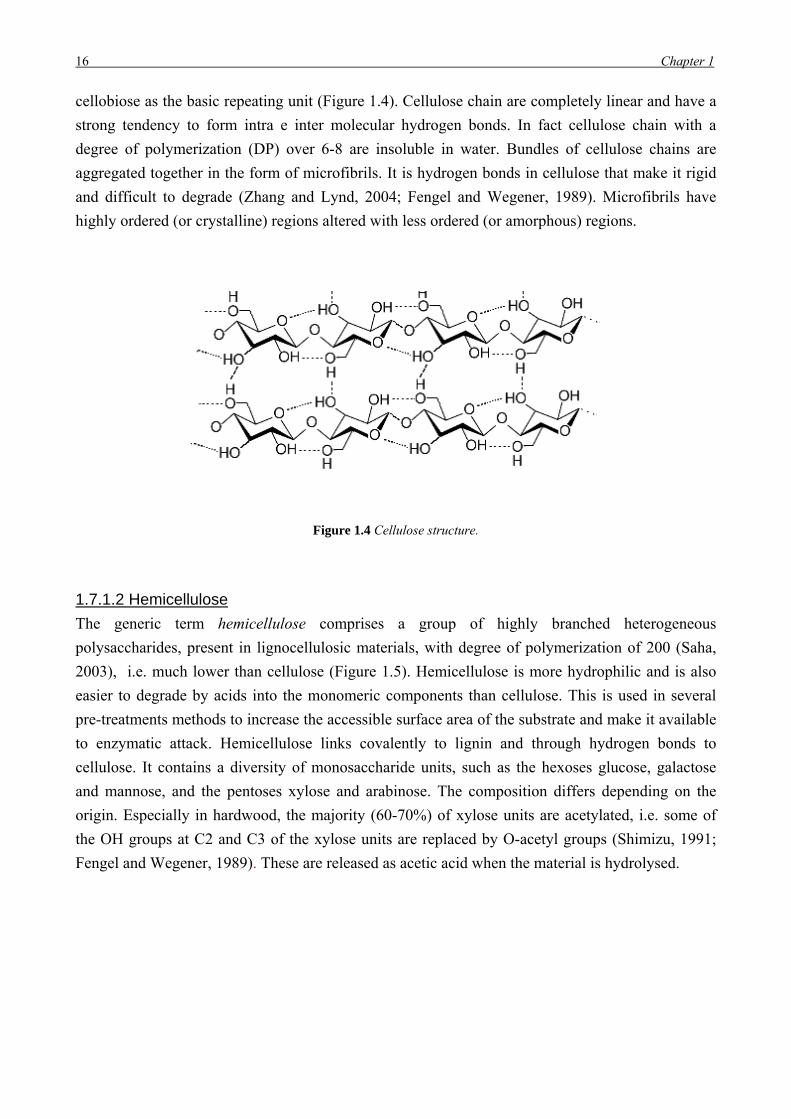
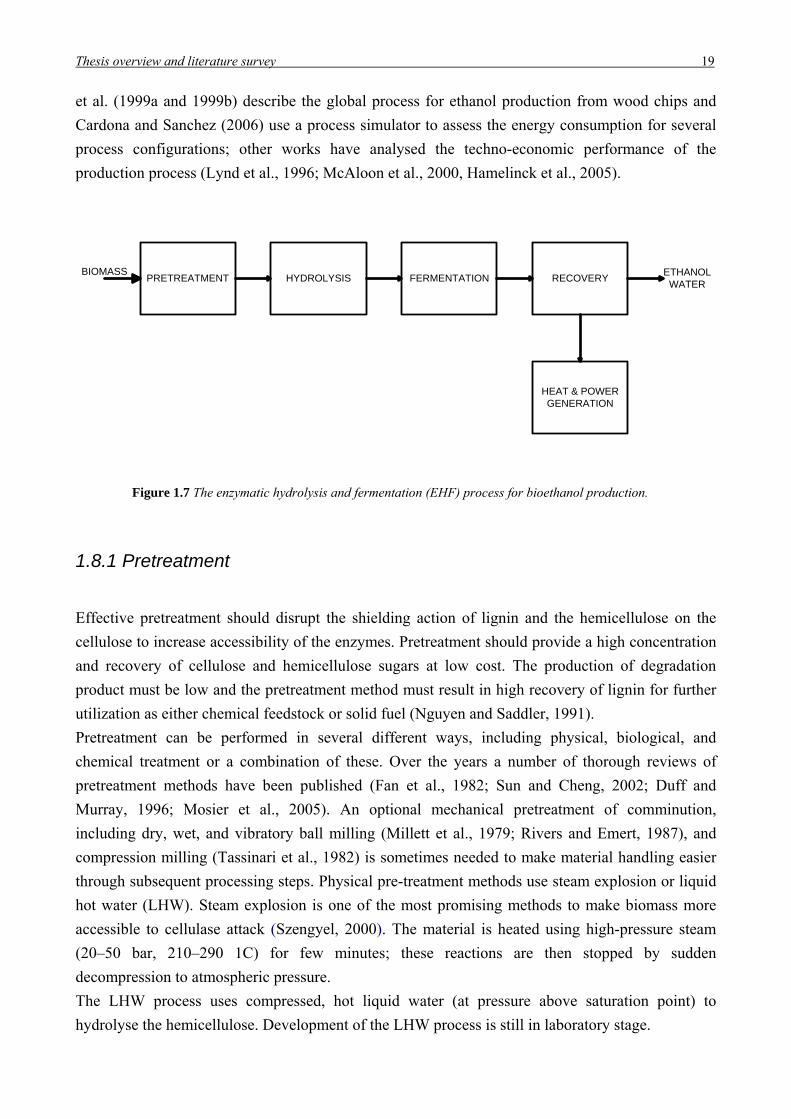
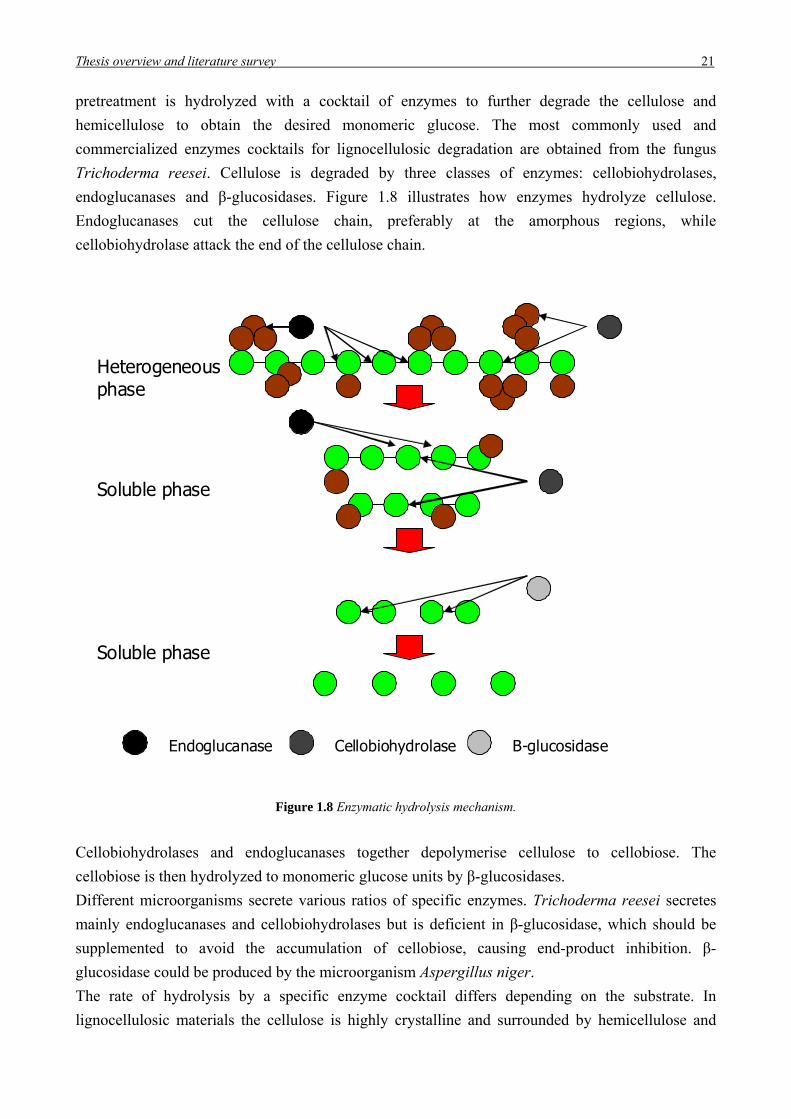
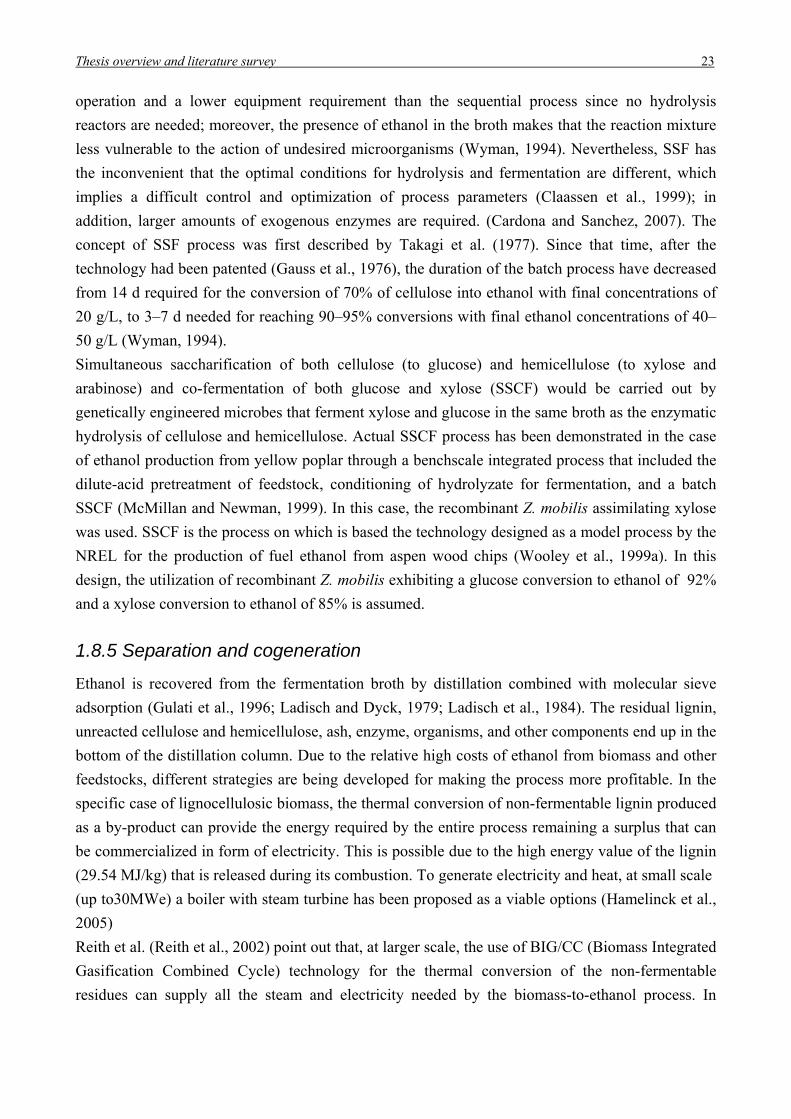
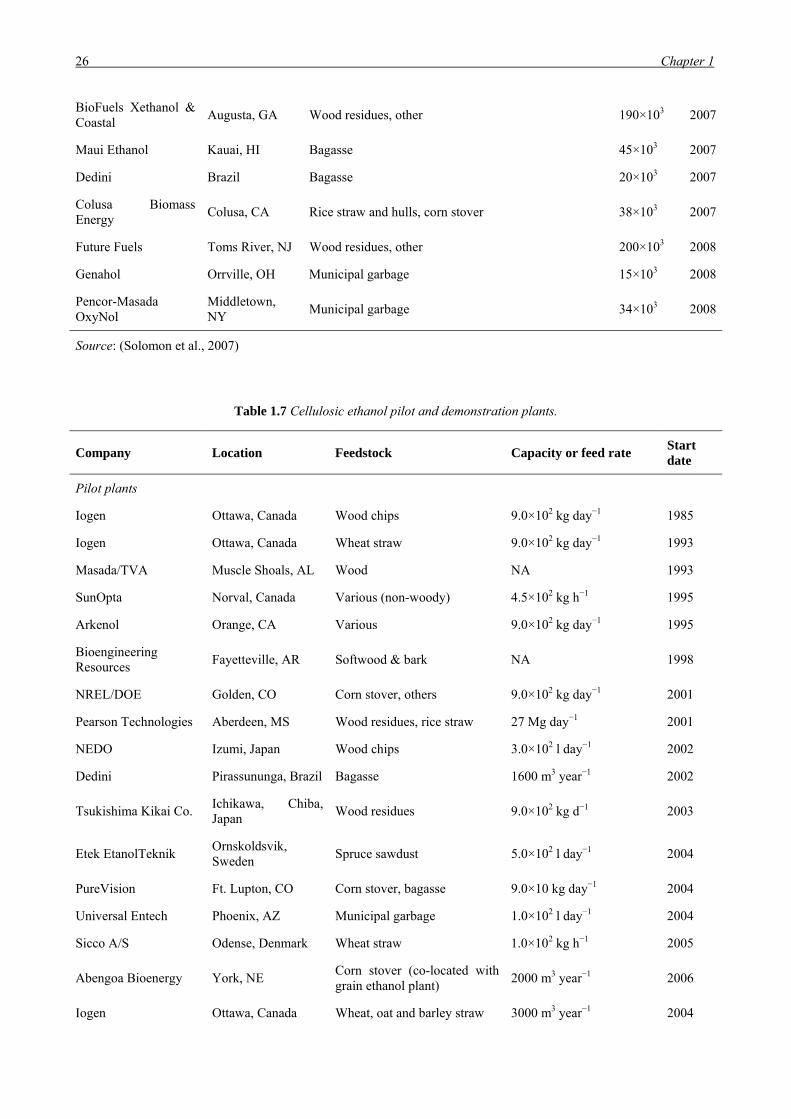
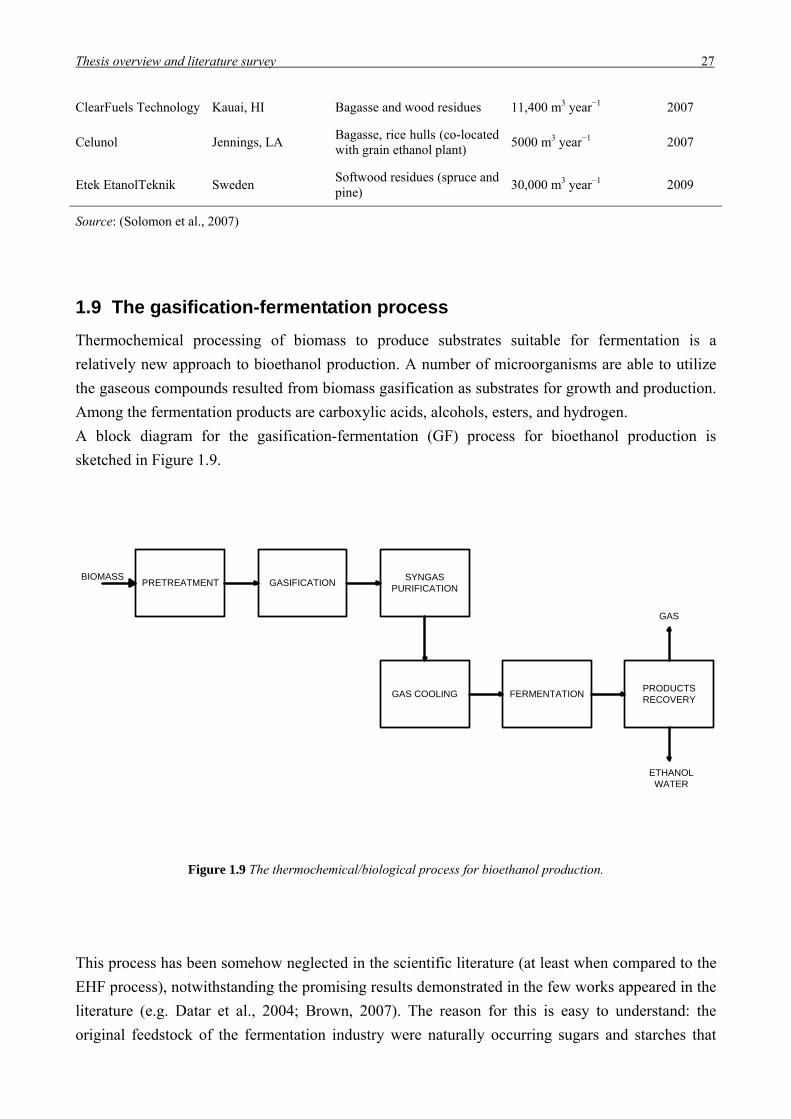
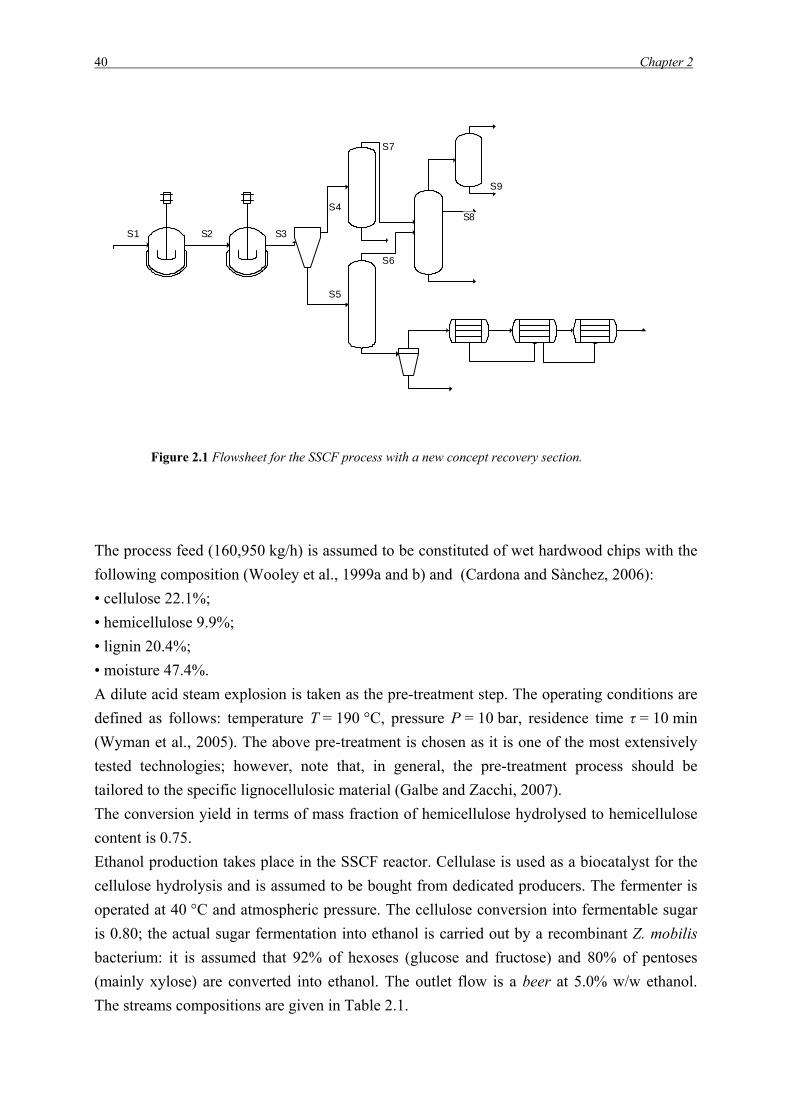
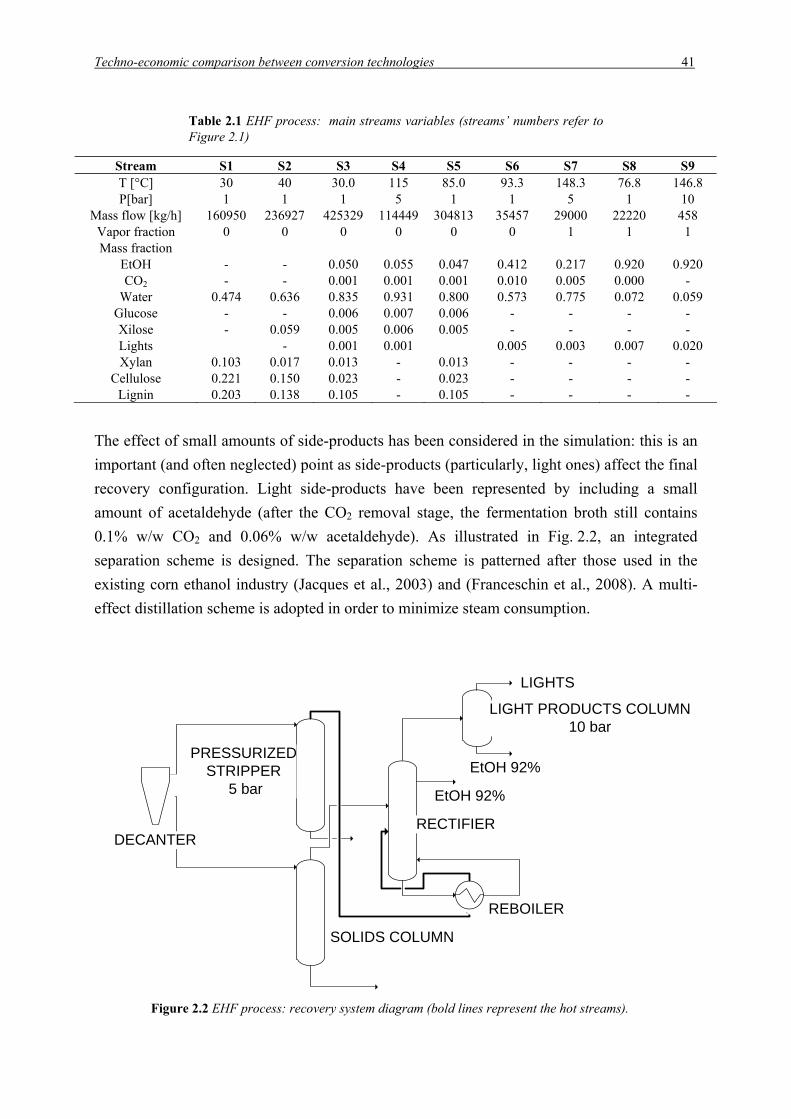
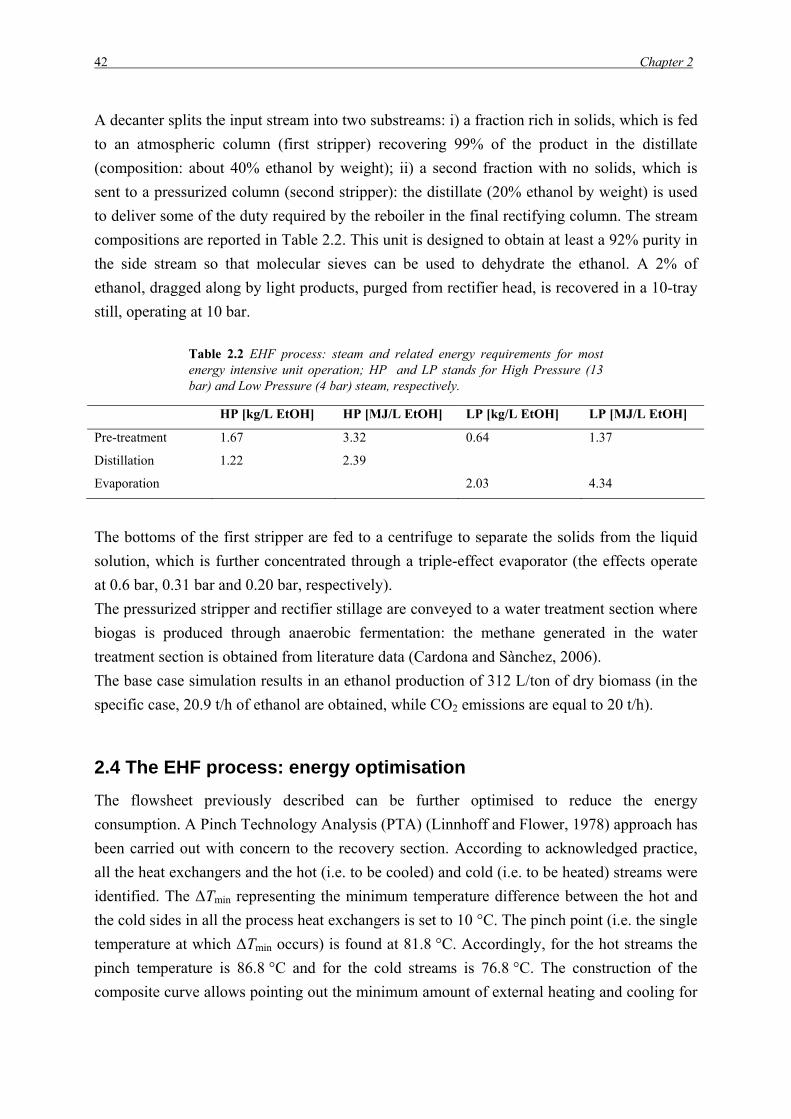
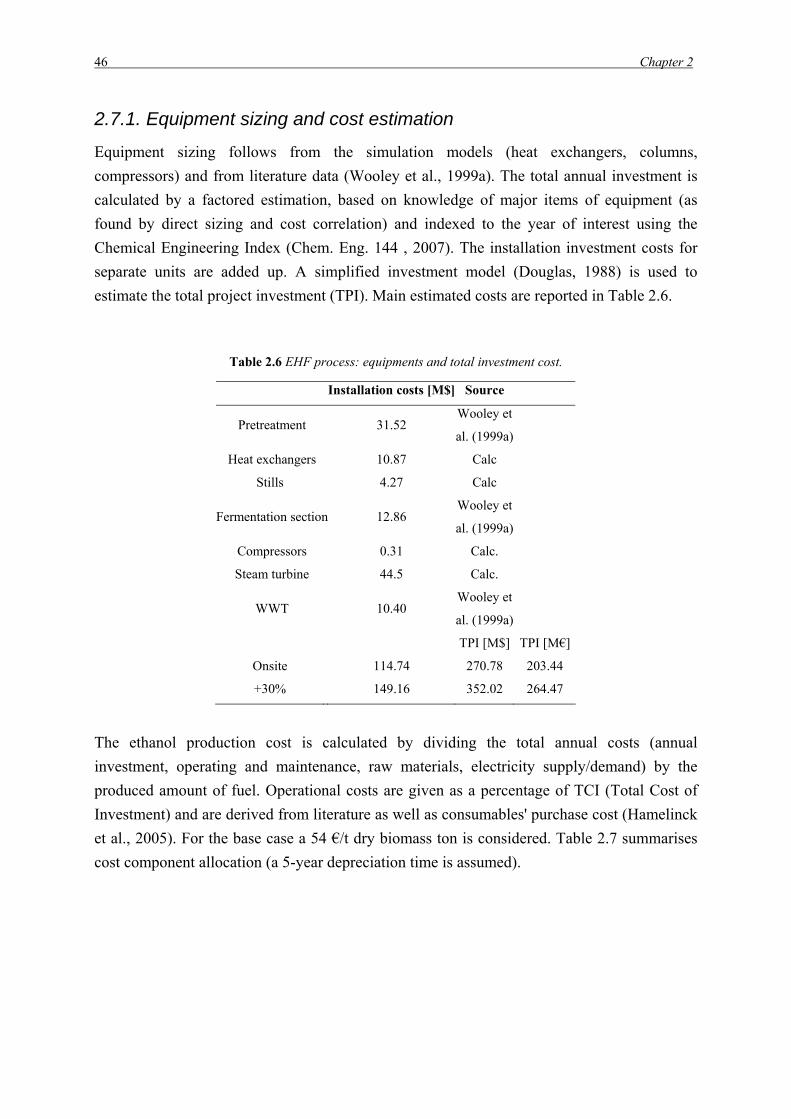
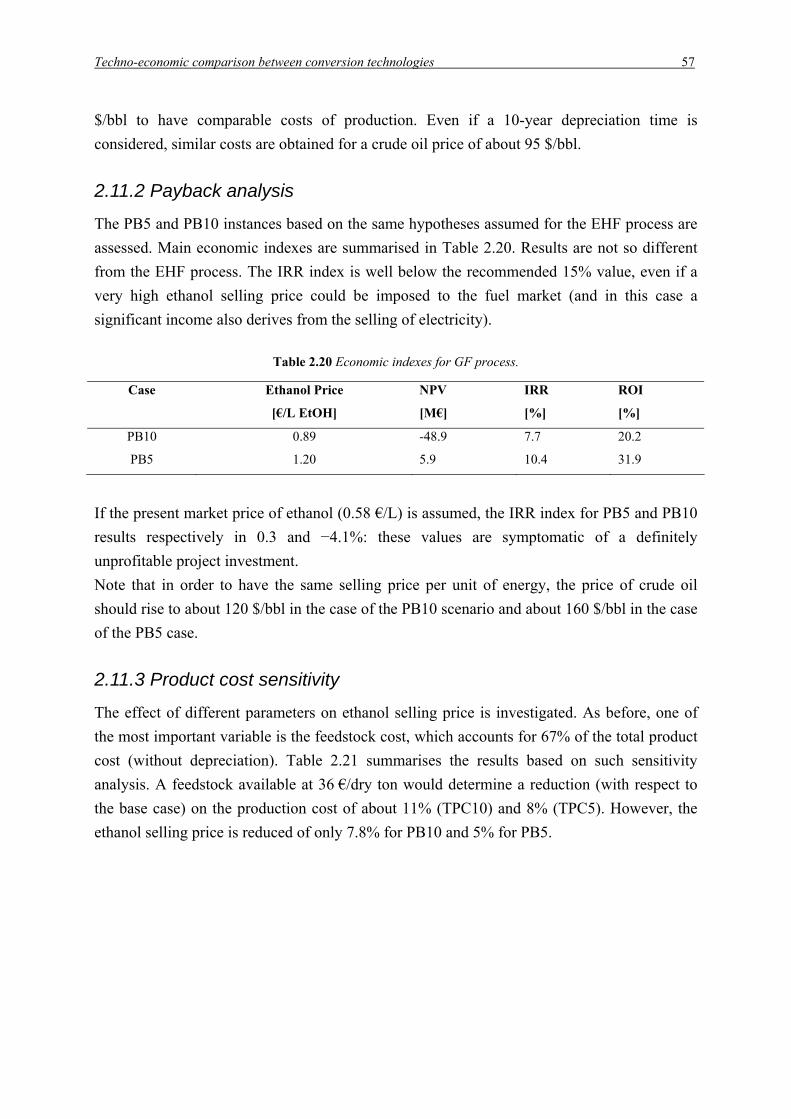
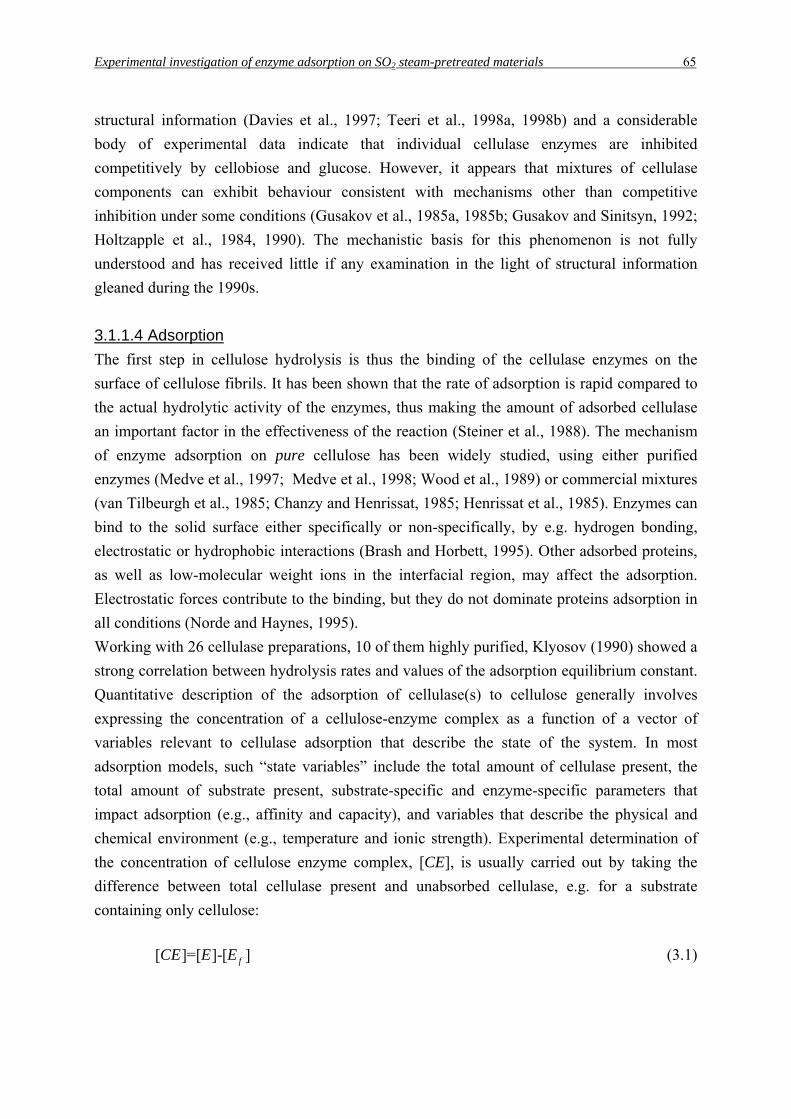
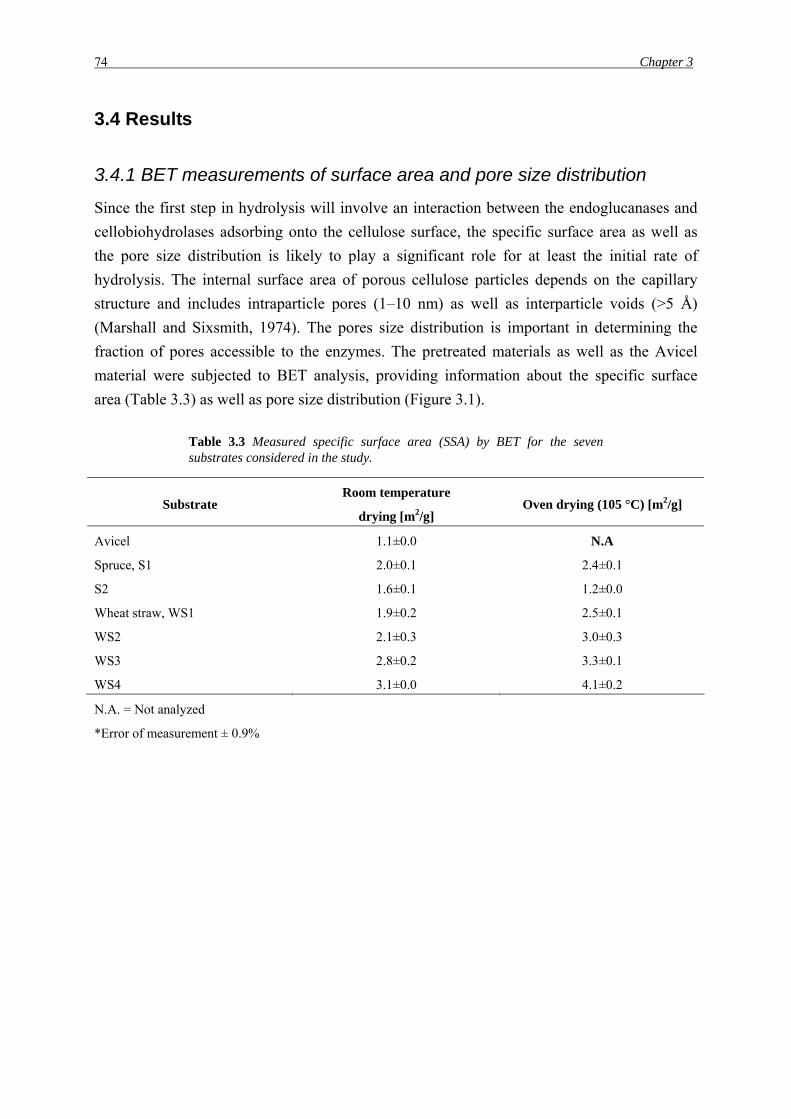
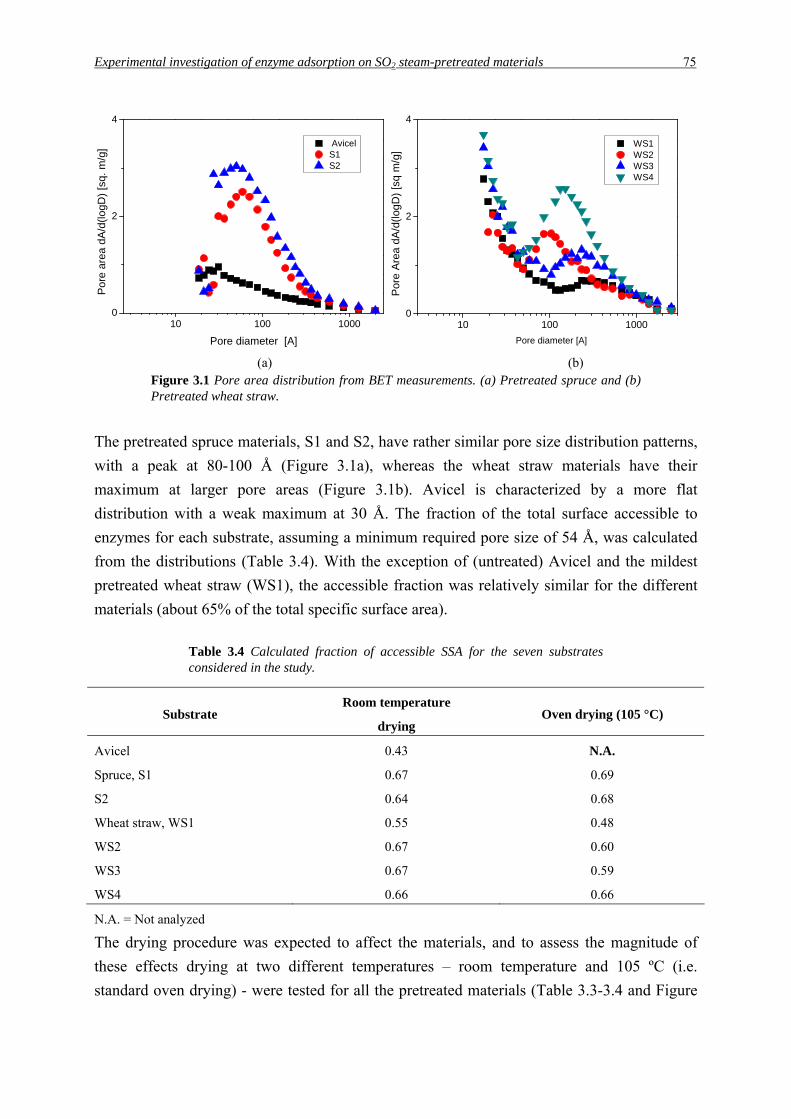
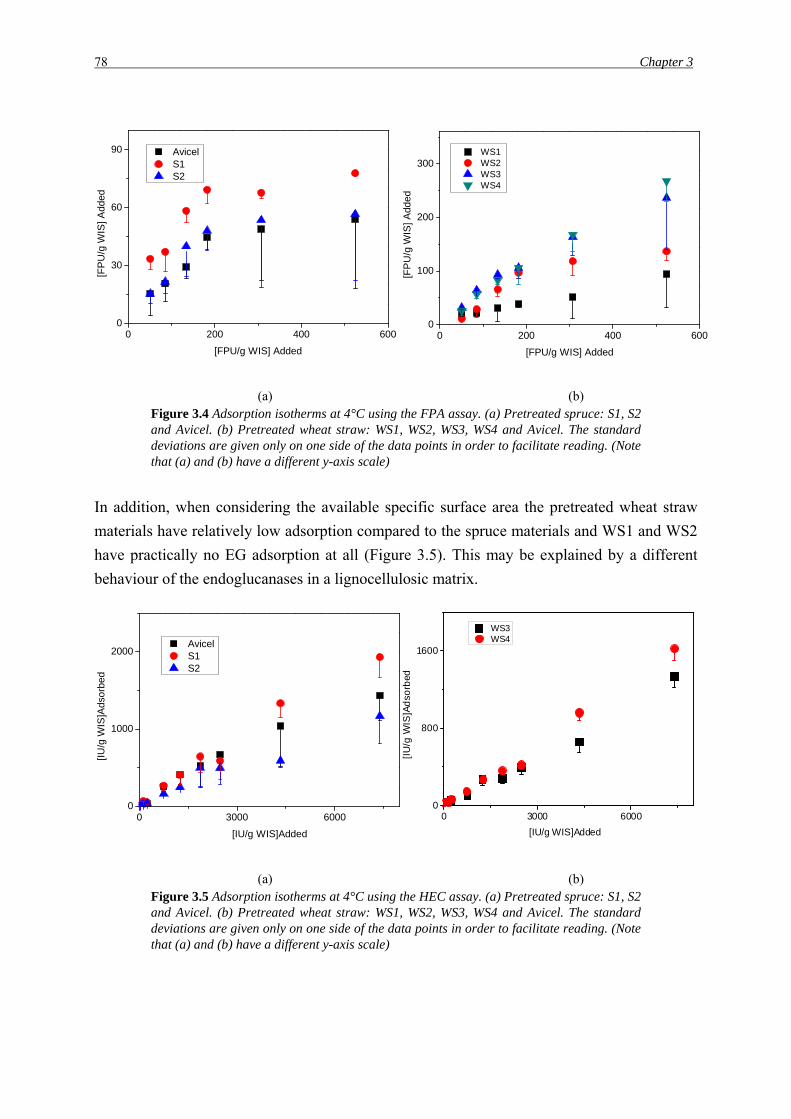
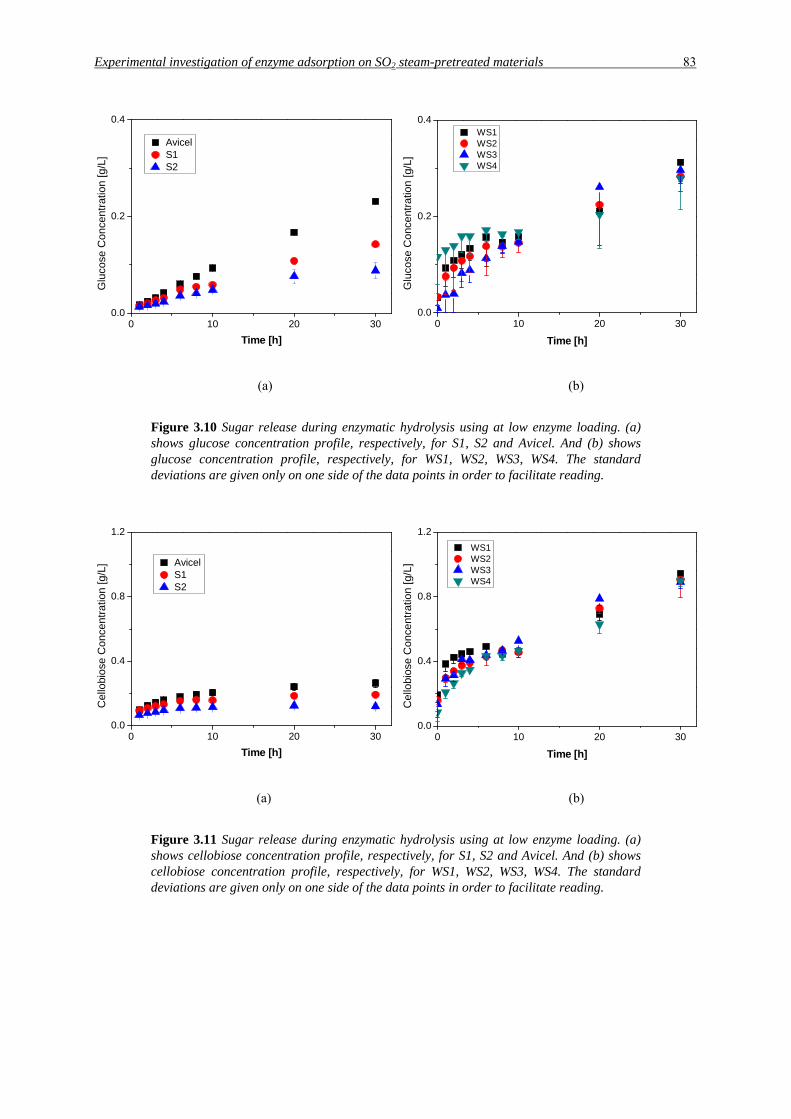
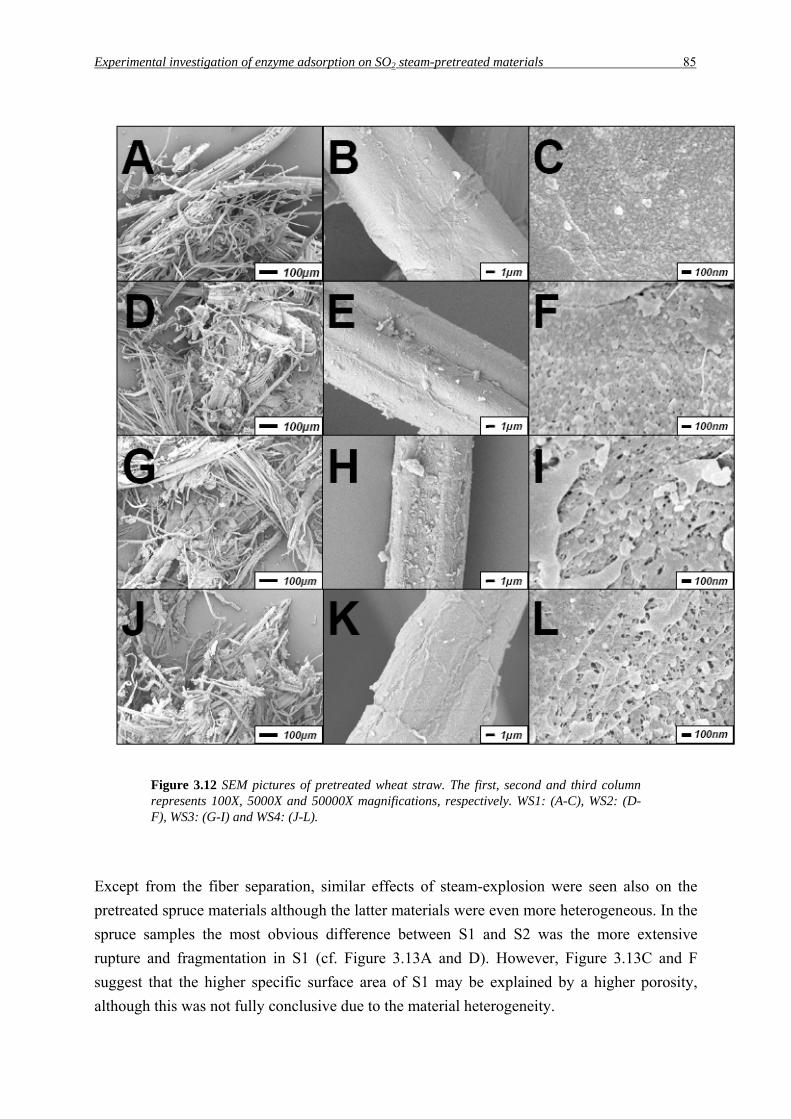
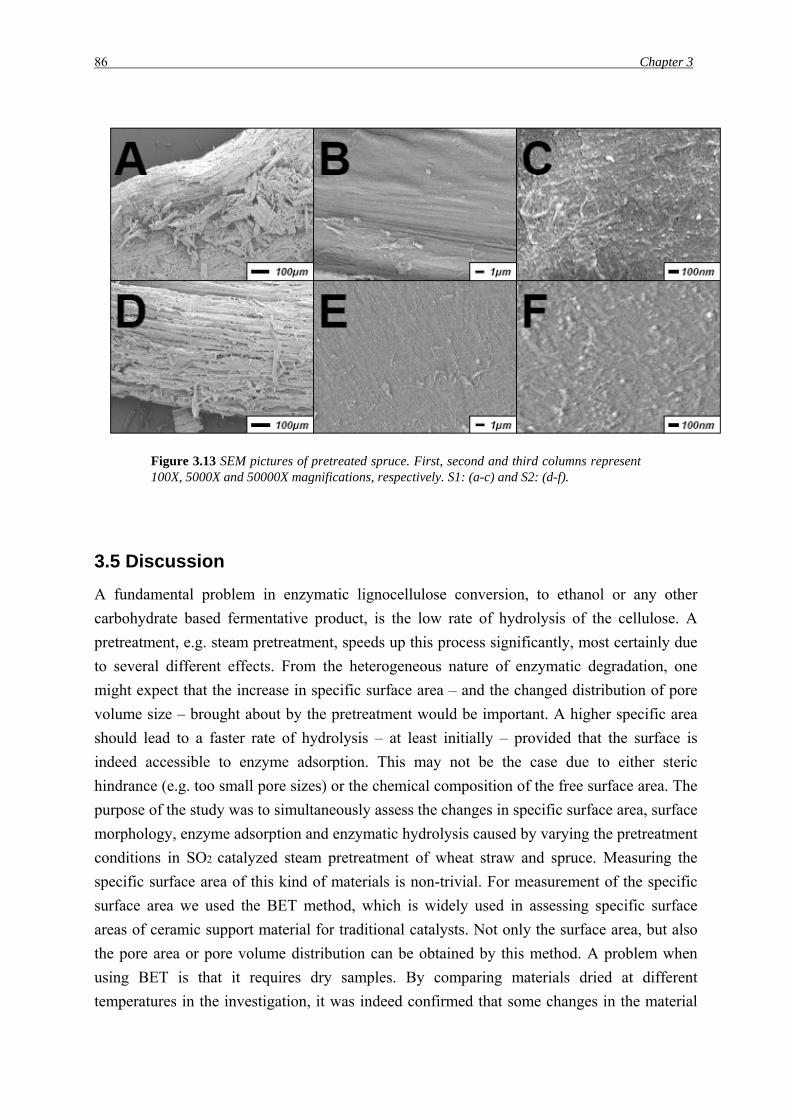
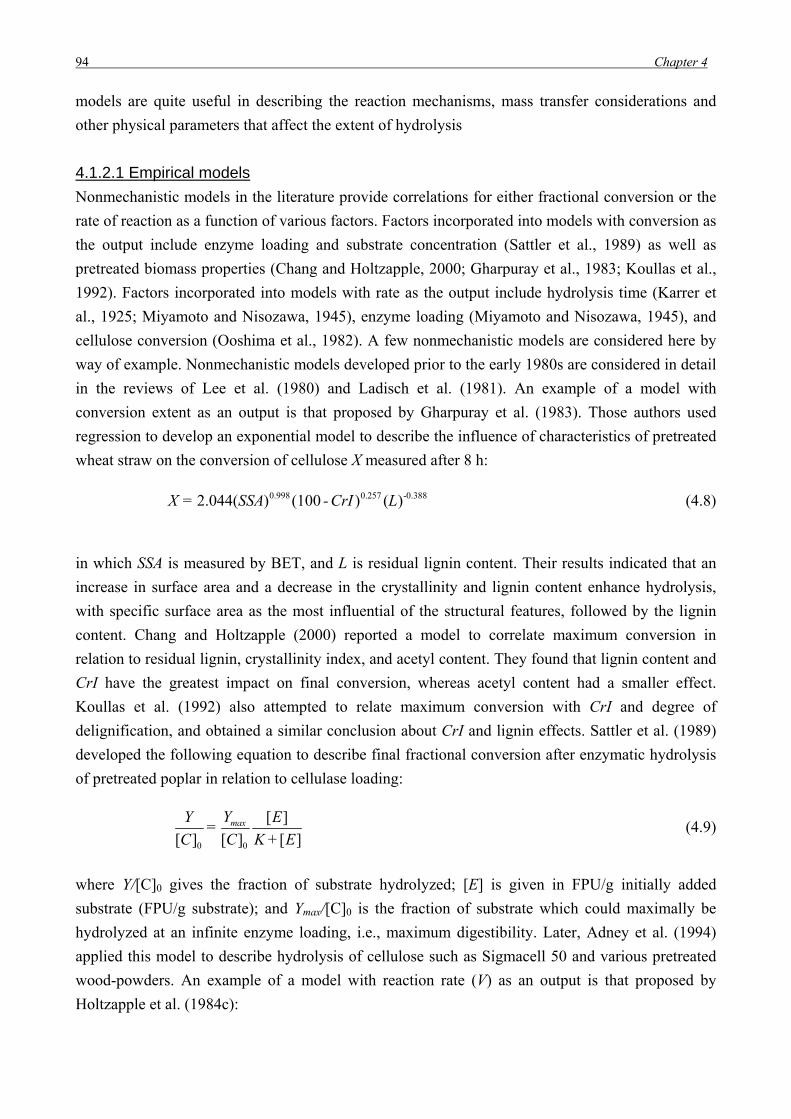
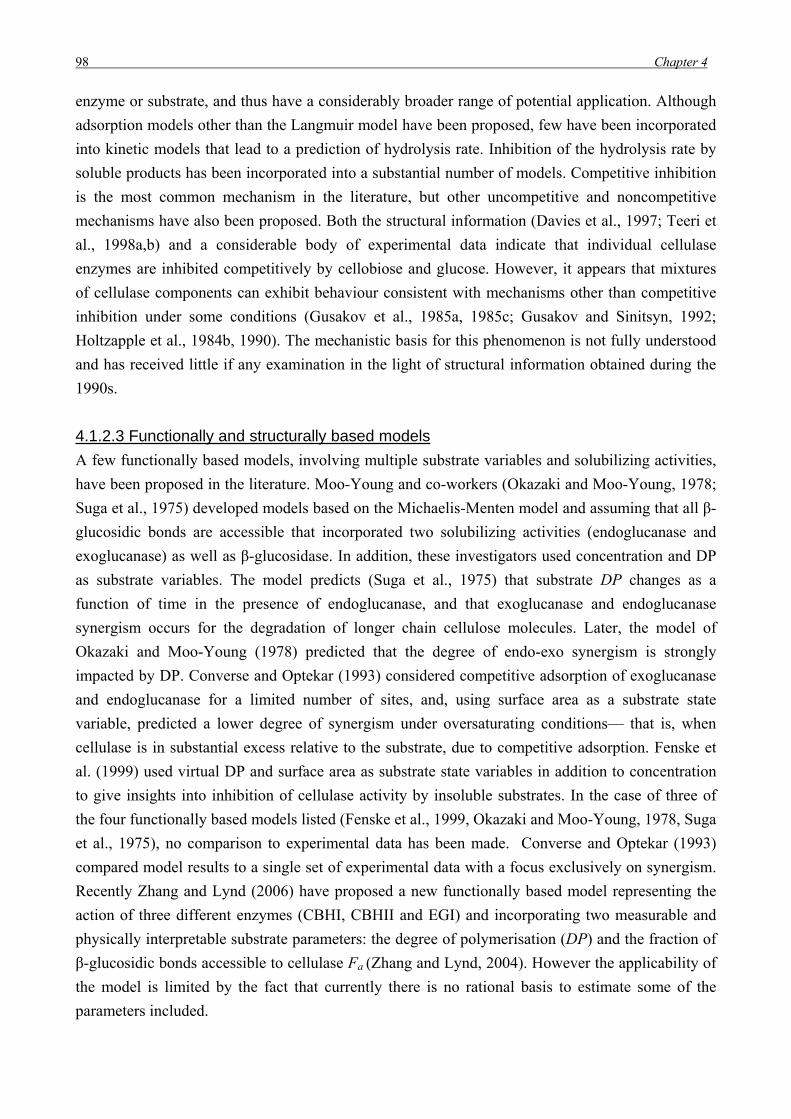
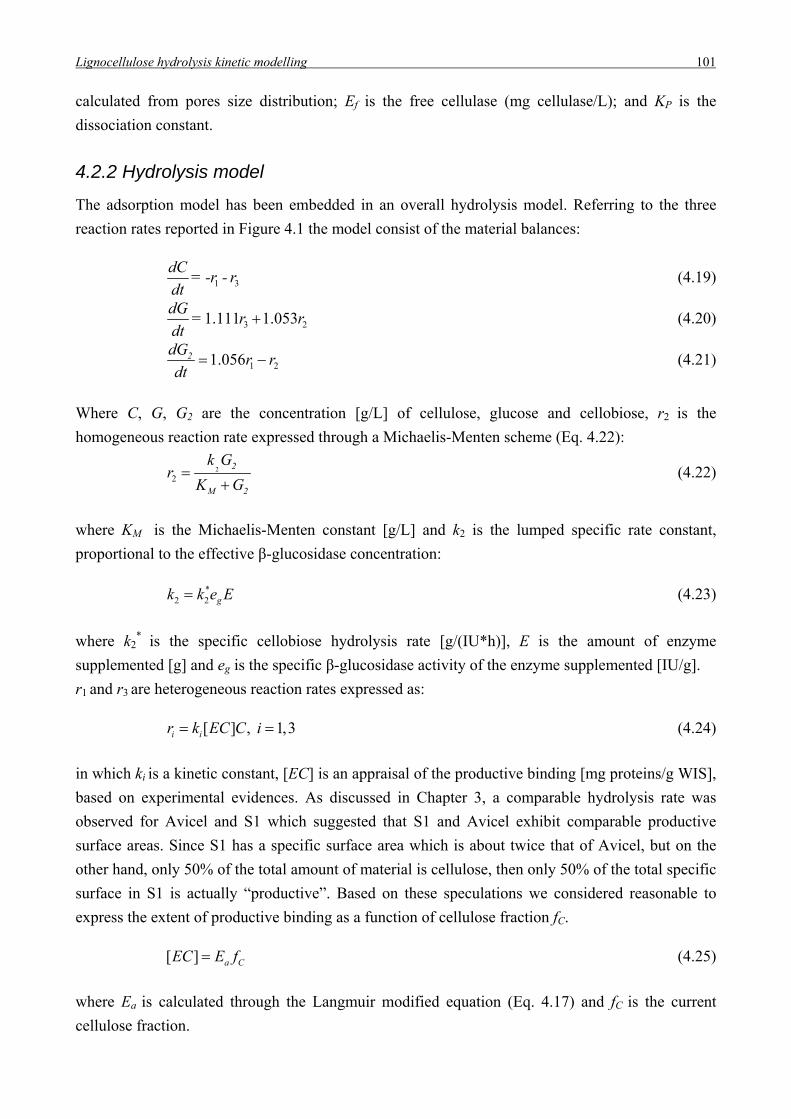
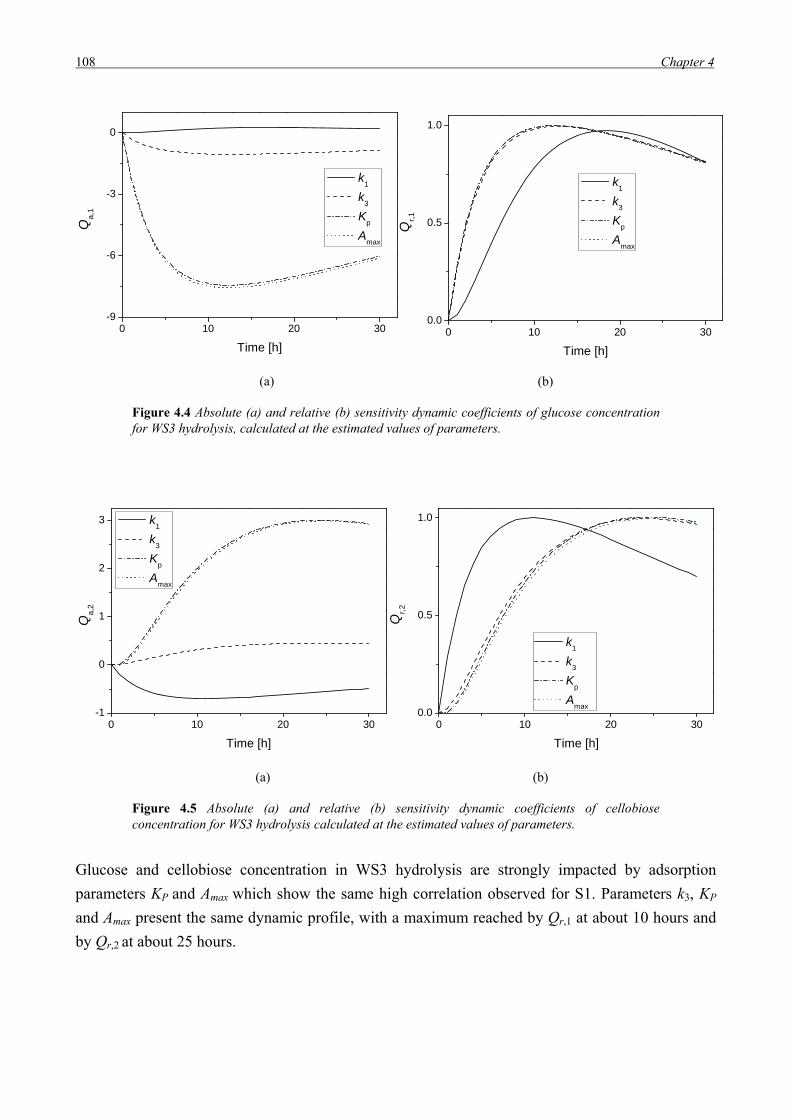
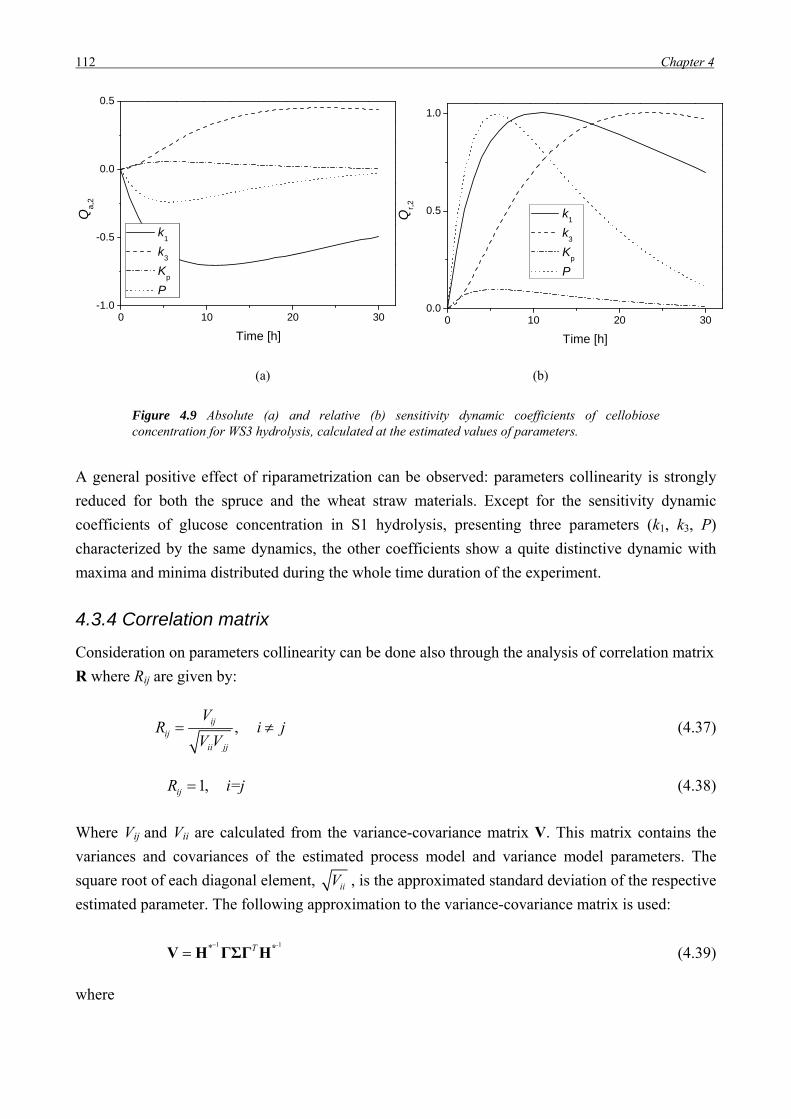
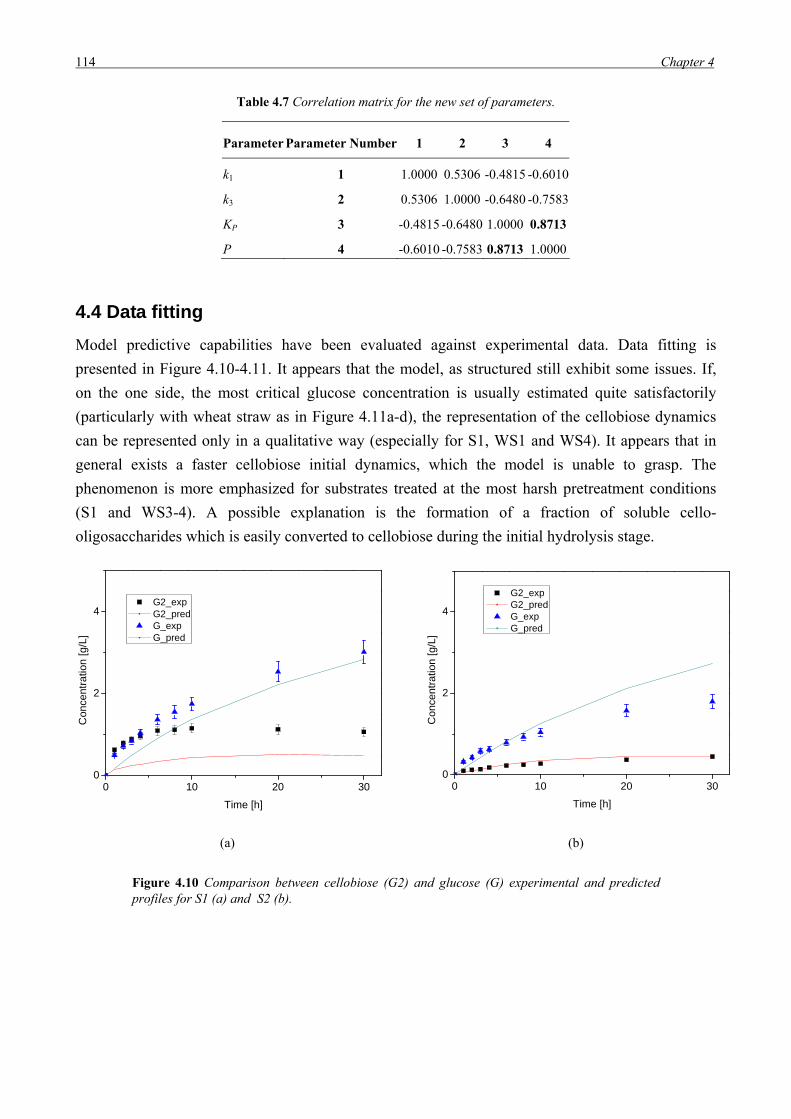
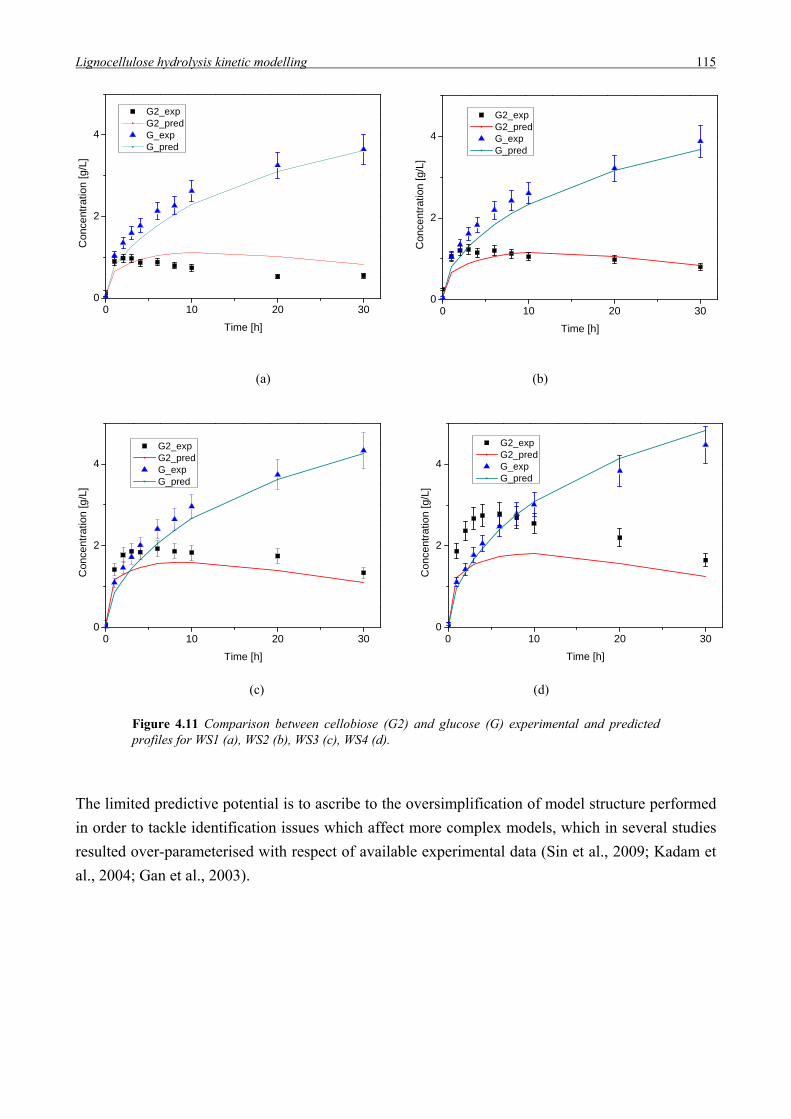
Golden, CO (U.S.A.).
Adney, W.S., C.I. Ehrman, J.O. Baker, S.R. Thomas, M.E. Himmel (1994). Cellulase assays:
methods from empirical mathematical models. ACS Ser, 566, 219–235.
Arato, C., E.K. Pye, G. Gjennestad (2005). The Lignol approach to biorefining of woody biomass to
produce ethanol and chemicals. Applied Biochemistry and Biotechnology, 121–124, 871–882.
Badger, P.C. (2002). Ethanol from cellulose: a general review. In: Trends in new crops and new
uses, (J. Janick and A. Whipkey Editors), ASHS Press, Alexandria (VA).
Balat, M. (2007). Global bio-fuel processing and production trends, Energy Explor Exploit, 25,
195–218.
Balat, M. (2009). New biofuel production technologies, Energy Educ Sci Technol, 22, 147–161.
Béguin, P., J.P. Aubert (1994). The biological degradation of cellulose. FEMS Microbiology
Reviews, 13, 25–58.
Beldman, G., A.G.J. Voragen, F.M. Rombouts, M.F. Searle-van Leeuwen, and W. Pilnik (1987).
Adsorption and kinetic behavior of purified endoglucanases and exoglucanases from
Trichoderma viride. Biotechnol. Bioeng., 30, 251–257.
Beltrame, P.L., P. Carniti, B. Focher, A. Marzetti, V. Sarto (1984). Enzymatic hydrolysis of
cellulosic materials: a kinetic study. Biotechnol Bioeng, 26, 1233– 1238.
Bernardez, T.D., K. Lyford, D.A. Hogsett, L.R. Lynd (1993). Adsorption of Clostridium
thermocellum cellulase onto pretreated mixed hardwood, Avicel and Lignin. Biotechnol
Bioeng, 43, 899–907.
Betrabet, S.M., K.M. Paralikar (1977). Effect of cellulase on the morphology and fine structure of
cellulosic substrates. 1. wheat straw pulp. Cellulose Chem Technol, 11, 615–625.
Biofuels for transportation (2007). European Biomass Industry Association (EUBIA), Renewable
Energy House, Brussels (Belgium). http://www.eubia.org. (last accessed October 2009).
Botello, J.I. M.A. Gilarranz, F. Rodriguez M. Oliet (1999). Preliminary study on products
distribution in alcohol pulping of Eucalyptus globulus. J. Chem. Technol. Biotechnol., 74,
141– 148.
Boussaid, A., J.N. Saddler (1999). Adsorption and activity profiles of cellulases during the
hydrolysis of two Douglas-fir pulps. Enzyme Microbial Technol, 24, 138-143.
120 References
Bradford, M.M. (1976). A rapid and sensitive method for the quantitation of microgram quantities
of protein utilizing the principle of protein-dye binding. Analytical Biochem, 72, 248-254.
Brash, J.L., T.A. Horbett (1995). Proteins at interfaces, an overview. In: Proteins at interfaces II,
Fundamentals and Applications ( Horbett TJ, Brash JL Eds.), ACS Symposium Series 602,
American Chemical Society, Washington, DC, (U.S.A.).
Bredwell, M.D., P. Srivastava e R.M. Worden (1999). Reactor design issues for synthesis.gas
fermentations. Biotechnol. Prog, 15, 834-844.
Bridgwater, A. V. (1995). The technical and economic feasibility of biomass gasification for power
generation. Fuel, 74, 5, 631-653.
Brown, R.C. (2007). Hybrid thermochemical/biological processing. Applied biochem and
biotechnol. 136-140, 947-956.
Brown, R.M. (2004). Cellulose structure and biosynthesis : what is in store for the 21st century ?,
Journal of Polymer Science, 42, 487-495.
Brownell, H.H., J.N. Saddler (1987). Steam pretreatment of lignocellulosic material for enhanced
enzymatic hydrolysis. Biotechnol Bioeng, 29, 228-235.
Bruce, W. (BRI Energy President) (2006). Testimony in front of United States Senate Natural
Resources Committee, Washington, DC, 1 May.
Bungay, H. and J. Peterson (1992). CMA as a byproduct of the manufacture of fuel ethanol.
Resources, Conservation and Recycling, 7, 83–94.
Burns, D.S., H. Ooshima, A.O. Converse (1989). Surface area of pretreated lignocellulosics as a
function of the extent of enzymatic hydrolysis. Appl Biochem Biotechnol, 20/21, 79-94.
Caminal, G., J. Lòpez-Santin, and C. Sola (1985). Kinetic modeling of the enzymatic hydrolysis of
pretreated cellulose. Biotechnol. Bioeng., 27, 1282– 1290.
Campbell, G. (2007). Panorama of transport. Office for Publications of the European
Communities, Luxembourg.
Cardona, C. A., O. J. Sànchez (2006). Energy consumption analysis of integrated flowsheet for
production of fuel ethanol from lignocellulosic biomass. Energy, 31, 13, 2447-2459.
Cardona, C.A. and O.J. Sanchez (2007). Fuel ethanol production: process design trends and
integration opportunities, Bioresour Technol, 98, 2415–2457.
Cardona, C.A., O.J. Sànchez, (2004). Analysis of integrated flow sheets for biotechnological
production of fuel ethanol. In: PRES 2004-16th International congress of chemical and process
engineering (CHISA 2004), Prague (Czech Republic).
Carrard, G., M. Linder (1999). Widely different off rates of two closely related cellulose-binding
domains from Trichoderma reesei. Eur J Biochem, 262, 637– 643.
Caulfield, D.F., W.E. Moore (1974). Effect of varying crystallinity of cellulose on enzyme
hydrolysis. Wood Sci, 6, 375– 379.
Chandra, R.P., S.M. Ewanick, C. Hsieh, J.N. Saddler (2008). The characterization of pretreated
lignocellulosic subsrates prior to enzymatic hydrolysis, part1: a modified Simon’s staining
technique. Biotechnol Prog, 24, 1178-1185.
References 121
Chandra, R.P., S.M. Ewanick, P.A. Chung, K. Au-Yeung , L. Del Rio, W. Mabee, J.N. Saddler
(2009). Comparison of method to assess the enzyme accessibility and hydrolysis of pretreated
lignocellulosic substrates. Biotechnol Lett, 31, 1217-1222.
Chandrakant, P., V.S. Bisaria (1998). Simultaneous bioconversion of cellulose and hemicellulose to
ethanol. Critical Reviews in Biotechnology, 18, 295–331.
Chang, M.M., T.Y.C. Chou, G.T. Tsao (1981). Structure, pretreatment and hydrolysis of cellulose.
Adv Biochem Eng, 20, 15– 42.
Chang, V.S., M.T. Holtzapple (2000). Fundamental factors affecting biomass enzymatic reactivity.
Appl Biochem and Biotechnol, 84-86, 5-37.
Chang, V.S., M.T. Holtzapple (2000). Fundamental factors affecting biomass enzymatic reactivity.
Appl Biochem Biotechnol, 84/86, 5– 37.
Chanzy, H. and B. Henrissat (1985). Unidirectional degradation of Valonia cellulose microcrystals
subjected to cellulase action. FEBS Lett, 184, 285–288.
Chanzy, H., B. Henrissat, R.Vuong (1984). Colloidal gold labeling of 1,4- β-glucan
cellobiohydrolase adsorbed on cellulose substrates. FEBS Lett, 172, 193– 196.
Chem Eng 114 (May 2007), p. 96.
Chen, C.S., Y.W. Lai, C.J. Tien (2008). Partitioning of aromatic and oxygenated constituents into
water from regular and ethanol-blended gasolines, Environ Pollut, 156, 988–996.
Chernoglazov, V.M., O.V. Ermolova, A.A. Klyosov (1988). Adsorption of high-purity endo-1,4-β-
glucanases from Trichoderma reesei on components of lignocellulosic materials: cellulose,
lignin, and xylan. Enzyme Microb Technol, 10, 503–507.
Claassen, P.A.M., J.B. van Lier, A.M. López Contreras, E.W.J. van Niel, L. Sijtsma, A.J.M. Stams,
de Vries, S.S. and R.A. Weusthuis (1999). Utilisation of biomass for the supply of energy
carriers, Applied Microbiology and Biotechnology, 52, 741–755.
Clausen, E.C. (2006). Personal Communication.
Converse, A.O., H. Ooshima, D.S. Burns (1990). Kinetics of enzymatic hydrolysis of lignocellulose
materials based on surface area of cellulose accessible to enzyme and enzyme adsorption on
lignin and cellulose. Appl Biochem and Biotechnol, 24-25, 67-73.
Converse, A.O., H.E. Grethlein (1987). On the use of an adsorption model to represent the effect of
steam explosion pretreatment on the enzymatic hydrolysis of lignocellulosic substances.
Enzyme Microb Technol, 9, 79–82.
Converse, A.O., J.D. Optekar (1993). A synergistic kinetics model for enzymatic cellulose
hydrolysis compared to degree-of-synergism experimental results. Biotechnol Bioeng, 42,
145–148.
Converse, A.O., R. Matsuno, M. Tanaka, M. Taniguchi (1988). A model of enzyme adsorption and
hydrolysis of microcrystalline cellulose with slow deactivation of the adsorbed enzyme.
Biotechnol Bioeng, 32, 38–45.
Converti, A., S. Arni, S. Sato, J.C.M. Carvalho, E. Aquarone (2003). Simplified modeling of fed-
batch alcoholic fermentation of sugarcane blackstrap molasses, Biotechnology and Bioengineering
84, 88–95.
122 References
Co-production of ethanol and electricity from carbon- based wastes. A report from Bioengineering
Resources, Inc. regarding a new technology that addresses multiple energy and waste disposal
solutions (2006). Technical report. www.brienergy.com (ultimo accesso: 2009).
Coughlan, M. (1985), The properties of fungal and bacterial cellulases with comment on their
production and application.Biotech. Genet. Eng. Rev,. 3, 39–109.
Dale, B.E. (1986). Method for increasing the reactivity and digestibility of cellulose with ammonia.
US Patent 4,600,590.
Datar, R.P., R.M. Shenkman, B.G. Cateni, R.L. Huhnke e R.S. Lewis (2004). Fermentation
biomass-generated producer gas to ethanol. Biotechnology and Bioengineering, 86, 587-594.
Davies, G.J., V. Ducros, R.J. Lewis, T.V. Borchert, M. Schulein (1997). Oligosaccharide specificity
of a family 7 endoglucanase: insertion of potential sugar-binding subsites. J Biotechnol, 57,
91–100.
Decker, C.H., J. Visser and P. Schreier (2000). β-Glucosidases from five black Aspergillus species:
study of their physico-chemical and biocatalytic properties. J. Agric. Food Chem. 48, 4929–
4936.
Demirbas, A. (2000). Biomass resources for energy and chemical industry. Energy Edu Sci
Technol, 5, 21–45.
Demirbas, A. (2005). Bioethanol from cellulosic materials: a renewable motor fuel from biomass,
Energy Sources Part A, 27, 327–337.
Demirbas, A. (2006). Global biofuel strategies, Energy Educ Sci Technol, 17, 33–63.
Demirbas, A. (2007). Producing and using bioethanol as an automotive fuel, Energy Sources Part
B, 2, 391–401.
Demirbas, M.F., M. Balat (2006). Recent advances on the production and utilization trends of bio-
fuels: a global perspective, Energy Convers Manage, 47, 2371–2381.
Dermoun, Z., and J.P. Bélaïch (1988). Crystalline index change in cellulose during aerobic and
anaerobic Cellulomonas uda growth. Appl. Microbiol. Biotechnol., 27, 399–404.
Desai, S. G., and A. O. Converse (1997). Substrate reactivity as a function of the extent of reaction
in the enzymatic hydrolysis of lignocellulose. Biotechnol. Bioeng., 56, 650–655.
Detchon (2005). Biofuels for Our Future: A Primer. UN Foundation
www.energyfuturecoalition.org/biofuels/BioFuels_FAQ.pdf (last accessed October
2009).
Deurwaarder, E.P. (2005). Overview and Analysis of National Reports of the EU Biofuel Directive:
Prospects and Barriers for 2005. ECN (Energy Research Centre of the Netherlands)
www.ecn.nl/docs/library/report/2005/c05042.pdf (last accessed October 2009).
Difiglio, C. (1997). Using advanced technologies to reduce motor vehicle greenhouse gas
emissions. Energy Policy, 25, 1173–1178.
Din, N., H.G. Damude, N.R. Gilkes, R.C. Miller, R.A.J. Warren and D.G. Kilburn (1994). C1-Cx
revisited: intramolecular synergism in a cellulase. Proc. Natl. Acad. Sci., 91, 11383–11387.
References 123
Divne, C., J. Ståhlberg, T. Reinikainen, L. Ruohonen, G. Pettersson, J. K. C. Knowles, T. T. Teeri,
and T. A. Jones (1994). The three-dimensional crystal structure of the catalytic core of
cellobiohydrolase I from Trichoderma reesei. Science, 265, 524–528.
Dizhbite, T., G. Zakis, A. Kizima, E. Lazareva, G. Rossinskaya, V. Jurkjane, G. Telysheva and U.
Viesturs (1999). Lignin – a useful bioresource for the production of sorption-active materials,
Bioresource Technology, 67, 221–228.
DOE announces up to $200 million in funding for biorefineries: small- and full-scale projects total
up to $585 million to advance President Bush’s Twenty in Ten Initiative (2007). United States
Department of Energy. Press release, www.energy.gov/news/5031.htm, May 1st.
Donaldson, L.A., K.K.Y. Wong, K.L. Mackie (1988). Ultrastructure of steam-exploded wood.
Wood Sci Technol, 22, 103-114.
Douglas, J.M. (1988). Conceptual design of chemical processes, McGraw-Hill Book Co., New
York (U.S.A.).
Dufey, A (2006). Biofuels production, trade and sustainable development: emerging issues.
Sustainable markets discussion, paper no. 2, International Institute for Environment and
Development, London (U.K.), November 2006.
Duff, S.J.B., W.D. Murray (1996). Bioconversion of forest products industry waste cellulosics to
fuel ethanol: a review. Biores Technol, 55, 1-33.
Elander, T.E., V.L. Putsche (1996). Ethanol from corn: Technology and economics. In: Handbook
on bioethanol: Production and utilization.Wyaman, C.E., Washington (U.S.A.), pp. 351-347.
Energy technology perspectives 2006 – in support of the G8 plan of action – scenarios and
strategies to 2050 (2006). Technical Report of International Energy Agency
(IEA)/Organisation for Economic Co-operation and Development (OECD), Paris (France).
Ericsson, K. and L.J. Nilsson (2004). International biofuel trade—a study of the Swedish import,
Biomass Bioenergy, 26, 205–220.
Eriksson, T., J. Borjesson, F. Tjerneld (2002). Mechanism of surfactant effect in enzymatic
hydrolysis of lignocellulose. Enzyme Microb Technol, 31, 353– 364.
European transport policy for 2010: time to decide (2001). European Commission (EC). White
Paper, Brussels (Belgium); http://www.europa.eu.int (last accessed October 2009)
Fan, L., Y. Lee, D. Beardmore (1981). The influence of major structural features of cellulose on
rate of enzymatic hydrolysis. Biotechnol Bioeng, 23, 419-424.
Fan, L.T. , Y.H. Lee, M.M. Gharpuray (1982). The nature of lignocellulosics and their
pretreatments for enzymatic hydrolysis. Adv. Biochem. Eng., 23, 158-187.
Fan, L.T., Y.-H. Lee (1983). Kinetics studies of enzymatic hydrolysis of insoluble cellulose:
derivation of a mechanistic kinetics model. Biotechnol Bioeng, 25, 2707–2733.
Fan, L.T., Y.-H. Lee, D.H. Beardmore (1980). Mechanism of the enzymatic hydrolysis of cellulose:
effects of major structural features of cellulose on enzymatic hydrolysis. Biotechnol Bioeng,
22, 177– 199.
Fan, L.T., Y.H. Lee, M..M. Gharpuray (1982). The nature of lignocellulosics and their
pretreatments for enzymatic hydrolysis. Adv. Biochem. Eng, 23, 158-187.
124 References
Feasibility study on an effective and sustainable bioethanol production program by least developed
countries as alternative to cane sugar export. Ministry of Agriculture, Nature and Food
Quality (LNV) (2005). Dutch Sustainable Development Group (DSD), The Hague (The
Netherlands), May 20. <library.wur.nl/WebQuery/catalog/lang/1845441>.
Fengel, D., G. Wegener (1989). Wood: chemistry, ultrastructure, reactions. Walter de Gruyter &
Co., Berlin (Germany).
Fenske, J.J., M.H. Penner, J.P. Bolte (1999). A simple individual-based model of insoluble
polysaccharide hydrolysis: the potential for autosynergism with dual-activity glycosidases. J
Theor Biol, 199,113–118.
Fierobe, H.P., E.A. Bayer, C. Tardif, M. Czjzek, A. Mechaly, A. Bélaïch, R. Lamed, Y. Shoham,
J.P. Bélaıch (2002). Degradation of Cellulose Substrates by Cellulosome Chimeras: substrate
targeting versus proximity of enzyme components. J Biol Chem, 277, 49621-49630.
Foyle, T., L. Jennings and P. Mulcahy (2006). Compositional analysis of lignocellulosic materials:
evaluation of methods used for sugar analysis of waste paper and straw, Bioresource
Technology, 98, 3026–3036.
Franceschin, G., A. Zamboni, F. Bezzo and A. Bertucco (2008). Ethanol from corn: a technical and
economic assessment based on different scenarios, Chem Eng Res Des, 86, 488–498.
Galbe M. and G. Zacchi (2007). Pretreatment of lignocellulosic materials for efficient bioethanol
production, Adv Biochem Eng Biotechnol, 108, 41–65.
Gama, F.M., and M. Mota (1997). Enzymatic hydrolysis of cellulose (I): relationship between
kinetics and physico-chemical parameters. Biocatalysis Biotrans., 15, 221–236.
Gan, Q., S.J. Allen, G. Taylor (2003). Kinetic dynamics in heterogeneous enzymatic hydrolysis of
cellulose: an overview, an experimental study and mathematical modeling, Process Biochem,
38, 1003–1018.
Gauss, W.F., S. Suzuki, M. Takagi (1976). Manufacture of alcohol from cellulosic materials using
plural ferments. Patent US3990944.
Gharpuray, M.M., Y.H. Lee, L.T. Fan (1983). Structural modification of lignocellulosic by
pretreatments to enhance enzymatic hydrolysis. Biotechnol Bioeng, 25,157–172.
Ghose, T.K. (1987). Measurement of cellulase activities. Pure & Appl Chem, 59, 257-268.
Ghosh, P., T.K. Ghose (2003). Bioethanol in India: recent past and emerging future. Advances in
Biochemical Engineering/Biotechnology, 85, 1–27.
Gilkes, N.R., E. Jervis, B. Henrissat, B. Tekant, R.C. Jr Miller, R.A.J. Warren, D.G. Kilburn (1992).
The adsorption of a bacterial cellulase and its two isolated domains to crystalline cellulose. J
Biol Chem, 267, 6743– 6749.
Glick, B.R. and J.J. Pasternak (1989). Isolation, characterization and manipulation of cellulase
genes. Biotechnol. Adv., 7, 361–386.
Gong, C.S., M.R. Ladisch and G.T. Tsao (1977). Cellobiase from Trichoderma viride: purification,
properties, kinetics, and mechanism. Biotechnol. Bioeng., 19, 959–981.
Gong, C.S., N.J. Cao, J. Du, G.T. Tsao (1999). Ethanol production from renewable resources.
Advances in Biochemical Engineering/Biotechnology, 65, 207–241.
References 125
Gonzalez, G., G. Caminal, C. de Mas, Lopez-Santin (1989). A kinetic model pretreated wheat straw
saccharification by cellulose. J Chem Technol Biotechnol, 44, 275– 288.
Graf, A. and T. Koehler (2000). Oregon Cellulose-Ethanol Study. Oregon Office of Energy. Salem
OR (USA).
Greenergy International Limited. Bioethanol–a greenergy perspective. London (2007)
http://www.greenergy.com (last accessed October 2009)
Gregg, D., J. Saddler (1995). Bioconversion of lignocellulosic residue to ethanol: process flowsheet
development. Biomass and Bioenergy, 9 (1– 5), 287–302.
Gregg, D.J., A. Boussaid, J.N. Saddler (1998). Techno-economic evaluation of a generic wood-
ethanol process: effect of increased cellulose yields and enzyme recycle. Bioresour Technol,
63, 7-12.
Gregg, D.J., J.N. Saddler (1996). Factors affecting cellulose hydrolysis and the potential of enzyme
recycle to enhance the efficiency of an integrated wood to ethanol process. Biotechnol. Bioeng,
51, 375-383.
Grethlein, A.J., M.K. Jain (1993). Bio-processing of coal-derived synthesis gases by anaerobic
bacteria. Trends Biotechnol., 10, 418-423.
Grethlein, H.E. (1985). The effect of pore size distribution on the rate of enzymatic hydrolysis of
cellulose substrates. Bio/Technology, 3, 155–160.
Grethlein, H.E., D.C. Allen, A.O. Converse (1984). A comparative stdy of the enzymatic hydrolysis
of the acid-pretreated white pine and mixed hardwood, Biotechnol. Bioeng, 26, 1498-1505.
Gueret, C., M. Daroux and F. Billaud (1997). Methane pyrolysis: thermodynamics, Chem Eng Sci,
5, 815–827.
Gulati, M., P.J. Westgate, M. Brewer, R. Hendrickson and M.R. Ladisch (1996). Sorptive recovery
of dilute ethanol from distillation column bottoms stream, Applied Biochemistry and
Biotechnology, 57/58, 103–119.
Gunata, Z. and M.J. Vallier (1999). Production of a highly glucose-tolerant extracellular β-
glucosidase by three Aspergillus strains. Biotechnol. Lett., 21, 219–223.
Guo, G.L., W.H. Chen, L.C. Men, W.S. Hwang (2008). Characterization of dilute acid pretreatment
of silvergrass for ethanol production. Bioresource Technol, 99, 6046-6053.
Gusakov, A.V., A.P. Sinitsyn (1992). A theoretical analysis of cellulase product inhibition: effect of
cellulase binding constant, enzyme/substrate ratio, and h-glucosidase activity on the inhibition
pattern. Biotechnol Bioeng, 40, 663– 671.
Gusakov, A.V., A.P. Sinitsyn, A.A. Klyosov (1985a). Kinetics of the enzymatic hydrolysis of
cellulose. 1. A mathematical model for a batch reactor process. Enzyme Microb Technol, 7,
346–352.
Gusakov, A.V., A.P. Sinitsyn, A.A. Klyosov (1985b). Kinetics of the enzymatic hydrolysis of
cellulose. 2. A mathematical model for process in a plugflow column reactor. Enzyme Microb
Technol, 7, 383– 388.
126 References
Gusakov, A.V., A.P. Sinitsyn, J.A. Manenkova and O.V. Protas (1992). Enzymatic saccharification
of industrial and agricultural lignocellulosic wastes—main features of the process. Appl.
Biochem. Biotechnol., 34–35, 625–637.
Gusakov, A.V., A.P. Sinitsyn, V.B. Gerasimas, R.Y. Savitskene, Y.Y. Steponavichus (1985c). A
product inhibition study of cellulases from Trichoderma longibrachiatum using dyed cellulose.
J Biotechnol, 3, 167– 174.
Hahn-Hägerdal, B., M. Galbe, M.F. Gorwa-Grauslund and G. Zacchi (2006). Bioethanol – the fuel
of tomorrow from the residues of today, Trends Biotechnol, 24, 549–556.
Hamelinck, C. N. and A.P.C. Faaij (2005). Outlook for advanced biofuels, Energy Policy, 34,
3268–3283.
Hamelinck, C. N., G. van Hooijdonk e A. Faaij (2005). Ethanol from lignocellulosic biomass:
techno-economic performance in short-, middle- and long-term. Biomass and Bioenergy, 28,
384-410.
Hamelinck, C.N. and A.P.C. Faaij (2001). Future prospects for production of methanol and
hydrogen from biomass. Report NWS-E-2001-49, Utrecht University, Utrecht (The
Netherlands).
Hammerschlag, R. (2006). Ethanol's energy return on investment. A survey of the literature 1990–
present, Environ Sci Technol, 40, 1744–1750.
Henrissat, B., B. Vigny, S. Perez (1988a). Possible adsorption sites of cellulases on crystalline
cellulose. FEBS Lett, 231, 177– 182.
Henrissat, B., H. Driguez, C. Viet, M. Schülein (1985). Synergism of cellulases from Trichoderma
reesei in the degradation of cellulose. Bio/Technology, 3, 722–726.
Henrissat, B., T.T. Teeri and R.A.J. Warren (1998b). A scheme for designating enzymes that
hydrolyse the polysaccharides in the cell walls of plants. FEBS Lett., 425, 352–354.
Himmel M.E., M.F. Ruth, C.E. Wymand (1999). Cellulase for commodity products from cellulosic
biomass. Current Opinion in Biotechnology, 10, 358-364.
Hinman, N.D., D.J. Schell, C.J. Riley, P.W. Bergeron and P.J. Walter (1992). Preliminary estimate
of the cost of ethanol production for SSF technology, Appl Biochem Biotechnol, 34–35, 639–
649.
Holtzapple, M., M. Cognata, Y. Shu and C. Hendrickson (1990). Inhibition of Trichoderma reesei
cellulase by sugars and solvents. Biotechnol. Bioeng., 36, 275–287.
Holtzapple, M.T., H.S. Caram, A.E. Humphrey (1984a). The HCH-1 model of enzymatic cellulose
hydrolysis. Biotechnol Bioeng, 26, 775– 780.
Holtzapple, M.T., H.S. Caram, A.E. Humphrey (1984b). Determining the inhibition constants in the
HCH-1 model of cellulose hydrolysis. Biotechnol Bioeng, 26, 735–757.
Holtzapple, M.T., H.S. Caram, A.E. Humphrey (1984c). A comparison of two empirical models for
the enzymatic hydrolysis of pretreated poplar wood. Biotechnol Bioeng, 26, 936–941.
Howell, J.A., J.D. Stuck (1975). Kinetics of Solka Floc cellulose hydrolysis by Trichoderma viride
cellulase. Biotechnol Bioeng 17:873– 893.
References 127
Howell, J.A., J.D. Stuck (1975). Kinetics of Solka Floc cellulose hydrolysis by Trichoderma viride
cellulase. Biotechnol Bioeng, 17, 873– 893.
Huang, A.A. (1975). Kinetic studies on insoluble cellulose-cellulase system. Biotechnol Bioeng, 17,
1421–1433.
Jacquet, F., L.Bamiere, J.C. Bureau, L. Guinde (2007). Recent developments and prospects for the
production of biofuels in the EU: can they really be “part of solution”? In: Proceedings of the
conference on “biofuels, food and feed tradeoffs”, Missouri (U.S.A.), April 12–13th.
Jaques, K., T.P. Lyons, D.R. Kelsall. (2003). The alcohol textbook – A reference for the beverage,
fuel and industrial alcohol industries. (K. Jaques, T.P. Lyons, D.R. Kelsall Editors),
Nottingham (U.K.).
Jefferson, M. (2006). Sustainable energy development: performance and prospects. Renew Energy,
31, 571–82.
Jeoh, T., D.B. Wilson, L.P. Walker (2002). Cooperative and competitive binding in synergistic
mixtures of Thermobifida fusca cellulases Cel5A, Cel6B, and Cel9A. Biotechnol Prog, 18,
760–769.
Jusarek, L. (1979). Enzymic hydrolysis of pretreated aspen wood. Dev. Indust. Microb., 20, 177-
183.
Kadam, K.L., E.C. Rydholm, J.D. McMillan (2004). Development and validation of a kinetic model
for enzymatic saccharification of lignocellulosic biomass, Biotechnol Progr, 20, 698-705.
Karrer, P., P. Schubert, W. Whrli (1925). Polysaccharide XXXIII: uber enzymatischen abbau von
kunstseide und nativer cellulose. Helv Chim Acta, 8, 797– 810.
Kaster, J.A., D.L. Michelsen, W.H. Velander (1990). Increased Oxygen Transfer in a Yeast
Fermentation Using a Microbubble Dispersion. Appl. Biochem. Biotechnol., 24-25, 469-484.
Kaylen, M., D. Van Dyne, Y.-S. Choi and M. Blasé (2000). Economic feasibility of producing
ethanol from lignocellulosic feedstocks. Bioresource Technology, 72, 19–32.
Kilpinen, P., M. Hupa and J. Leepälahti (1991). Nitrogen chemistry at gasification – a
thermodynamic analysis Report 91-14, Combustion Chemistry Research Group, Abo Academi
University, Finland.
Kim D.W., Y.H. Jang, J.K. Jeong (1998). Adsorption kinetics and behaviour of two
cellobiohydrolases from Trichoderma reesei on microcrystalline cellulose. Biotechnol Appl
Biochem, 27, 97–102.
Kim, D.W., T.S. Kim, Y.K. Jeong, J.K. Lee (1992). Adsorption kinetics and behaviours of cellulase
components on microcrystalline cellulose. J Ferm Bioeng, 73, 461-466.
Kim, D.W., Y.K. Jeong, Y.H. Jang, and J.K. Lee (1994). Purification and characterization of
endoglucanase and exoglucanase components from Trichoderma viride. J. Ferment. Bioeng.,
77, 363–369.
Kim, S. and B.E. Dale (2004). Global potential bioethanol production from wasted crops and crop
residues, Biomass Bioenergy, 26, 361–375.
Klass, D.L. (1998) Biomass for renewable energy, fuels, and chemicals, Academic Press, San
Diego (U.S.A.).
128 References
Kleywegt, G.J., J.Y. Zou, C. Divne, G.J. Davies, I. Sinning, J. Ståhlberg, T. Reinikainen, M.
Srisodsuk, T.T. Teeri and T.A. Jones (1997). The crystal structure of the catalytic core domain
of endoglucanase I from Trichoderma reesei at 3.6 Å resolution, and a comparison with related
enzymes. J. Mol. Biol., 272, 383–397.
Klyosov, A.A (1990). Trends in biochemistry and enzymology of cellulose degradation.
Biochemistry, 29, 10577–10585.
Knauf, G., J. Maier, N. Skuce, A. Sugrue (2005). The challenge of sustainable bioenergy: balancing
climate protection, biodiversity and development policy. A discussion paper, Forum
Entwicklung und Umwelt, Bonn (Germany).
Kojima, M., D. Mitchell, W. Ward (2007). Considering trade policies for liquid biofuels. Energy
Sector Management Assistance Program, Special Report 004/07, World Bank, Washington,
DC (U.S.A.).
Koullas, D.P., P. Christakopoulos, D. Kekos, B.J. Macris, E.G. Koukios (1992). Correlating the
effect of pretreatment on the enzymatic hydrolysis of straw. Biotechnol Bioeng, 39, 113– 116.
Krassig, H.A. (1993). Cellulose: structure, accessibility and reactivity. Gordon & Breach Yverdon
(Switzerland).
Kristensen, J., L. Thygesen, C. Felby, H. Jørgensen, T. Elder (2008). Cell-wall structural changes in
wheat straw pretreated for bioethanol production. Biotechnol Biofuels, 16, 1-5.
Kubicek, C.P. and M.E. Penttilä (1998). Regulation of production of plant polysaccharide
degrading enzymes by Trichoderma, p. 49–72. In: Trichoderma and Gliocladium vol. 2 (G. E.
Harman and C. P. Kubicek, Ed.), Taylor & Francis Ltd., London (United Kingdom).
Kyriacou, A., R.J. Neufeld, C.R. MacKenzie (1988). Effect of physical parameters on the
adsorption characteristics of fractionated Trichoderma reesei cellulase components. Enzyme
Microb Technol, 10, 675–681.
Ladisch, M.R. and K. Dyck (1979). Dehydration of ethanol: new approach gives positive energy
balance, Science, 205, 898–900.
Ladisch, M.R., J. Hong, M. Voloch, G.T. Tsao (1981). Cellulase kinetics. In: Hollaender A, Rabson
R, Rogers, P., A. San Pietro, R. Valentine, R. Wolfe (). Trends in the biology of fermentations
for fuels and chemicals. New York (U.S.A.). p 55– 83.
Ladisch, M.R., M. Voloch, J. Hong, P. Bienkowski and G.T. Tsao (1984). Cornmeal Adsorber for
Dehydrating Ethanol Vapors, I&EC Process Design and Development, 23, 437–443.
Latif, F. and M.I. Rajoka (2001). Production of ethanol and xylitol from corn cobs by yeasts,
Bioresource Technology, 77, 57–63
Lawford, H.G., J.D. Rousseau (2003). Cellulosic fuel ethanol. Alternative fermentation process
designs with wild-type and recombinant Zymomonas mobilis. Applied Biochemistry and
Biotechnology, 105–108, 457–469.
Leathers, T.D. (2003). Bioconversions of maize residues to value-added coproducts using yeast-like
fungi, FEMS Yeast Research 3, 133–140.
Lee, J. (1997). Biological conversion of lignocellulosic biomass to ethanol, J. biotechnol, 56, 1-24.
References 129
Lee, N.E., and J. Woodward (1989). Kinetics of the adsorption of Trichoderma reesei C30 cellulase
to DEAE-Macrosorb. J. Biotechnol., 11, 75–82.
Lee, S.B., H.S. Shin, D.D.Y. Ryu (1982). Adsorption of cellulase on cellulose: effect of
physiochemical properties of cellulose on adsorption and rate of hydrolysis. Biotechnol
Bioeng, 24, 2137– 2153.
Lee, S.B., I.H. Kim, S.S.Y. Ryu, H. Taguchi (1983). Structural properties of cellulose and cellulase
reaction mechanism. Biotechnol Bioeng, 25, 33-52.
Lee, Y.-H. and L. T. Fan (1983). Kinetic studies of enzymatic hydrolysis of insoluble cellulose. II.
Analysis of extended hydrolysis times. Biotechnol. Bioeng. 25, 939–966.
Lee, Y.-H., L.T. Fan (1982). Kinetic studies of enzymatic hydrolysis of insoluble cellulose: analysis
of the initial rates. Biotechnol Bioeng, 24, 2383–2406.
Lee, Y.L. and J.M. Sanchez (1997). Theoretical study of thermodynamics relevant to
tetramethylsilane pyrolysis, J Cryst Growth, 178, 513–517.
Lehtio, J., J. Sugiyama, M. Gustavsson, L. Fransson, M. Linder, T.T. Teeri (2003). The binding
specificity and affinity determinants of family 1 and family 3 cellulose binding modules. Proc
Natl Acad Sci USA, 100, 484– 489.
Lenze, J., H. Esterbauer, W. Sattler, J. Schurz, E. Wrentschur (1990). Changes of structure and
morphology of regenerated cellulose caused by acid and enzymatic hydrolysis. J Appl Poly
Sci, 41, 1315– 1326.
Lin, J.K., M.R. Ladisch, J.A. Patterson and C.H. Noller (1987). Structural properties of cellulose
and cellulase reaction mechanism. Biotechnol. Bioeng., 29, 976–981.
Lin, Y., S. Tanaka (2006). Ethanol fermentation from biomass resources: current state and
prospects. Applied Microbiology and Biotechnology, 69, 627–642.
Linde, M., M. Galbe and G. Zacchi (2008). Bioethanol production from non-starch carbohydrate
residues in process streams from a dry-mill ethanol plant, Bioresour Technol , 99, 6505–6511.
Linde, M., M. Galbe, G. Zacchi (2006). Steam pretreatment of acid-sprayed and acid-soaked barley
straw for production of ethanol, Appl. Biochem. Biotechnol., 129-132, 564-562.
Linder, M., and T. T. Teeri (1996). The cellulose-binding domain of the major cellobiohydrolase of
Trichoderma reesei exhibits true reversibility and a high exchange rate on crystalline cellulose.
Proc. Natl. Acad. Sci. USA, 93,12251–12255.
Linnhoff, B. and J.R. Flower (1978). Synthesis of heat exchanger networks: systematic generation
of energy optimal networks, AIChE J, 24, 633–654.
Luo, J., L. Xia, J. Lin, P. Cen (1999). Kinetics of simultaneous saccharification and lactic acid
fermentation process. Biotechnol Prog, 13, 762– 767.
Lynd, L.R. (1996). Overview and evaluation of fuel ethanol from cellulosic biomass: technology,
economics, the environment, and policy, Annual Reviews, Energy Environment, 21, 403–465.
Lynd, L.R. , R.T. Elander and C.E. Wyman (1996). Likely features and costs of mature biomass
ethanol technology, Appl Biochem Biotechnol, 57–58, 741–761.
Lynd, L.R. and M.Q. Wang (2004). A product-nonspecific framework for evaluating the potential
of biomass-based products to displace fossil fuels, J Ind Ecol, 7, 17–32.
130 References
Lynd, L.R., P.J. Weimer, W.H. van Zyl, I.S. Pretorious (2002). Microbial cellulose utilization:
fundamentals and biotechnology. Microbiology and Molecular Biology Reviews, 66, 506–577.
Mac Donald, D.G., J.F. Mathews (1979). Effect of steam treatment in the hydrolysis of aspen by
commercial enzymes. Biotech. Bioeng. 21, 1091-1096.
Mackie, K.L. (1985). Effect of sulphur dioxide and sulphuric acid on steam explosion of aspen
wood. J. Wood. Chem. Tech., 5, 405-425.
MacLean, H.L. and L.B. Lave (2003). Evaluating automobile fuel/propulsion system technologies,
Prog Energy Combus Sci, 29, 1–69.
Magnusson, H. (2005). Process simulation in Aspen Plus of an integrated ethanol and CHP plant.
Master thesis in Energy Engineering. Umea University (Sweden).
Malça, J. and F. Freire (2006). Renewability and life-cycle energy efficiency of bioethanol and bio-
ethyl tertiary butyl ether (bioETBE): assessing the implications of allocation, Energy, 31,
3362–3380.
Mandels, M. and E.T. Reese (1957). Induction of cellulase in Trichoderma viride as influenced by
carbon sources and metals. J. Bacteriol., 73, 269–278.
Mandels, M., J. Kostick, R. Parizek (1971). The use of adsorbed cellulase in the continuous
conversion of cellulose to glucose. J Polymer Sci, 36, 445– 459.
Mandfield, S.D., C. Mooney, J.N. Saddler (1999). Substrates and enzyme characteristics that limit
cellulose hydrolysis. Biotechnol Prog, 15, 804– 816.
Marshall, K., D. Sixsmith (1974). Some physical characteristics of microcrystalline cellulose.
Powders for pharmaceutical use. Drug Dev Commun, 1, 51-71.
Mason, WH. (1927). Apparatus for and process of explosion fibration of lignocellulosic material.
U.S. Patent no. 1655618 (10 January 1929).
McAloon, A., F. Taylor, W. Yee, K. Ibsen, R. Wooley (2000). Determining the cost of producing
ethanol from corn starch and lignocellulosic feedstocks. Technical Report NREL/TP-580-
28893. National Renewable Energy Laboratory, Golden, CO (U.S.A.), 35pp.
McCormick-Brennan, K., C. Bomb, E. Deurwaarder and T. Kåberger (2007). Biofuels for transport
in Europe: lessons from Germany and the UK, Energy Policy, 35, 2256–2267.
McLaren, J.S. (2005). Crop biotechnology provides an opportunity to develop a sustainable future,
Trends in Biotechnology, 23, 339–342.
McMillan, M.M., D.W. Newman (1999). Templeton and A. Mohagheghi, Simultaneous
saccharification and cofermentation of dilute-acid pretreated yellow poplar hardwood to
ethanol using xylose-fermenting Zymomonas mobilis, Applied Biochemistry and
Biotechnology, 77–79, 649–665.
Medve, J., J. Karlsson, D. Lee, F. Tjerneld (1998). Hydrolysis of microcrystalline cellulose by
cellobiohydrolase I and endoglucanase II from Trichoderma reesei: adsorption, sugar
production pattern and synergism of the enzymes. Biotechnol Bioeng, 59, 621–634.
Medve, J., J. Ståhlberg and F. Tjerneld (1994). Adsorption and synergism of cellobiohydrolase I
and cellobiohydrolase II of Trichoderma reesei during hydrolysis of microcrystalline cellulose.
Biotechnol. Bioeng., 44, 1064–1073.
References 131
Medve, J., J. Ståhlberg, F. Tjerneld (1997). Isotherms for adsorption of cellobiohydrolase I and II
from Trichoderma reesei on microcrystalline cellulose. Applied Biochem and Biotechnol, 66,
39-56.
Messner, R., K. Hagspiel and C.P. Kubicek (1990). Isolation of a β-glucosidase- binding and
activating polysaccharide from cell walls of Trichoderma reesei. Arch. Microbiol., 154, 150–
155.
Michalowicz, G., B. Toussaint, M.R. Vignon (1991). Ultrastructural changes in poplar cell wall
during steam explosion treatment. Holzforschung, 45, 175-179.
Mielenz, J.R. (1997). Feasibility studies for biomass-to-ethanol production facilities in Florida and
Hawaii. Renewable Energy, 10 (2/3), 279–284.
Millett, M.A., M.J. Effland, D.P. Caulfield (1979). Influence of fine grinding on the hydrolysis of
cellulosic materials––acid versus enzymatic, Advances in Chemistry Series, 181, 71–89.
Mississippi Ethanol LCC (2002). Final report from Mississippi Ethanol LLC to the National
Renewable Energy Laboratory. Report NREL/SR-510-31720, NREL, Golden, CO (U.S.A.)
Miyamoto, S., K. Nisizawa (1942). Model for cellulose hydrolysis by cellulase. J Vet Soc Arm Jpn,
396, 778– 784.
Monique, H., A. Faaij, R. van den Broek, G. Berndes, D. Gielen, W. Turkenburg (2003)
Exploration of the ranges of the global potential of biomass for energy. Biomass Bioenergy,
25, 119–133.
Mooney, C., S. Mandfield, M. Touhy, J. Saddler (1998). The effect of the initial pore volume and
lignin content on the enzymatic hydrolysis of softwoods. Bioresource Technol, 64, 113-119.
Mosier, N., C. Wyman, B. Dale, R. Elander, Y.Y. Lee, M. Holtzapple, M. Ladisch (2005). Features
of promising technologies for pretreatment of lignocellulosic biomass. Bioresource Technol,
96, 673-686.
Mosier, N.S., P. Hall, C.M. Ladisch and M.R. Ladisch (1999). Reaction kinetics, molecular action,
and mechanisms of cellulolytic proteins. Adv. Biochem. Eng. Biotechnol., 65, 23–40.
Mulder, K. and N.J. Hagens (2008). Energy return on investment: toward a consistent framework,
Ambio, 37, 74–79.
Nagle, N., K. Ibsen, E. Jennings (1999). A process economic approach to develop a dilute-acid
cellulose hydrolysis process to produce ethanol from biomass. Applied Biochemistry and
Biotechnology, 77–79, 595–607.
Naik, S.N., V.V. Goud, P.K. Rout, A.K. Dalai (2010). Production of first and second generation
biofuels: A comprehensive review. Renewable and Sustainable Energy Reviews, 14, 578-597.
Neuman, R.P., L.P. Walker (1992). Solution exclusion from cellulose in packed columns; process
modeling and analysis. Biotechnol Bioeng, 40, 226– 234.
Neureiter, M., H. Danner, C. Thomasser, B. Saidi, R. Braun (2002). Dilute acid hydrolysis of
sugarcane bagasse at varying conditions. Appl. Biochem. Biotechnol., 98-100, 49-58.
Nexant Inc. (2005). Equipment design and cost estimation for small modular biomass systems,
synthesis gas cleanup, and oxygen separation equipment, task 9: mixed alcohols from syngas
state of technology. For National Renewable Energy Laboratory, Golden, CO (U.S.A.).
132 References
Nguyen, Q.A., J.N. Saddler (1991). An integrated model for the technical and economic evaluation
of an enzymatic biomass conversion process, Bioresour Technol, 35, 275-282.
Nguyen, Q.A., J.H. Dickow, B.W. Duff, J.D. Farmer, D.A. Glassner, K.N. Ibsen, M.F. Ruth, , D.J.
Schell, I.B. Thompson, M.P. Tucker (1996). NREL/DOE ethanol pilot-plant: current status and
capabilities. Bioresource Technology, 58, 189–196.
Nidetzky, B. and W. Steiner (1993). A new approach for modeling cellulase-cellulose adsorption
and the kinetics of the enzymatic hydrolysis of microcrystalline cellulose. Biotechnol. Bioeng.,
42, 469-479.
Nidetzky, B., W. Steiner, M. Hayn, M. Claeyssens (1994a). Cellulose hydrolysis by the cellulase
from Trichoderma reesei: a new model for synergistic interaction. Biochem J, 298, 705– 710.
Nidetzky, B., W. Zachariae, G. Gercken, M. Hayn, and W. Steiner (1994b). Hydrolysis of
cellooligosaccharides by Trichoderma reesei cellobiohydrolases. Experimental data and
kinetic modeling. Enzyme Microb. Technol., 16, 43–52.
Nieves, R.A., C.I. Ehrman, W.S. Adney, R.T. Elander and M.E. Himmel (1998). Technical
communication: survey and analysis of commercial cellulase preparations suitable for biomass
conversion to ethanol. World J. Microbiol. Biotechnol., 14, 301–304.
Nogawa, M., M. Goto, H. Okada and Y. Morikawa (2001). L-Sorbose induces cellulase gene
trancription in the cellulolytic fungus Trichoderma reesei. Curr. Genet., 38, 329–334.
Norde, W., C.A. Haynes (1995). Reversibility and mechanism of protein adsorption. In: Proteins at
Interfaces II, Fundamentals and Applications (Horbett TJ, Brash JL Eds.), ACS Symposium
Series 602, American Chemical Society, Washington, DC (U.S.A.).
Nutor, J.R.K., A.O. Converse (1991). The effect of enzyme and substrate levels on the specific
hydrolysis rate of pretreated poplar wood. Appl Biochem Biotechnol, 28/29, 75– 81.
Oh, K.-K., S.-W. Kim, Y.-S. Jeong, S.-I. Hong (2001). Bioconversion of cellulose into ethanol by
nonisothermal simultaneous saccharification and fermentation. Appl Biochem Biotechnol, 89,
15–30.
Öhgren, K., G. Zacchi, M. Galbe (2005), Optimisation of steam pretreatment of SO2 impregnated
corn stover for fuel ethanol production. Appl. Biochem. Biotechnol., 121-124, 1055-1067.
Öhman, M., C. Boman, H. Hedman and R. Eklund (2006). Residential combustion performance of
pelletized hydrolysis residue from lignocellulosic ethanol production, Energy and Fuels, 20,
1298–1304.
Ohmine, K., H. Ooshima, Y. Harano (1983). Kinetic study of enzymatic hydrolysis of cellulose by
cellulase from Trichoderma viride. Biotechnol Bioeng, 25, 2041–2053.
Okazaki M., M. Moo-Young (1978). Kinetics of enzymatic hydrolysis of cellulose: analytical
description of a mechanistic model. Biotechnol Bioeng, 20, 637– 663.
Oliveria, M.E.D., B.E. Vaughan and E.J. Rykiel Jr. (2005). Ethanol as fuel: energy, carbon dioxide
balances, and ecological footprint, Bioscience, 55, 593–602.
Ooshima, H., D.S. Burns, A.O. Converse (1990). Adsorption of cellulase from Trichoderma reesei
on cellulose and lignacious residue in wood pretreated by dilute sulfuric acid with explosive
decompression. Biotechnol Bioeng, 36,446–452.
References 133
Ooshima, H., K. Ohime, Y. Ishitani, Y. Harano (1982). Applicability of an empirical rate
expression to enzymatic hydrolysis of cellulosic materials. Biotechnol Lett, 4, 729– 734.
Ooshima, H., M. Kurakake, J. Kato, Y. Harano (1991). Enzymatic activity of cellulase adsorbed on
cellulose and its change during hydrolysis. Appl Biochem Biotechnol, 31, 253– 266.
Ooshima, H., M. Sakata, Y. Harano (1983). Adsorption of cellulase from Trichoderma viride on
cellulose. Biotechnol Bioeng, 25, 3103-3104.
Ozcimen, D., F. Karaosmanoglu (2004). Production and characterization of bio-oil and biochar
from rapeseed cake. Renew Energy, 29, 779–87.
Palonen, H., F. Tjerneld, G. Zacchi, M. Tenkanen (2004). Adsorption of Trichoderma reesei CBH I
and EG II and their catalytic domains on steam pretreated softwood and isolated lignin. J
Biotechnol, 107, 65-72.
Palonen, H., M. Tenkanen and M. Linder (1999). Dynamic interaction of Trichoderma reesei
cellobiohydrolases Ce16A and Ce17A and cellulose at equilibrium and during hydrolysis.
Appl. Environ. Microbiol., 65, 5229–5233.
Pan, X., C. Arato, N. Gilkes, D. Gregg, W. Mabee, K. Pye, Z. Xiao, X. Zhang, J. Saddler (2005).
Biorefining of softwoods using ethanol organosolv pulping: preliminary evaluation of process
streams for manufacture of fuel-grade ethanol and co-products. Biotechnology and
Bioengineering, 90 (4), 473–481.
Peitersen, N., E.W. Ross (1979). Mathematical model for enzymatic hydrolysis and fermentation of
cellulose by Trichoderma. Biotechnol Bioeng, 21, 997– 1017.
Philippidis, G.P. and C. Hatzis (1997). Biochemical engineering analysis of critical process factors
in the biomass-to-ethanol technology, Biotechnology Progress, 13, 222–231.
Philippidis, G.P., D.D. Spindler, C.E. Wyman (1992). Mathematical modelling of cellulose
conversion to ethanol by the simultaneous saccharification and fermentation process. Appl
Biochem Biotechnol, 34/35, 543–556.
Philippidis, G.P., T. K. Smith, C.E. Wyman (1993). Study of the enzymatic hydrolysis of cellulose
for production of fuel ethanol by the simultaneous saccharification and fermentation process.
Biotechnol Bioeng, 41, 846–853.
Phillips, S., A. Aden, J. Jechura, and D. Dayton (2007). Thermochemical ethanol via indirect
gasification and mixed alcohol synthesis of lignocellulosic biomass. Technical Report
NREL/TP-510-41168, Golden, CO: National renewable Energy Laboratory.
Piccolo, C., F. Bezzo (2007). Ethanol from lignocellulosic biomass: a comparison between
conversion technologies, In: Computer-Aided Chemical Engineering 24, 17th European Symp.
on Computer Aided Process Engineering (V. Plesu and P.S. Agachi, Eds.), Elsevier,
Amsterdam, Paesi Bassi, 1277-1282.
Piccolo, C., F. Bezzo (2009). A techno-economical comparison between two technologies for
bioethanol production from lignocellulose. Biomass and Bioenergy, 33, 478-491.
Piccolo, C., G. Lidén, F. Bezzo (2009). Effect of substrate specific area on lignocellulose enzymatic
hydrolysis: An experimental and modeling investigation, In: Computer-Aided Chemical
Engineering 27, 10th International Symp. on Process Systems Engineering (R.M. Brito-Alves,
134 References
C.A. Oller do Nascimento, E.C. Biscaia Jr., Eds.), Elsevier, Amsterdam, Paesi Bassi, 1701-
1706.
Piccolo, C., M. Wiman, F. Bezzo, G. Lidén (2010). Enzyme adsorption on SO2 catalyzed steam-
pretreated wheat and spruce material. Enzyme and Microbial Technology, 46, 159-169.
Pimentel, D., and Pimentel M. (2008). Corn and Cellulosic Ethanol Cause Major Problems.
Energies, 1, 35-37.
Powelson, R. (2006). Company plans big ethanol plant in Oak Ridge. 1 May 2006 article accessed
20th September 2009 at
http://www.knoxnews.com/kns/local_news/article/0,1406,KNS_347_4664543,00.html.
Prins, M.J., K.J. Ptasinski and F.J.J.G. Janssen (2007). From coal to biomass gasification:
comparison of thermodynamic efficiency, Energy, 32, 1248–1259.
Process Systems Enterprise Ltd. (2009). gPROMS User’s Guide.
Proposal for a directive of the European Parliament and of the Council on the promotion of the use
of energy from renewable source (2008). European Commission (EC) Brussels (Belgium),
January 23.
Puls, J., T.M. Wood (1991). The degradation pattern of cellulose by extracellular cellulases of
aerobic and anaerobic microorganisms. Biores Technol, 36, 15–19.
Rabinovich, M.L., V.M. Chernoglazov, and A.A. Klesov (1983). Isoenzymes of endoglucanase in
cellulase complexes: different affinity for cellulose and different role in the hydrolysis of an
insoluble substrate. Biochemistry, 48, 321–329.
Ragauskas, A.J., C.K. Williams, B.H. Davison, G. Britovsek, J. Cairney, C.A. Eckert, W.J.
Frederick Jr., J.P. Hallett, D.J. Leak, C.L. Liotta, J.R. Mielenz, R. Murphy, R. Templer, T.
Tschaplinski (2006). The path forward for biofuels and biomaterials. Science, 311, 484-488.
Ramos, L.P., C. Breuil, J.N. Saddler (1992). Comparison of steam pretreatment of eucalyptus,
aspen, and spruce wood chips and their enzymatic hydrolysis. Appl. Biochem. Biotechnol, 34,
37-48.
Ramos, L.P., M.M. Nazhad, J.N. Saddler (1993). Effect of enzymatic hydrolysis on the morphology
and fine structure of pretreated cellulosic residues. Enzyme Microb Technol, 15, 821-831.
Reczey, K., A. Brumbauer, M. Bollok, Z. Szengyel and G. Zacchi (1998). Use of hemicellulose
hydrolysate for β-glucosidase fermentation. Appl. Biochem. Biotechnol., 70–72, 225–235.
Reese, E.T. (1956). A microbiological process report: enymatic hydrolysis of cellulose. Appl.
Microbiol., 4, 39–45.
Reese, E.T. and M. Mandels (1971). Enzymatic degradation. In: Cellulose and cellulose derivatives
(N. M. Bikales and L. Segal, Ed.), Wiley Interscience, New York (U.S.A.). pp. 1079–1094.
Reese, E.T., R.G.H. Siu, H.S. Levinson (1950). The biological degradation of soluble cellulose
derivatives and its relationship to the mechanism of cellulose hydrolysis. J Bacteriol, 59, 485-
497.
Reijnders, L. (2006). Conditions for the sustainability of biomass based fuel use. Energy Policy, 34,
863–76.
References 135
Reinikainen, T., O. Teleman, T.T. Teeri (1995). Effects of pH and high ionic strength on the
adsorption and activity of native and mutated cellobiohydrolase I from Trichoderma reesei.
Proteins, 22, 392–403.
Reith, J. H., H. den Uil, H. van Veen, W. T. A. M. de Laat, J. J. Niessen, E. de Jong, H. W.
Elbersen, R. Weusthuis, J. P. van Dijken e L. Raamsdonk (2002). Co-production of bio-
ethanol, electricity and heat from biomass residues. Presented at 12th European Conference
and Technology Exhibition on Biomass for Energy, Industry and Climate Protection,
Amsterdam, Netherlands, 17-21 giugno.
Rivers, D.B., G.H. Emert (1987). Lignocellulose pretreatment: a comparison of wet and dry ball
attrition, Biotechnology Letter, 9, 365–368.
Rostami, A.A., M.R. Hajaligol and S.E. Wrenn (2004). A biomass pyrolysis submodel for CFD
applications, Fuel, 83, 1519–1525.
Rouvinen, J., T. Bergfors, T.T. Teeri, J.K. Knowles and T.A. Jones (1990). Three-dimensional
structure of cellobiohydrolase II from Trichoderma reesei. Science, 249, 380–386.
Ruiz, R., T. Ehrman (1996). Dilute acid hydrolysis procedure for determination of total sugars in
the liquid fraction of process samples. NREL, Golden, CO (U.S.A.).
Ryu, D.D.Y., C. Kim and M. Mandels (1984). Competitive adsorption of cellulase components and
its significance in a synergistic mechanism. Biotechnol. Bioeng. 26, 488–496.
Ryu, D.D.Y., S.B. Lee (1982). Effect of compression milling on cellulose structure and on
enzymatic hydrolysis kinetics. Biotechnol Bioeng, 24, 1047– 1067.
Saddler, J.N. (1992). Biotechnology for the conversion of lignocellulosics. Biomass and Bioenergy,
2, 229–238.
Saha, B.C. (2003), Hemicellulose bioconversion, Journal of Industrial Microbiol and Biotechnol,
30, 279-291.
Sanchez, O.J. and C.A. Cardona (2008). Trends in biotechnological production of fuel ethanol
from different feedstocks, Bioresour Technol, 99, 5270–5295.
Sandgren, M., A. Shaw, T.H. Ropp, S. Wu, R. Bott, A.D. Cameron, J. Ståhlberg, C. Mitchinson and
T.A. Jones (2000). The X-ray crystal structure of the Trichoderma reesei family 12
endoglucanase 3, Cel12A, at 1.9 Å resolution. J. Mol. Biol., 308, 295–310.
Sassner, P., M. Galbe, G. Zacchi (2007). Techno-economic evaluation of bioethanol production
from three different lignocellulosic materials. Biomass. Bioen., 32, 422-430.
Sattler, W., H. Esterbauer, O. Glatter, W. Steiner (1989). The effect of enzyme concentration on the
rate of the hydrolysis rate of cellulose. Biotechnol Bioeng, 33,1221–1234.
Scheiding, W., M. Thoma, A. Ross, K. Schugerl (1984). Modeling of the enzymatic hydrolysis of
cellobiose and cellulose by a complex enzyme mixture of Trichoderma reesei QM9414. Appl
Microbiol Biotechnol, 20, 176– 182.
Schell, D.J., C.J. Riley, N. Dowe, J. Farmer, K.N. Ibsen, M.F. Ruth, S.T. Toon, R.E. Lumpkin
(2004). A bioethanol process development unit: initial operating experiences and results with a
corn fiber feedstock. Bioresource Technology, 91, 179–188.
136 References
Schnepf, R. (2006). European Union biofuels policy and agriculture: an overview. Congressional
Research Service Report, RS22404, Washington, DC (U.S.A.), March 16th .
Schurz, J., J. Billiani, A. Honel, W.D. Eigner, A. Jànosi, M. Hayn, H. Esterbauer (1985).
Reaktionsmechanismus und Strukturnderungen beim enzymatischen Abbau von Cellulose
durch Trichoderma-reesei-Cellulase. Acta Polymer, 36, 76–80.
Schwald, W., H.H. Brownell, J.N. Saddler (1988). Enzymatic hydrolysis of steam treated aspen
wood: Influence of partial hemicellulose and lignin removal prior to pretreatment. J Wood
Chem Technol, 8, 543-560.
Sheehan, J. and M. Himmel (1999). Enzymes, energy, and the environment: a strategic perspective
on the U.S. Department of Energy’s research and development activities for bioethanol.
Biotechnol. Prog., 15, 817–827.
Sheehan, J., V. Cambreco, J. Duffield, M. Garboski, H. Shapouri (1998). An overview of biodiesel
and petroleum diesel life cycles. A report by US Department of Agriculture and Energy, p. 1–
35.
Shimizu, K. (1991), Chemistry of Hemicellulose, chapter 5 in Hon D.N.S. and Shiraishi N.: Wood
and cellulosic chemistry (Marcel Dekker, inc., New York and Basel).
Sin, G., A.S. Meyer, K.V. Gernaey (2009). Are Mechanistic Cellulose-Hydrolysis Models Reliable
for Use in Biofuel Process Design? - Identifiability and Sensitivity Analysis. In: Proceedings
of FOCAPD-2009, 7th International Conference on Foundations of Computer-Aided Process
Design (M. El-Halwagi and A. Linninger, Eds.) Taylor & Francis, London, UK, pp. 93-106.
Singh, A., P.K.R. Kumar and K. Schugerl (1991). Adsorption and reuse of cellulases during
saccharification of cellulosic materials. J. Biotechnol. 18, 205–212.
Sinitsyn, A.P., A.V. Gusakov, E.Y. Vlasenko (1991). Effect of structural and physico-chemical
features of cellulosic substrates on the efficiency of enzymatic hydrolysis. Appl Biochem and
Biotechnol, 30, 43-59.
Sinitsyn, A.P., O.V. Mitkevich, A.V. Gusakov (1989). Decrease in reactivity and change of
physico-chemical parameters of cellulose in the course of enzymatic hydrolysis. Carbohydr
Polymer, 10, 1– 14.
Sluiter, A., B. Hames, R. Ruiz, C. Scarlata, J. Sluiter, D. Templeton, D. Crocker (2008).
Determination of structural carbohydrates and lignin in biomass. Technical Report NREL/TP-
510-42618 NREL, Golden, CO (U.S.A.) http://devafdc.nrel.gov/pdfs/9572.pdf.
Smith, A.M. (2008). Prospects for increasing starch and sucrose yields for bioethanol production,
Plant J, 54, 546–558.
Solomon, B.D., J.R. Barnes, K.E. Halvorsen (2007). Grain and cellulosic ethanol: history,
economics, and energy policy. Biomass and Bioenergy, 31, 416-425.
South, C.R., D.A. Hogsett and L.R. Lynd (1993). Continuous fermentation of cellulosic biomass to
ethanol, Applied Biochemistry and Biotechnology, 39/40, 587–600.
South, C.R., D.A.L. Hogsett and L.R. Lynd (1995). Modeling simultaneous saccharification and
fermentation of lignocellulose to ethanol in batch and continuous reactors, Enzyme and
Microbial Technology, 17, 797–803.
References 137
Spath, P.L. and D.C. Dayton (2003). Preliminary screening – technical and economic assessment of
synthesis gas to fuels and chemicals with emphasis on the potential for biomass-derived
syngas. Report NREL/TP-510-34929, NREL, Golden, CO (U.S.A.).
Steiner, W., W. Sattler, H. Esterbauer (1988). Adsorption of Trichoderma reesei cellulase on
cellulose experimental-data and their analysis by different equations, Biotechnol Bioeng, 32,
853– 865.
Stenberg, K., C. Tengborg, M. Galbe, G. Zacchi (1998). Optimization of Steam Pretreatment of
SO2- Impregnated Mixed Softwoods for Ethanol Production. J Chem Technol Biotechnol, 71,
299-308.
Sternberg, D., P. Vijayakumar and E.T. Reese (1977). β-Glucosidase: microbial production and
effect on enzymatic hydrolysis of cellulose. Can. J. Microbiol., 23, 139–147.
Stevens, D.J., M. Wörgetter, J. Saddler (2004). Biofuels for transportation: an examination of
policy and technical issues. IEA Bioenergy Task 39, Liquid Biofuels Final Report 2001–2003,
Paris (France).
Stone, J.E., A.M. Scallan, E. Donefer, E. Ahlgren (1969). Digestibility as a simple function of a
molecule of a similar size to a cellulase enzyme. Adv Chem Ser, 95, 219–241.
Strategic energy review – an energy policy for Europe (2007). European Commission (EC),
Brussels (Belgium), January 10th .
Strobel, H.J., F.C. Caldwell, and K.A. Dawson (1995). Carbohydate transport by the anaerobic
thermophilic Clostridium thermocellum LQRI. Appl. Environ. Microbiol., 61, 4012–4015.
Stutzenberger, F. and G. Lintz. (1986). Hydrolysis products inhibit adsorption of Trichoderma
reesei C30 cellulases to protein-extracted lucerne fibres. Enzyme Microb. Technol., 8, 341–
344.
Ståhlberg, J., G. Johandson, G. Pettersson (1991). A new model for enzymatic hydrolysis of
cellulose based on the two domain-structure of cellobiohydrolase I. Bio/Technology, 9, 286-
290.
Suga, K., G. van Dedem, M. Moo-Young (1975). Degradation of polysaccharides by endo and exo
enzymes: a theoretical analysis. Biotechnol Bioeng, 17, 433– 439.
Sun, Y., J. Cheng (2002). Hydrolysis of lignocellulosic materials for ethanol production: a review.
Biores Technol, 83, 1– 11.
Sutcliffe R, J. Saddler (1986). The role of lignin in the adsorption of cellulases during enzymatic
treatment of lignocellulosic material. Biotechnol Bioeng, 17, 749-762.
Szengyel, Z. (2000). Ethanol from wood—Cellulase enzyme production. PhD thesis, Lund
University/Chemical Engineering Department at Lund (Sweden).
Söderström J., L. Pilcher, M. Galbe, G. Zacchi (2002). Two step steam pretreatment of softwood
with SO2 impregnation for ethanol production, Appl. Biochem. Biotechnol, 98-100, 5-21.
Takagi, M., S. Abe, S. Suzuki, G.H. Emert and N. Yata (1977). A method for production of ethanol
directly from cellulose using cellulase and yeast. In: Proceedings of Bioconversion
Symposium,T.K. Ghose, Editor, IIT, Delhi (India), pp. 551–571.
138 References
Takashima, S., A. Nakamura, M. Hidaka, H. Masaki and T. Uozumi (1999). Molecular cloning and
expression of the novel fungal beta-glucosidase genes from Humicola grisea and Trichoderma
reesei. J. Biochem., 125, 728– 736.
Tassinari, T., C. Macy, L. Spano (1982). Technology advances for continuous compression milling
pretreatment of lignocellulosics for enzymatic hydrolysis, Biotechnology and Bioengineering
24, 1495–1505.
Teeri, T.T. (1997). Crystalline cellulose degradation: new insight into the function of
cellobiohydrolases. Trends Biotechnol., 15, 160–167.
Teeri, T.T., A. Koivula, M. Linder, G. Wohlfahrt, C. Divne and T. A. Jones (1998a). Trichoderma
reesei cellobiohydrolases: why so efficient on crystalline cellulose? Biochem. Soc. Trans., 26,
173–178.
Teeri, T.T., A. Koivula, M. Linder, G. Wohlfahrt, L. Ruohonen, J. Lehtio, T. Reinikainen, M.
Srisodsuk, K. Kleman-Leyer, T.K. Kirk, T.A. Jones (1998b). Cellulose-cellulase interactions
of native and engineered cellobiohydrolases from Trichoderma reesei. In: Carbohydrates from
Trichoderma reesei and other mciroorganisms: structures, biochemistry, genetics and
applications (Claeyssens M, Nerinckx W, Piens K, editor), Cambridge (U.K.), p 3 –12.
Thompson, D.N., H.C. Chen, H.E. Grethlein (1992). Comparison of pretreatment methods on the
basis of available surface area. Bioresource Technol, 39, 155-163.
Tolan, J.S. (2002). Iogen’s process for producing ethanol from cellulosic biomass. Clean
Technologies and Environmental Policy, 3, 339–345.
Tomme, P., V. Heriban, M. Claeyssens (1990). Adsorption of two cellobiohydrolases from
Trichoderma reesei to Avicel: evidence for exoexo synergism and possible loose complex
formation. Biotechnol Lett,12, 525– 530.
Trostle, R. (2008). Global Agricultural supply and demand: factors contributing to the recent
increase in food commodity prices. USDA Economic Research Service, Report WRS-0801,
Washington, DC (U.S.A).
Ture, S., D. Uzun, I.E. Ture (1997). The potential use of sweet sorghum as a non-polluting source
of energy. Energy, 22, 17–9.
Usami, S., K. Kirimura, M. Imura, and S. Morikawa (1990). Cellular localization of the constitutive
ß-glucosidase in Trichoderma viride. J. Ferment. Bioeng., 70, 185-187.
Wald, S., C.R. Wilke, H.W. Blanch (1984). Kinetics of the enzymatic hydrolysis of cellulose.
Biotechnol Bioeng, 26, 221– 230.
Van den Broek, R. (2000) Sustainability of biomass electricity systems—an assessment of costs,
macro-economic and environmental impacts in Nicaragua, Ireland and the Netherlands.
Eburon, Delft (The Netherlands), p.216.
Van der Laaka, S.R.P, J.M. Raven and G.P.J. Verbong (2007). Strategic niche management for
biofuels: analysing past experiments for developing new biofuel policies, Energy Policy, 35,
3213–3225.
Van Kasteren, J. M. N., D. Dizdarevic, W. R. van der Waall, J. Guo, R. Verberne (2005), Bio-
ethanol from syngas.
References 139
Van Tilbeurgh, H., G. Pettersson, R. Bhikabhai, H. De Boeck, M. Claeyssens (1985). Studies of the
cellulolytic system of Trichoderma reesei QM 9414. Reaction specificity and thermodynamics
of interactions of small substrates and ligands with the 1,4-beta-glucan cellobiohydrolase II,
Eur J Biochem, 148, 329–334.
Wang, W. (2002). Cassava production for industrial utilization in China – present and future
perspective. In: Cassava research and development in Asia: exploring new opportunities for
an ancient crop, 7th Regional Cassava Workshop, Bangkok (Thailand), October 28th–
November 1st; 2002, pp. 33–38.
Ward, O.P., A. Singh (2002). Biotechnol technology development and perspectives. Adv Appl.
Microbiol, 51, 53-80.
Varhegyi, G., M.J.J. Antal, E. Jakab and P. Szabo (1997). Kinetic modelling of biomass pyrolysis, J
Anal Appl Pyrolysis, 42, 73–87.
Watanabe, T., T. Sato, S. Yoshioka, T. Koshijima and M. Kuwahara (1992). Purification and
properties of Aspergillus niger β-glucosidase. Eur. J. Biochem., 209, 651–659.
Weimer, P. J., J.M. Hackney and A.D. French (1995). Effects of chemical treatments and heating
on the crystallinity of cellulose and their implications for evaluating the effect of crystallinity
on cellulose biodegradation. Biotechnol. Bioeng., 48, 169–178.
Weimer, P.J., J.M. Lopez-Guisa, A.D. French (1990). Effect of cellulose fine structure on kinetics
of its digestion by mixed ruminal microorganisms in vitro. Appl Environ Microbiol, 56, 2421 –
2419.
White, A.R., R.M. Jr. Brown (1981). Enzymatic hydrolysis of cellulose: visual characterization of
the process. Proc Natl Acad Sci USA, 78, 1047– 1051.
Wilkie, A.C., K.J. Riedesel and J.M. Owens (2000). Stillage characterization and anaerobic
treatment of ethanol stillage from conventional and cellulosic feedstocks. Biomass and
Bioenergy, 19, 63–102.
Wingren, A., M. Galbe and G. Zacchi (2003). Techno-Economic Evaluation of Producing Ethanol
from Softwood: Comparison of SSF and SHF and Identification of Bottlenecks. Biotechnol.
Prog., 19, 1109-1117.
Vinzant, T.B., L. Ponfick, N.J. Nagle, C.J. Ehrman, J.B. Reynolds, M. Himmel (1994). SSF
comparison of selected woods from southern sawmills, Appl Biochem Biotechnol, 45-46, 611-
626.
Wiselogel, A., S. Tyson, D. Johnson (1996), Biomass feedstock resources and composition, chapter
6. In: Handbook on bioethanol: Production and utilization (Wyman C.E.), Taylor & Francis,
Washington (U.S.A.).
Von Blottnitz, H., M..A. Curran (2007). A review of assessments conducted on bioethanol as a
transportation fuel from a net energy, greenhouse gas, and environmental life-cycle
assessment, Journal of Cleaner Production, 15, 607–619.
Von Sivers, M., G. Zacchi (1995). A techno-economical comparison of three processes for the
production of ethanol from pine. Bioresource Technology, 51, 43–52.
140 References
Wong, K.K.Y., K.F. Deverell, K.L. Mackie, T.A. Clark, L.A. Donaldson (1988). The relationship
between fiber-porosity and cellulose digestibility in steam-exploded Pinus radiata. Biotechnol
Bioeng, 31, 447-456.
Wood, T.M. (1975). Properties and Mode of action of cellulases. Biotechnol Bioeng Symp, 5, 111–
137.
Wood, T.M. (1992). Fungal cellulases. Biochem. Soc. Trans., 20, 46–53.
Wood, T.M., N. Saddler (1988). Increasing the availability of cellulose in biomass materials In:
Methods in Enzymology, W.A. Wood and S.T. Kellogg Editors, 160, 3–11.
Wood, T.M., S.I. McCrae, K.M. Bhat (1989). The mechanism of fungal cellulase action. Biochem J,
260, 37-43.
Woodward, J., M.K. Hayes, and N.E. Lee (1988). Hydrolysis of cellulose by saturating and non-
saturating concentrations of cellulase: implications for synergism. Bio/Technology, 6, 301–
304.
Wooley, R., K. Ibsen (2000). Rapid evaluation of research proposals using Aspen Plus. In: Aspen
World 2000, Orlando, FL (U.S.A.).
Wooley, R., M. Ruth, J. Sheehan, K. Ibsen, H. Majdeski, A. Galvez (1999a). Lignocellulosic
biomass to ethanol process design and economics utilizing co-current acid prehydrolysis and
enzymatic hydrolysis. Current and futuristic scenarios. Report No. NREL/TP-508-26157.
National renewable Energy Laboratory, Golden, CO (U.S.A.)
Wooley, R., M. Ruth, D. Glassner, J. Sheejan (1999b). Process design and costing of bioethanol
technology: a tool for determining the status and direction of research and development.
Biotechnology Progress, 15, 794–803.
Wooley, R., V. Putsche (1996). Development of an ASPEN PLUS physical property database for
biofuels components. Report No. NREL/MP-425-20685. Golden, CO: National renewable
Energy Laboratory.
Worden, R.M., M.D. Bredwell, A.J. Grethlein (1997). Fuels and Chemicals from Biomass, ACS
Symposium Series No 666, Washington, DC (U.S.A.), pp. 320-336.
Wyman, C.E. (1994). Ethanol from lignocellulosic biomass: technology, economics, and
opportunities, Bioresource Technology, 50, 3–16.
Wyman, C.E., B.E. Dale, R.T. Elander, M. Holtzapple, M.R. Ladisch and Y.Y. Lee (2005).
Coordinated development of leading biomass pretreatment technologies, Bioresour Technol
96, 1959–1966.
Wyman, C.E., D.D. Spindler and K. Grohmann (1992). Simultaneous saccharification and
fermentation of several lignocellulosic feedstocks to fuel ethanol, Biomass and Bioenergy, 3,
301–307.
Väljamäe, P., V. Sild, G. Pettersson, and G. Johansson (1998). The initial kinetics of hydrolysis by
cellobiohydrolases I and II is consistent with a cellulose surface—erosion model. Eur. J.
Biochem., 53, 469–475.
Yan, T.R. and C.L. Lin (1997). Purification and characterization of a glucose-tolerant β-glucosidase
from Aspergillus niger CCRC 31494. Biosci. Biotechnol. Biochem., 61, 965–970.
References 141
Yau, W.W., J.J. Kirkland, D.D. Bly (1979). Model size—exclusion liquid chromatography. John
Wiley & Sons, New York (U.S.A.).
Yu, X., R.H. Atalla (1998). A staining technique for evaluating the pore structure variations of
microcrystalline cellulose powders. Powder Technol, 98, 135-138.
Zanzi, R., K. Sjostrom and E. Bjornbom (1996). Rapid high-temperature pyrolysis of biomass in a
free-fall reactor, Fuel, 75, 545–550.
Zarzyycki, A., W. Polska (2007). Bioethanol production from sugar beet – European and polish
perspective. Presented at 1st TOSSIE Workshop on technology improvement opportunities in
the European sugar industry, Ferrara (Italy), January 25–26th.
Zeng, M., N.S. Mosier, C.P. Huang, D.M. Sherman, M.R. Ladisch (2007). Microscopic
examination of changes of plant cell structure in corn stover due to hot water pretreatment and
enzymatic hydrolysis. Biotechnol Bioeng, 97, 265-278.
Zhang, S., D. E. Wolfgang, and D. B. Wilson (1999). Substrate heterogeneity causes the nonlinear
kinetics of insoluble cellulose hydrolysis. Biotechnol. Bioeng., 66, 35–41.
Zhang, Y.H.P., L.R. Lynd (2004). Toward an aggregated understanding of enzymatic hydrolysis of
cellulose: Noncomplexed cellulase systems. Biotechnol. Bioeng., 88, 797-824.
Zhang, Y.H.P., L.R. Lynd (2006). A functionally-based model for hydrolysis of cellulose by fungal
cellulase. Biotechnol. Bioeng., 94, 888-898.
Websites
www.biofuels-platform.ch (Website of ENERS Energy Concept) [accessed on October 5th, 2009]
www.novafuels.com (Website of Nova Fuels, Inc.) [accessed on October 5th, 2009]
www.ott.doe.gov/biofuels (Website of US DOE) [accessed on January 7th, 2010]
www.powerenergy.com (Website of Power Energy Fuels, Inc.) [accessed on October 5th, 2009]
www.rangefuels.com (Website of Range Fuels, Inc.) [accessed on October 12th, 2009]
www.syntecbiofuel.com (Website of Syntec Biofuel, Inc.) [accessed on October 15th, 2009]
Acknowledgements
My supervisor, Ing. Fabrizio Bezzo deserves my deepest and most sincere gratitude: thank
you for the many the opportunities and the many challenges you offered me in these past three
years. Thank you for your excellent guidance and support, not only concerning research, but
life itself. Thank you for your tolerance, understanding and your encouragement during the,
not really infrequent actually, “dark moments” I had during my PhD. Finally thank you for
every CAPE-luganega, every CAPE-mountain tour, and every funny informal chat and
because, in very few words, you care…
Thank you, or better Tack! (one of the few words of my very pocket Swedish vocabulary) to
my supervisor at Chemical Engineering Department of Lund University, Prof. Gunnar Lidén.
Thank you for the opportunity to stay and for welcome me so warmly in the cold Sweden,
thank you for your help, for every suggestion and interesting discussion we had. Thank you
because, despite you were always so busy you have always been generous in time with me.
I gratefully thank Prof. Guido Zacchi, Doctor Mats Galbe and Prof. Folke Tjerneld for sharing
their invaluable knowledge.
Special thanks to Magnus, Kim, Karen, Cristhian, Benny, Krisztina, Sanam, Kerstin,
Christian, Ola, Birgitta for being always kind and helpful and for teaching me how to survive
in the lab.
Grazie Stefano, zio dado, per tutte le volte che mi hai aiutato, dentro e fuori dal KC, per le
nostre chiacchierate sulla panchina in pausa caffè, per tutte le volte che mi hai detto “dai, non
fare la nonna” (o peggio), per quel sabato passato insieme in laboratorio a fare la NREL.
Grazie perché, è vero che è difficile creare amicizie profonde quando si fa solo una
“comparsata” in un posto come ho fatto io, ma ci sono le eccezioni… e tu sei una delle mie
eccezioni… grazie, perché la nostra forza è l’innata capacità di unire gli opposti con un
sorriso.
Tornando al DIPIC un grazie sincero a Giada, Andrea, Federico, Madda, Maria per tutti i
caffè, i discorsi e le risate condivisi, per tutto l’aiuto che mi avete dato in questi anni, e in
particolare nell’ultimo periodo.
Grazie al Prof. Max Barolo e a tutto il CAPE-Lab per tutte le iniziative, l’entusiasmo e la
passione contagiosi.
Grazie a tutti i docenti, i tecnici, i post-doc, i dottorandi, presenti e passati, che con una
parola, una battuta, un sorriso, hanno reso piacevole e meno pesante la permanenza al DIPIC.
144 Acknowledgements
Infine, last but not least, grazie alla mia insostituibile famiglia allargata, perché insieme,
anche nei momenti difficili, ce l’abbiamo sempre fatta (If you have a problem, if no one else
can help, and if you can find them… altro che A-Team!).
Grazie, mamma e papà, perché non mi fate mai mancare il vostro supporto, anche quando, lo
so, non condividete le mie scelte. Grazie perché avete capito che, come un aquilone, ho
bisogno che mi lasciate spago per volare, ma non per questo mancate di farmi sentire la
vostra mano salda al capo del filo.
Grazie Paola, Michele, Claudia, Sofia e Mauro, perché quando ci ritroviamo tutti insieme è
sempre una festa, perché squadra che vince non si cambia e su di noi scommetterei sempre.
Grazie Nicola… e va bene così… senza parole…