UNIVERSITÁ DEGLI STUDI DI PADOVA DIPARTIMENTO TERRITORIO E SISTEMI AGRO-FORESTALI SCUOLA DI DOTTORATO DI RICERCA TERRITORIO, AMBIENTE, RISORSE e SALUTE INDIRIZZO IN: TECNOLOGIE MECCANICHE DEI PROCESSI AGRICOLI E FORESTALI XX CICLO A RULE-BASED SDSS FOR INTEGRATED FOREST HARVESTING PLANNING (SVILUPPO DI UN MODELLO PER LA PIANIFICAZIONE INTEGRATA DEI SISTEMI DI UTILIZZAZIONE) Direttore della scuola: Ch.mo Prof. VASCO BOATTO Supervisore: Ch.mo Prof. RAFFAELE CAVALLI Dottorando: Dott. DANIELE LUBELLO 31 gennaio 2008
Transcript
UNIVERSITÁ DEGLI STUDI DI PADOVA
DIPARTIMENTO TERRITORIO E SISTEMIAGRO-FORESTALI
SCUOLA DI DOTTORATO DI RICERCATERRITORIO,AMBI ENTE, RISORSEeSALUTE
INDIRIZZO IN:TECNOLOGIEMECCANICHE DEI PROCESSIAGRICOLI E FORESTALI
XX CICLO
A RULE-BASED SDSS FOR INTEGRATEDFOREST HARVESTING PLANNING
(SVILUPPO DI UN MODELLO PERLA PIANIFICAZIONEINTEGRATA DEI SISTEMI DI UTILIZZAZIONE)
Direttoredellascuola: Ch.mo Prof.VASCO BOATTO
Supervisore:Ch.moProf. RAFFAELE CAVALLI
Dottorando:Dott. DANIELE LUBELLO
31gennaio 2008
II
III
Tiraretronchièdannatamentedifficile.È comecondurrel’ esistenzaprevedendoneil futuroedèquindi un’artenondatutti.Occorreessereaddestratiasoffrire fin dapiccoli.La pianta,mentrescivoladietroal tuopasso,è viva e beneintenzionata,manonpuòevitaretutti gli ostacolidel percorso,e quandononscorrepiù, bisognatrascinarla.A volte tutto vabenee il troncofila velocee senzaintoppi, mapiù spessosi impunta,si piantacol nasonel terreno, si ferma,si bloccadi colposegandoti la volontànellostrappodellafrenata.
1.1.1Defining study area..............................................................................................101.1.2.Forestmanagement.............................................................................................11
1.1.6.1.Roadsclassification.....................................................................................291.1.6.2.Roads,sylvicultureandforestmechanization.............................................321.1.6.3.National and Regionallaws.........................................................................361.1.6.4.Planning and building projects....................................................................371.1.6.5.Roadmanagementwith GPS-GISsystems.................................................41
3.1.1Terrainclassificationfor forestry– definition and purposes...............................693.1.2Terrainparameters...............................................................................................713.1.3Gradeabili ty .........................................................................................................793.1.4Matchingsystemsto thearea– referenceexamples............................................83
3.2. Skiddingsystemsand their limits..............................................................................91
Secondoquantoriportanoi dati del recenteinventario forestale, le foreste italianecresconoannualmentedell’uno percentochecorrispondea circa 100000ettari. Una delle cause è ilgeneraleabbandono della montagnae delle attività di agricoltura montana che lascianospazi apertialla ricolonizzazionedel bosco, ma anche il mercato del lavoro in boscoe dellegno hanno dato il loro contributo. Da una lato infatti il costo del lavoro è andatocrescendo, dall’altro il valore del legno, in piedi e all’imposto, è calato a livelli tali darenderenon convenienteil taglio e l’esbosco del legname. Parallelamente il bosco haacquisito valore in relazionead altre funzioni quali la conservazione della biodiversità, laprotezione dal rischio idrogeologico, le attivi tà turistico-ricreative e non ultima quelladell’accumulo del carbonio.Anchela certificazione forestale ha interferito con il mercatodel legno,in parte positivamenterilasciando un marchio di qualità e di gestionesostenibiliai prodotti locali, dall’altro haimpostoregole che limitano la determinazione dellaripresaamenodi quellocheè l’incrementoannuo.Ciò porta inevitabilmente a un aumento costantedella provvigione dei nostri boschi e influisce sui costi di utili zzazione poiché laproduttività delle operazionirimanesempre piuttosto bassa. Anche l’i ntroduzionedi unameccanizzazione avanzatasembra essere possibile solo in presenza di determinatecondizioni. Tuttavial’industria del legno,soprattutto del mobile, e il nuovointeresseversol’util izzo delle biomasseforestali a scopi energetici sono in continuacrescita. A trarnevantaggio è statol’import del legnameprovenientedall’est Europadovela manodoperahacosti più bassiedovela selvicolturaconsenteancoradi effettuaretagli a raso.A livello di pianifi cazione,alcuneregioni hanno introdotto nuovenorme per la redazionedei piani di assestamento,ma è ancoradiffic ile trovare indicazioni precise riguardo allecaratteristichedi accessibilitàe percorribilitàdelle particelle nonché delle motivazioni chespingonol’assestatore a consigliare un sistema di utilizzazionepiuttostoche un altro. Unascelta errata(seaggiuntaa unamartellatadel lotto mal eseguita)nonsolo può far lievitareicosti e scoraggiarel’impresa forestaleadeseguireinterventi simili in unadataarea,mapuòancheessere causadi danni inevitabili al suoloe al popolamento e, nel caso più estremo,indurreanon eseguire il tagliopregiudicandoe annullandol’utilità della pianificazione.Il modello per la pianificazione integratadei sistemi di utilizzazione (FOpPmodel) mira afornire valide alternative al pianificatorenellascelta dei sistemi di utilizzazione, supportateanchedall’analisieconomicadegli interventie dall’effetto chepossonoaveresul valore dellegname. L’interpretazione dei risultati del modello può inoltre essere utile nellavalutazione del grado di infrastrutture viarie, evidenziando aree carenti o aiutando ilpolitico a valutare progetti e a indirizzare eventuali contributi finalizzati alla lorocostruzione.Le fasi di abbattimentovengono generalmente effettuate a mano con l’utilizzo dellamotosega, l’harvesterè presentenell’areadi studio, ma spesso vieneutilizzato solo comeprocessore perchéi diametridelle piante superanoi limit i tecnici delle testateabbattitrici.
4
Quello che influenzamaggiormentei costi di allestimento dei lotti di legname è dunquel’operazionedi esbosco.Ci sono molte sfumature, molte marchee tecnologie diverseutil izzate dalle impreseforestali, ma per semplificare si è deciso di selezionare cinquetipologie nelle quali possonorientraretutti i sistemi. Tra i sistemi off-road è statoscelto iltrattore con verricello, il forwarder e il cable-forwarder. Quest’ultimo, seppure arrivato incommercio dapochi anni,potràsoppiantare il forwarderperchéè adattoa lavorareanchesupendenzeelevate, tipichedelleforestealpine italiane.I sistemi di esboscosufunesonostatiraggruppati in duecategorie,le gru a cavomobili e le gru a stazionemotrice semifissasuargano.Di ognuno dei cinquesistemisi sonomonitorate le produttività attraverso l’analisidei tempi di lavoro raccolti in diversi cantieri in bosco e si è tentato di ricavare delleformule che mettesseroin relazione la distanzadi esboscoda strada con la produttività.Sulla basedi questidati sonostaticalcolati i costi unitari. Per ogni sistemasi sono definiti ilimi ti tecniciperpoter operare:nel casodei sistemi off-road si sonopresi in considerazionel’accidentalitàdel terreno,la pendenza,la distanzada stradae la portanza del suolo, per isistemi su fune è sufficienteconsiderarela distanza da strada e la pendenzaminima difunzionamentodella linea (che opera solitamente a gravità). L’insieme dei parametricostituiscele regolesullequali si basail modello.Molto importante per rendereun modello utilizzabile è cercare di limitare il numero diinformazioni richiesteall’utente. Il reperimento e la preparazione dei dati richiedespessograndedispendio di tempo.Perquestomotivo il FOpP modelè statocostruito basandosisuidati chesono generalmentedisponibili o reperibili presso gli enti regionali (webGIS) o neipiani di assestamento.Si stainoltre sempre più diffondendol’utiliz zo di databasee files giàpronti per l’utilizzo con strumentiGIS. Cinque informazioni sono necessarieper far girareil modello: il Modello Digitale del Terreno(DEM), la classificazionedei suoli, i dati medidi precipitazioneannui, la retedellestradeforestalie i dati dei piani di assestamento.Questishape-files devonoessere inseriti in un Geodatabaseperpoteresseregestiti in modopiù veloce e sicuronella prevenzione di errori di calcolo. Il funzionamento del modello sibasasull’utilizzo degli strumenti(tools) di Geoprocessing di ArcMap (ESRI) ed è statogeneratocon ModelBuilder, interfaccia operativa grafica che consente di creare nuovistrumenti in ArcGIS (Toolboxes), di poterli condividere con altri ricercatori e di poterliesportare o integrareattraversolinguaggidi programmazionemolto diffusi. La creazionediuna mascheradi dialogo, supportatada un testoinformativo a tergo, consenteall’utentedimodificarei parametriadattandoil modelloalle proprienecessità.Successivamentealla suacreazioneil modello è statosottoposto a unavalidazioneeseguitain due modi diversi. È stata effettuata una intervista ad alcune imprese forestali perrecuperare informazioni relativealla localizzazione e alle attrezzature utilizzate in cantieridi utilizzazione effettuatiin passato.Inoltre, sottoponendouna mappaai responsabilidi unaditta che utilizza il forwarder, si sonoindividuate delle aree dovesecondoloro potrebbelavorare. Questi risultati cono stati confrontati con i risultati del modello per valutarequanto sia vicino alla realtà.Un altro metododi validazione ha confrontato le mappedel
5
FOpPmodelconquelleprodottedaun modello molto simile sviluppatoin Slovenia. Basatientrambi su parametri molto simili, hannorivelato notevoli differenzeper quanto riguardal’util izzo del trattoree delle gru a cavo. In particolare, il FOpPmodel si è rivelato piùprecisonell’individuazionedelleareenon raggiungibili dai sistemi di utilizzazione.Sono state eseguite anchealcune proveper saggiare la sensibilità del modello. Si è testatocome variano i risultati al variare dei parametriche definiscono i limiti tecnici delleattrezzature.Si è analizzatoin particolare come varianoi costi di esbosco e la percentualedi areacoperta daogni sistemadi utilizzazioneal variare della distanzamassima di esboscodi forwarder e gru a cavomobile. Si è testataanche la possibilità di effettuare il calcoloselezionandosolo alcuneattrezzaturee si è verificatocome questoinfluisce sulle areenonraggiungibili.Le mappeottenute dalleelaborazionidel modello sonofacilmenteinterpretabili e leggibili,riportanodelle utili legendechepermettonodi identificare in qualeareaogni sistema puòintervenire.Ad un primo risultatocheanalizza la fattibilità degli interventi di utili zzazionesegueunasortadi analisieconomica.Si ottengonoinfatti dellemappeche riportanoil costodelle operazionidi esboscosia per cella (della mappa in raster) sia per metro cubo dilegname.È così possibile effettuaredelle utili statistiche perogni particella assestamentalee prevederel’economicitàdegli interventisulla base delle prescrizioneprevistedal pianodiassestamento o economico.Una interessante applicazione riguarda le strade forestali:facendofluire il legnamea stradaè possibile stimarequanti metri cubi verranno esboscatisu ogni specificotrattodi stradae prevederecosì qualesarà il traffico di automezzichelapercorrerà.Sulla basedel transitoprevisto,che determina inevitabilmente l’erosionedelfondo stradale, è possibile redigere una sorta di piano delle manutenzioni delleinfrastrutture. L’analisi consenteinoltre di evidenziare quali aree boscate non sonoraggiungibili. Nell’ipotesi di analisi di un nuovo progetto, aggiungendola stradaallo shapeiniziale e facendo girarenuovamenteil modello,è dunquepossibileverificare comequestoinfluiscesullasceltadel metododi esboscoe sul valoredel legno.In seguito a una pianificazionegeneraled’area è comunque auspicabile uno studio piùparticolareggiatochevadaadanalizzareintervento per interventotutte le questioni inerential cantiere, dalla logisticaalla sicurezzadei lavoratori, dai costi fissi a quelli variabili e aquelli aggiuntividovuti ai tempimorti o di trasferimentodegli operatori.Vengonoalla fine illustratealcunemigliorie che si potrebberoapportareal modello,alcuneraccomandazioni e alcuniesempidi applicazionedellapianificazione.Le migliorie riguardanola possibilitàdi includere nel modello l’ analisi dell’id rologia deiversanti (torrenti o zone paludose)che agisce da barriera all’avanzamento dei mezzifuoristrada, nonché l’introduzione di un parametro legato alla stagione. Il regimepluviometrico è infatti variabile nell’arco dell’anno a seconda delle regioni climatiche:questoinfluiscesulla saturazione del suolo, ma in modo differente a seconda del periodo.Segli interventi in boscoavvengonodurantel’estatesaràpiù probabile chela portanzadelterrenosia elevataeconsentala circolazionedei mezzi al pienodelle loro capacità tecniche.
6
Le raccomandazioni riguardanola qualitàdei dati. Sarebbeauspicabile poter utilizzare unmodello digitale molto più precisocon dimensionedelle celle pari o inferiori ai cinquemetri.Questoè oggi possibilegraziea strumenti quali il laser scanner(Lidar) e all’aumentodelle capacitàdi elaborazionedei personal computer. Alt re informazioni, in particolare lapresenzadi ostacoli, la ripresae la classificazione delle strade, andrebberorichiestedaiservizidi controllo e supervisione(regionee servizi forestali) al momento dellastesura deipiani di assestamento.Inoltre la loro pubblicazionein formato GIS renderebbepiù sempliceil loro utili zzoe l’aggiornamentocontinuo epuntualedei dati.Concludendo, si riportanodueesempidi pianificazione, la prima riguardala valutazione alivello di regioneVenetodel numerodi harvester che potrebberopotenzialmentelavorarein modoeconomicoe competitivo.La secondainveceè l’applicazionedel modellosulargascala (1400 km2) al fine di valutare costi, carenzee potenzialità della filie ra-legno inun’areacompresatra Italia eSlovenia.
7
ABSTRACT
The forestry sectorin Italy hadsomeproblemsin the last years: the general abandonmentof mountainscausedthe uncontrolled growth of forests and some problems on theirmanagementfor preventing hazardslike wildfires, the increaseof forest work salariesandthe decreaseof wood value, the concurrenceof eastside European countries,the forestcertification which protectedmorethe ecological functionof foreststhan their economicalvalue, the incrementof social andnaturalfunctions of forests asthe carbon sinks. All thisfactorsinfluenced the way of planningcuttings inside forests to the point that sometimes,due to technical difficulties or low wood valueand amount, they arenot economical andthey are not done. But now, the increasing interest of the use of wood for heating orbuildingpurposesmay increaseagainthedemand and thevalueof this material.The ForestOperationsPlanningmodel helps the forester making decisionsabout whichskidding system is the most viable according to stand assessmental data and geography.The model may also highlight areaswhich have low forest roadsdensity. The skiddingoperationshave high influenceon the total cutting costs so the model considers only theskidding operation, the user will add unit costs for felling operations according to thesystemused(usually chainsawor harvester). Five systems are here considered:the tractorwith winch or skidder, the forwarder, the cable forwarder and two aerial systems,themobiletowerand thesledgeyardercablecranes.Themodelwasbuilt on a GIS environmentwith theArcGisModelBuilder. It is practicallya tool whichcanbesharedwith otherresearchersand modified according to any needs.The input fil es required to run the model are fi ve: the Digital Terrain Model, the soilclassificationor stability, theaverageyearlyamountof rain, the forest roadnetwork and theassessmentalforeststanddata.The modelwasvalidatedcomparing resultswith real working sites doneinside the studyareaor comparing resultswith othermodels on different studyarea.The model evaluationwasdonecheckingtheinfluenceof parameter variation onoutput results.Themodel outputsareseveralgrid mapsshowing thefeasibleworking areaof eachsystem,the technical and optimizeddistribution of systemswith costs(evaluated cell-by-cell andpercubic meter).Thestatistictoolsallow to make standreportsand deepanalysis.Comparing modeloutputsit is possibleto evaluatethe accessibility of forest andplan thebuildingof newroadsto improvetheinfrastructureand reducetheskidding costs.At the end, two practicalexamplesare reported and some discussion are doneabout theinput dataquality anda moresite-specific planning.
8
9
1. INTRODUCTION
The term “integrated” hasbecomecommon when speaking of natural and environmentaldisciplines. Even on a more technicaland engineering work, such the model presentedinside this dissertation,aim to considera wide spectrum of sciences: ecology, hydrology,sylviculture, technology and infrastructuralplanning. Results of an integrated planninghaveto considerall of themtrying to optimize the efficiency andneeds or, better, reducenegative impacts.
1.1. FORESTS AND FORESTRY: STATE-OF-THE-ART
Italy occupiesa longpeninsulastretchingfrom theAlps into theMediterraneanSea. Forestsaremostly locatedin theAlps andin themountainousAppennin “backbone”.Accordingto theNationalForestInventory carried out in 1985-86, the forest areawas 8.6mill ion hectares;while accordingwith the National Institute of Statistics, that publishesannual data, the forest land extensionis 6.8 million hectares(COLPI et al. 1999). INFC(2007) estimatedmore than 10 million hectares of Italian forest areawith an increaseof20% in 20 years.INFC considersareaswith minimal forest cover of 10% and minimalsurfaceof 0.5 ha.Of sucharea,6.86 million hectaresarehigh stands,coppice, shrubs andMediterraneanmacchiaforest, while the remaining part is represented by small woodlots(rocky, riparianforestsor shrubbyvegetation).Most of the productive high forests(mainly coniferous) are in the North-Eastern regionswhile coppicespredominatein the centreof the country.Threefourthsof the removals ofconifer roundwood (about 1.2 Mm3, table 1.1.2.b) come from North-Eastern regions(DELLAGIACOMA 2005). The only relevantexamplesof forestplantationsare the poplarstandsin the northern plain areasof the river Po valley (PETTENELLA et al. 2004).Poplarcoverthe37%of sawnhardwood(DELLAGI ACOMA 2005).Conifers are dominant in high forest, both for extension (56.3%) and timber volume(63.1%).The mostimportantspeciesis Norway Spruce (Picea abies Karst). Also mountainPines (Pinus sylvestris L., Pinus nigra Arnold, Pinus laricio Poiret) and Europeanlarch(Larix decidua Mill. ) are widespread. Most coniferous forests are located in the Alps(montanee subalpineSpruce,Fir, Larch forests), but someimportant onescan be foundalso in Southern Apennines(Pinus laricio Poiret). Broadleaved high forests are mostlybeechwoods(Fagus sylvatica L.), but also oak woods (especially Quercus cerris L.). Inhill zone are widespreadChestnut (Castanea sativa Mil ler) coppices, or coppice ofHornbeam (Carpinus betulus L.), Hophornbeam (Ostrya carpinifolia Scopoli) and Oaks(Quercus spp.) often in mixed compositions. In mountain zonecoppicewoodsare mostlycomposedby beechbothon theAlps andon theApennines (COLPI et al. 1999).Thenational growing stockof high forestsis about 405millionsof m3 (about211m3 ha-1),with a total annual incrementof approximately 30 million m3 of timber per year (on
10
average,7.9 m3 ha-1 yr-1) , but it is harvestedonly onethird of it (PETTENELLA et al., 2004).Currently in high forest, the annual yield rarely exceeds50% of the annual growth.Harvesting is on average35% of thecurrentincrement. This led to a general increasingofthe growingstockin thelastdecades(COLPI et al. 1999). Main causesof low utilisationarelack of infrastructures,difficulties of access,strict regimeof protection for protectedareasandinsufficient economicvalueof wood(PETTENELLA et al., 2004).
1.1.1 Defining study area
The study area considersVeneto, Friuli Venezia Giulia regions and Trento province inNorth-easternItaly (Figure1.1.1.a).
Figure1.1.1.a: thestudyareain thenorth-easternpart of Italy
Forestis mainly locatedon mountainousarea so forest operationsaremainly carried out onsteepterrain, and this affectsthe operational method, the machinery equipment, the roadnetwork requirement, the length of the working period and the availabili ty of manpower(CAVALLI 2004). The economic feasibility of logging operation in mountainous area isinfluencedby small privateownershipstructure, the diffi cult terrain conditions(steepnessandroughness),small harvestedvolumesdriven by sylvicultural requirements (STAMPFER
andKANZIAN 2006) andtransportationcostanddistance(SPINELLI et al. 2007).In this areasawmills are generally small and, especially on mountainousarea, they areorientedto processconiferoustimber.Sawmill byproducts supply concernspartly the localmarket and partly it leanson abroad market (Germany, Austria and Eastern countries)(CICCARESEet al. 2004).The use of wood as renewableenergy sourcefor heating in the years2003-2006 waspromoted with European structural funds, rural development plans, energy projects,regional and provincial funds.The majority of boilers and heating districts require woodchip. This materialcomesmostly from sawmills but a goodplanningof forest operationsandcutting systemscould improvetheuseof forestbiomassreducing costsandincreasingquality (EMER et al. 2007).
11
1.1.2. Forest management
In Italy, 60%of the forestland is ownedby private person and theother share is for publicproperty. Public ownedforest is possessedby local municipalities. Accordingto GeneralCensusof Agriculture (ISTAT 2000),the averagesize of private forest properties is 7.51ha. Private owned woodlands are usually very scattered and rarely keep a forestmanagementplan. This is a big problem for an active managementof forest resources(EMER 2005). Inside the researcharea,about 90% of the forests are situated in mountainareas,7.5% in the hills and only 2.6% in the plains (table 1.1.2.a). According to forestmanagementplans,forestarefastgrowing to a rhythmof 5.7m3/ha.year in high forestsand6.2 m3/ha.yearin coppiceforests(GPA2005).
Soil andwaterconservation is themaingoal andconstraint of forest management.Actuallyforestry practices are carefully controlled and restricted by specif ic rules, aiming asustainable planning and managementof forest land. In high forest clear cutting isforbidden and forest operationsare leading to natural regeneration, such as selectionmethod and shelterwood method (group-, strip- and edge-cuttings), are stronglyencouraged.With this kind of treatment,the foresthasshift to uneven-agedor irregular.Inbeechhigh forestis typical to treatwith uniform method.Theopening of gapsor stripesbyclearcutting is allowed only in standcomposedby light-demanding species, in order tomeet the ecological requirementsof these species and guarantee the stand naturalregeneration. Coppice is widespread,especially with private owners. The most commonmethodis clearcut,but for many speciesthe law prescribes to leave some standards tofavour seedproduction and sproutsregeneration in old stumps. The selection methodisapplied in manybeech coppices,a lot of which are public proprieties(COLPI et al. 1999).Forestsarea puzzleof smalldifferent typologies,almost70 foresttypes have been defined.Eachof them is characterizedby different degreesof biodiversity, connectedto theshareoftreespecies,theforeststructure,their regional spreading, thepresenceof protectedanimalsand flowers, and many other parameters(DEL FAVERO 2001 and 2004). Based on the
12
Corine Land Cover (APAT 2005), forested area is divided in coniferous (39.3%),hardwoods (46.6%) and mixed forests (14.1%).Ash-hornbeamand oak-hophornbeamarethe most spreadforest typeson the foot of the mountain and hilly areas.On mountains,beechforestsand spruceforestsin alpine areasare most common.Other rare types likeMediterraneanmacchia,oakforestson plain areasandPinus mugus, evenif theyaresmall,they increase biodiversity. In Veneto region, 45% of forested area are included insideprotected area accordingto the Europeanrules of Natura 2000. Cuttings and re-plantingoperationsto improve foresthealthhavebeenperformedboth inside protectedareasand inSIC/ZPSareasfor a total of about5000ha(PSR 2007).As a priority for theright managementof forestsandto preservepeculiarities of each foresttype, forest management plans are a fundamental instrument. According to “Forestregional laws” (as for examplethe L.R. 52/78 in Veneto), all public forests must bemanaged in conformity with forestassessmental plans, approved by regional or provincialforestservices.In Venetoandin Friuli-Venezia Giulia regiontheshareof forestproperty issimilar, within 50 and60%for public properties(64% of forests in Veneto areassessed). InTrento provincepublic propertiesare bigger reachingmore than 70%, but inhabitantshavelocal rights to usewood coming from public coppice (mostly beechcoppice forests)forhouse heatingpurposes. As an average,1/10 of the yearly Italian yield comesfrom thesethree regions (table 1.1.2.b). Even private properties can be assessed by particularenvironmental andmanagementplans(“piani di riassetto”), but theyarenot commonuntilnow.
An importantaim of Italian forestry is to foster natural diversity andevolution in forests:mixed forestsarepromotedandthe spontaneous re-colonizationof broadleaved species inconiferousplantation is todaystronglyencouraged (COLPI et al. 1999).Many landownershavealsoobtained thePEFCcertification for a sustainablemanagementof forest respecting the international standards. Specific indicatorshavebeen included tomaintain and improve naturalhabitatsand to evaluateenvironmental damages which couldderive from forest operations.The basic principles of the sustainable sylviculture arerespectedbut this leadto plancuttings that are alwaysbelowtheestimated growing index.
13
This makedifficult theuseof high mechanizedutilization systems: manyplannedcuttingshavelow yield, or they areondifficult terrains,or thereis no infrastructure (forestroads)soneitherforestenterprisesnor sawmillsareinterestedin buyingthat wood(HIPPOLITI 2004).If forest planningwill considernot only theecological andenvironmental point of view buteventhe social andeconomical(what is called hereintegrated planning) Italian forestrycould raiseandbecompetitiveon theEuropeanmarket.Forestmanagement shouldbeadaptedto the needsof society, promotingequity within andbetweengenerations. Sustainablemanagement is when wood is harvested until a limitwhich correspond to thenaturalre-growth,sothatnextgenerationswill use that resourceaswe did. EvenDEL FAVERO (2004) pointed out that a change is needed on several fields:cultural and ethics, scientific and technological, political and juridical, besidessocial andeconomical.
1.1.2.1. Focusing problems
Nowadays,in someregions(for exampleLombardia) or provinces (as Trento),new forestmanagementplans havebeentestingbut still preserving the historical meaning (CALVO et
al. 1998;CALVO 2004; CALVO et al. 2004; WOLYNSKY 2005).Oneof themain problems isthat sylviculture and forest mechanizationhave usually oppositeneeds:the sylviculturetake careof theecological aspectsandaims to reduce cuttingsaccording to new functionsandutilities assigned to forests(CIANCIO andNOCENTINI 1996; DEL FAVERO 2004); on theother side, work and machineinvestment costs increased so that small cuttings are notsustainable (HIPPOLITI 2006)becausehighmechanizationrequires highproductivities.Foresterwho makesplanning should consider and reconcile bothneeds, but this is diff icultandin thepastwasneglectedsothat:o insideforestmanagement plansthereare only few information(figure 1.1.2.1.a)about
the optimal cutting andskiddingmethodto be applied when cutting a stand (CIELO et
al. 2004). Some Regionshave introduced standard information as for example theterrain roughness,the presenceof roadsor skidding trails, the slopeor other specificinformation that are now easily managed by Geographic Information Systemsorgathered usingnewtechnologiesasLIDA R (LUBELLO andCAVAL LI 2006). Theway in which forester definesskiddingsystems is not clear: why he suggeststhatsystem? Will it be feasibleand economically viable? Building an objective modelwhich wil l answer thesequestionwould be a good solution. Even more, if the cuttingoperationswill be technicallyandeconomically feasible, forester will be sure that hisplanningwill be successful.A goodknowledgeof forest mechanization systemsmayalso helptheplannerin designingnewforest roadsandassessingthe roadnetwork.
14
Figure 1.1.2.1.a:a page from the current Asiago forest assessmental plan. The onlyinformation is thaton the red rectangle saying thatskidding will be difficult andhopefullyperformedwith a trackedtractoror horses.
o the yield is often too low to guaranteeeconomically forest operations. This happenwhen using cable cranes or harvesters and forwarders because the installation,translocation andmaintenancecostsareusually higher thantraditional systems. Thosenew technologiesmakelow damagesto thesoil and to remaining trees (CECUTTI 2001,MARCHI and PIEGAI 2001, CAVALLI 2005) but they requirehigh cutting quantities. Ifthe plannerhasno consciousnessof this problem, operations will not be doneandhiswork wil l beuseless.
Recently(in theFriuli-VeneziaGiulia) theforesteradviseswhich system is optimal andtheowner or the forestmanagermakesa project of the cutting operations so that there shouldbe a continuum, a dialog betweenplanning,management andutilizations, as today is not(DEL FAVERO et al. 2000).
1.1.3. Forest economy
1.1.3.1. Wood market
In Italy, the two componentsof the forestry sector (forest activities and wood workingindustries) are separatedentities acting rather independently. The lack of integrationbetweenthe two sectors is due to different policies and patterns of development.Forestactiviti es seemmoreorientedtowardstheproduction of non-market public servicesthantoan increasein the internalsupplyof woodproducts.Thewood industry is strictly orientedtowardsproduction andcompetitionin the international market by giving asmuch addedvalue as possibleto the raw material imported (COLPI et al. 1999). In Italy, the bulk ofindustrial activities is based on import of rough and semi-finished products (15.5 Mm3:FAO, 2007), while internal supply is ableonly to coversmallnichesof themarket.
c. woodfurniture 31807 162107 116719 4586 155 68926 1572 64340
Total (a+b+c) 87510 348610 279341 31829 10300 79436 2297 47607
Wood industry is a flowering sectoremploying 350000 workers (table 1.1.3.a), but thedimension of enterprises is low with an averageof 4 employees. Nevertheless the Italianstyle is famous aroundthe world and the furniture export is at the highest level (table1.1.3.b).
Table 1.1.3.b: import-export balance in Veneto region (CAMCOM 2006a) and Udineprovince in F-VG (CAMCOM 2007a) VENETO region (2005) Udine province – FVG (2006)
In the North-easternregionstherearesomeindustrial districts that areconcentrated asspotson someplacesor provincesand they are very specialized in the production of specificissue, asfor example the chair-district, the furniture-district or the kitchen-district. This isclear reading table 1.1.3.c where Treviso is the Venetoprovince with vocation to thatproduction activity (comparingits importandexport thereis900M€ of added value!) Table 1.1.3.c:comparing sawnwoodimportandfurnitureexport in Veneto provinces.
Import (€) Export (€)Veneto provinces(2005) sawn or planed wood furniture
Theannual cuttingvolumeis about10 Mm3 with a shareof 60% for firewoodand40% oflogs (figure 1.1.3.a). Within logs poplarcover 37% (DELLAGIAC OMA 2005), but it comesmostly from agricultural landssited in the plain areaalong the Po river. Poplaris usedinpanels and paperproduction.Broadleaves include oaks and chestnut, coming from theAppennins in the centreItaly, andbeechthat is requested for the production of furniture,for example chairs. 35% of logs production are conifers, of which 21% is spruce (fi gure1.1.3.b).
Cuttings in Italy
5.305.103
3.174.714
firewood logs
Logs: share of species
21%
14%
37%
28%
spruce other conifers poplar other broadleaves
Figure1.1.3.a:annualcuttings(m3) in Italy Figure1.1.3.b: logsshareof species
Pricesat roadsidedependon the length, diameter andquality of logs (table1.1.3.d). Eveninside the same Regionpricesof the same assortment may vary during the year (fi gure1.1.3.c)or maybeinfluencedby theprovenience(figure1.1.3.d).
505560657075
80859095
100
jan apr may jun ago sept oct nov dec
Fas
sa
Alta
Val
diN
on
Val
siS
ole
Prim
iero
eV
anoi
Pin
etan
o
Ren
dena
Fie
mm
e
Alti
pian
i
Tes
ino
Bas
saV
alsu
gana
packaging
buildings40
50
60
70
80
90
100
packaging
saw logs
buildings
Figure 1.1.3.c: saw logs prices (€) in Trento province during 2005 (CAMCOM
2006b)
Figure 1.1.3.d: wood prices in differentlocal areas of Trento province (CAMCOM
2006b)
In 2005,after a long periodof constantdecreaseof prices, high quality assortmentshadanincrease of +5% (saw logs andpackaging) and +16% for normalassortment (4 m). As infigure 1.1.3.c, pricesare quite stableduring spring and summer but in autumn they raiserapidly with situationsof real fight to buy woodat public auctions(CAMCOM 2006b). Thisis possiblydueto a lack of wood in the Europeanmarket or to a naturalgrowth of prices
17
which in the last yearswereconstantlydecreasing. The situation gave an optimistic viewfor thefutureof forestry.
Table 1.1.3.d: comparing wood pricesat road side (LUCCHINI 2006; LUBELLO et al. 2007;CAMCOM 2007b)Species FRIULI-V G VENETO TRENTO
quality Description value(€/m3) SPRUCE A buildings 110 120 111
B+ sawing 94 98 92B sawing 86 85 85C+ 64 73C packaging (4 m) 54 68 66C packaging > 4 m 77C lenght5-7 m 75 75 74D lenght5-7 m 85 84D sawing 58 60 66D packaging 53 63D poles(10 to 30 cm) 44 45 62D rosewood 32D for chipping 26
FIR B+ > 4-6 m 65B 4 m 55
LARCH A 132 150 143B+ 104 91B 93 76C+ 64 68C > 4 m 60C packaging 55D rosewood 32D for chipping 28
BEECH A 2,5 - 4 m 96A- 69B+ 92B Diam.> 35 cm 76B Diam.< 35 cm 66B redheart> 35 cm 66B redheart< 35 cm 61B packaging 59
FIREWOOD 2-4 m, Diam> 10cm 60 60 65
The variation of prices makesplanning very diffi cult: forest management plans haveusuallya duration of ten yearsbut who know ten years in advance what will be pricesand trends of the wood market? If prices will get lower, enterprises will needhigheryield to coverfixed andvariablecosts(LUBELLO andDEL FAVERO 2007),so probably theestimatedyield will not be enough and nobodywill cut it. If prices wil l get higher, alsostandingprices will slowly follow and the gain for enterprises will be lower, with theproblem that in the meantimethey would havespent moneyfor buying new technologiesandtheywill bemoreexposedto economical risks.
18
1.1.3.2. Regional politics
Even if forestsare growing in areaand stock, wood products contribute by 0.5% on theaverage regional grossproduction(PLV) and 0.6% on the agriculturaladded value(AV).Thesevaluesdecreasein particular after1997 dueto thereductionof woodstandingprices(“prezzo di macchiatico”)(figure 1.1.3.eand1.1.3.f). Economistsconfirm thetrendevenforthe future becausemarketsopenedto Eastern Europe, where man work and prices ingeneral arelower, anddueto anincreaseof selling wood after 1990 and1999storms(PSR2007).
Figure 1.1.3.e:pricestrendin Venetoregion: in light gray the averageconiferous 1st quality standing prices;in gray larch priceat roadsideandindark sprucepriceat roadside(RIGONI
Same situation for sawmill by-products,eve if market is more stable. Coniferous boardpricesareincreasingwith anaverageof 7%.Non wood forest products market giveshelp tolocal economies: in the last yearsin Asiagohighland,incomings from selling rights forsearchingmushroomsare4 timesmorethanthosederiving from selling wood!The reduction of wood standingprices makes part of a common scenario of generalabandonment of mountains with the consequence in reduction of active forestmanagementanduncontrolledforestsgrowth.In the meantime even costsof man work decreased, together with profits coming fromforest utilizations. Profits reached29204€ per occupied in 2003 and were saved by the increasingof work productivity(ISTAT 2003a). Introducing higherlevelsof mechanization(asharvesters) couldleadto higherdaily productivitiesever morethan80 m3/man.day.
19
Figure1.1.3.g: number of working hoursin forestthat can becovered by selling 1 m3 ofwood (standingtreevalue)(CIOTTI 2005).
Properties areso scatteredandfragmentedthat, if there is any sort of association, cuttingsaretoosmall to fulfill themarketdemand.During theperiod2000-2006,in Veneto,regionalfunds wereprovided to promotethecreation of forest associations,but, evenif thenumberis quite good (9 associationscomposedby 270 partners of which 254 are private), theaverageforestedareais 300ha.Both forestenterprisesandsawmillsshowa structural weakness. In Venetoregionthere are416 forestenterpriseswith asaverage1.7workers of which 81.8are seasonal (totally about1700workersper year).313enterpriseshavea “working license”which certifiestheir workandtheir professional qualification.Sawmillscut only few thousand cubic metersper yearandtheyarefamily managedso they arenot competitive for the European market.In fact75% of the14706 wood industries(inside the region prefer the import from abroad of rawmaterialand boardsthan from regionalsawmills. This is probably due to an un-constantproduction and quality of local productsand to the absence of other services like wooddryingandsteaming.In Trentino thereare80 forestenterprises,but only few of themcover the marketmostlyentirely (actually 19 enterprisesare able to cut 63.7% of the annual production, table1.1.3.e).
Table 1.1.3.e:forestenterprisesactivity in Trento province(CAMCOM 2006b)
Forestry in North-easternItaly has some opportunities and weaknessesthat could beresumed in table1.1.3.f.
Table 1.1.3.f:Swotanalysisof forestry sector,ordered by importance (PSR2007)Strength Weakness
High potential developingwood-energychain Badstructuralconditionsof forestenterprisesEnvironmental andsocial services Abandonmentof activeforest managementIncreasing woodstockandproduction Small and scatteredforestpropertiesVery high quality timber from vocatedareas No dialogbetweenlocalwood productionand
Old wood selling procedures (auctions)brakeforestwork continuity
Trying to solveforestryproblemsis a future issuefor politiciansbecausetheyshould seizethe opportunities that sectoroffersandovercome limitationsderivingby theEuropeanandinternational market.Somestrategiescouldbe:a. promote wood stocks value as a natural capital for example providing money for
cuttings in steep terrainswere standingprices makenot economically feasible forestoperations.
b. promote specific productsas wood biomass for heating or industrial (mdf-panels)purposes, comingboth from forestand from sawmill by-products(PETTENELLA et al.
2004). This is possible providing money for new equipmentsor promoting theinstallation of heatingdistricts or private small-medium boilers. In Trento province,specific energy offi ceswereestablished.
c. promote high quality wood or assortments for specific use (as wood for historicalbuildings) or promote forest certification standards both in wood-chain and insustainableforestmanagement(SECCO andBRUNORI 2005).
d. promotenew technologiesto increaseproductivi ty, modify working site andtransportlogistics, introducenew managementforms (largemanagement planning,road-networkplanning, new kind of contracts,etc…). During period 2000-2006 all three regionsprovided funds for buying new machinesup to 40% of purchasing price (figure1.1.3.g.), in Trento up to 50%only if theenterprisewaslessthan oneyearold or if thenewmachine wasonethefirsts (accordingto thenew technology) inside thearea.
e. improve “commercialdialog” betweenwood industry and local sawmills introducingnewtechnologies,layoutsandservices(sawnproducts,steaming,products ondemand)
f. give a value to environmental and ecological, social and tourist public servicesprovided by sustainablemanagementof forests, shrubsand meadows (PETTENELLA
2007; PETTENELLA andCICCARESE2007).
1.1.4. Forest work
In the North-easternpart of Italy it is estimated that there are 350 forestenterprises, withone thousand stablepeopleworking. Other workers belonging to Public Administrations(Servizio Foreste in Provincia Autonomadi Trento,Servizi Forestali Regionali e VenetoAgricoltura in Veneto Region, Servizio per la Selvicoltura e Antincendio Boschivo inFriuli-Venezia Giulia Region) make also sylvicultural cuttings or other environmentalactiviti esmostlyconnectedto wildfires hazard.Forest enterprisesare typically independentsand belonging to the handcrafters category.Less frequentaresocietiesor associations: oneexample is theCo.Ge.For founded in 1990by 13 enterprisesandnow counting55 partners of which takepart forest enterprises(whichare cutting logs, firewood, selling and importing wood) and sawmills. This collaborationlead to openthe areaof interestand the market possibilities just by sharing machines orworking together (AZZALINI 2004; PETTENELLA et al. 2004). As shown in figure 1.1.4.a,enterprisesare very often working together, but they do not want to make associations,maybefor problemsof leadinganddecision making. Including private forestowners, in thepast years9 forest associationswere createdin Veneto region. They count 270 members(254areprivates),but theaveragemanagedforestarea is limitedto 300ha(PSR2007).As an average,the sharebetweenemployersand workers is 1 to 2.5, and the number ofworkersvary from 3 to 5 (figure 1.1.4.b).Many part-time workers(50% on the total) arerecruitedwhen needed;50% of them comesfrom new regionsincludedin the EuropeanUnion or from the Eastern countries (figure 1.1.4.c). In Veneto, Friuli and Trento,Romanianforestworkersarevery common becauseit is assumed theyare tougherin forestoperationsand it is easierto talk with becauseof the common Romance languageorigin(AZZALINI 2004).
22
Forest enterprises working toghether
50%
29%
79%21%
no
yes, possible association
yes, but dont want toassociate
Figure1.1.4.a: thepossibilityfor forestenterprisesof working together
Full-time and part-time (average n.) workersin forest enterprises
72%
7%
14%7%
1 w .
2 w .
3 w .
>3 w .
(1.6)
(0)
(1)(2)
Part-time workers origins and duration oftheir staying (months n.)
10%
40%
10%
40%not defined
Romania
Polonia
Italy
(--)
(5.2)(5)
(3)
Figure 1.1.4.a: share of part-time andfull-timeworkers
Figure 1.1.4.b: part-time workers nationa-li tiesandduration of work
(data on the graphs have beengatheredduring a research comparing forest enterprisesworking in VenetoandTrentinoregions(LUBELLO et al. 2007))
Though the cost of work increasedmore than the wood value, the minimum level ofsalariesis on line with Nationalagreements(table 1.1.4.a).It is commonindeed to bepaidby daily production insteadof workinghours.
To be recruited,foreign workersgo directly to the employer or workersstill assumedareasked searching for othersby their employer.It is also commonthat the employer goesabroadsearching for workers.Beforestartingan enterprise, people usually work in other
23
enterprisesor in sawmill to learn and train themselves. Employees usually learn throughinstructions of older colleaguesdirectly on the ground; only few of them follow learningcourses(figure 1.1.4.c). Practicalteachingcoursesareorganizedin North-eastern regionsby the ForestService (in Trento,addressedperiodically both to workersandtechniciansatdifferent levels),by sortof forestschools (theCesfam in Paluzza, Friuli-VeneziaGiulia) ordirectlyby the regionasin Veneto.In Trentoprovincethenumberof coursesincreaseeach year (table 1.1.4.b) andit is strictlyconnected to a licensethat all forest entrepreneur must have. More than 60% of forestemployers go to fairs or takeparticipationto technical demonstration days organizedby theuniversityor theregion (figure 1.1.4.d).
Table 1.1.4.b: number of technicalcoursesattendedin Trento province (POZZO 2007)Year 1994
Figure 1.1.4.c: share of forestworkers participating to learningcourses
Figure 1.1.4.d: Participation to demonstrationdaysandtypologies
Taking careof workers safety is variable depending on the employersensibility. Forestmachinesare certified with most recentEuropeanrulesand in most enterprisesthere is adocument evaluatingrisksand preventingaccidents.Sometimesthis document is written inforeign languages to becomprehensibleby all workers.
1.1.4.1 Known problems
Speakingwith entrepreneurs,one of the biggest problem is the finding of qualifiedworkforce.More and more they recruit foreigners; young Italians do not like working onforest because it is usually part-time and earnings are not proportioned to hard workingplaceconditions.An other difficulty is to gain enoughmoney to pay back investments for buying newmachines.Everybody considersas a necessity the introduction of new machinery andtechnology to improve processesand productivities and everybody knows that there are
24
specific regional funds. The problemis that retrieving those investments will take moretime thanthe expectedeconomicmachines life, ever more if considering their limited use.The complexityof planningforest activities may lead enterprises to leave regional fundsunused.An otherweak of thesystemis not only thequantity,but the quality of roadnetwork. Someold roadswerebuilt excavatingon theup-hill side and moving the terrain on theslope, buttrailersand loadsincreasea lot so that road pavement is to light to support the weight. Aconstruction problemis due to the width (sometimes they are too narrow), the slope (toosteep) and switch-backs radius that were studied for trucks loading 4 m log. Todaysawmills usuallyaskfor longer(8 or 12 m) logs, but it is not possibleto transport them.About 60% of forestenterprisesthink that roadnetwork is not adequate(figure 1.1.4.1.a),but who gavenegativeansweris entering deeper inside the forest (figure1.1.4.1.b). Thisdependon the owned machines,actually a winch on tractorneeds more roadsthan cablecranes.
Figure 1.1.4.1.b: maximumdistancereached by workingsites. Who works near road (maybe with tractor andwinch) think that networkis adequate
The access in coppice forests is more dif ficult than in standing forests. Municipalities,which usuallyown coppices, arenot interestedin improving roadnetwork because of thelow valueof thoseforests,so theyare abandoned and fi rewoodis boughtfrom theEasternEurope. By law, coppiceforestsmaybecut only in winter time,so enterprises can work allthe year (standing forestsarecut in springandsummer time). Neverthelessthereare somethat arespecializedin logsproductionand others in firewoodproduction (figure1.1.4.1.c).Firewoodmay be sold as big piecesof 2 m length, or cut in chopsand storedon 1 tonpallets: prices actually vary from and averageof 90 to 130 euros/ton (figure 1.1.4.1.d).Someoneis alsoselling 2 m firewoodat roadside (60euros/ton).
Figure 1.1.4.1.d: firewood prices dependon the piece size. Chops require morework soprice is higher
The last problemis the complicateand bureaucratic system of auctions(figure 1.1.4.1.e)andthe time consumingsystemof measuringand verifying logs before selling them.Themarketis moredynamicandcannotwait time for local products.If theydon’t come just in
time, sawmills will searchfor wood abroadandfor better offers, for example sprucefromAustriamaycomein few daysin all assortments theyneed.
In some cases,work in forestenterprisescould be undeclared, workersareoften relativesandwithout training and professionaleducation. Also low technological level leadto highharvestingcostsand makedomestictimbernot competitive (AA.VV., 2004).Cutting operationsin coppiceforests usually require lower qualification than in standingforests(HIPPOLITI andPIEGAI 2000) so, especiallyon privateproperties, may be donebypeople with no skill andinadequatetools, workersbad paid for high working rhythmsand
26
on an irregular positionaccording to law. Only on public propertiesit is required that theemployer signsa paperin which declaresthe respect of national ruleson working matter,but there is anyoffice thatverifiesthetruth (PETTENELLA and SECCO 2004).The hidden work, with no respectof safetyrules, createa situationof modified marketwhere“good” enterpriseswill loose.In fact workerswill be less paid, but noneinsurancewill coverthemwith hardconsequenceson society if somethingwould happen(illnessoraccidents).The Italian statisticresearchoffice measured the numberof regular workers in relation toall working units (theoreticalnumber) and made some indexes (ISTAT 2003b). Dataconsider the whole sectorof Agriculture, Hunting and Forestry, showing that while theoccupation decreased,the numberof irregular workers increased of about 10% (fi gure1.1.4.2.a). Therateof irregularsvary from regionto regionand from north to southof Italy,from a maximum of 50%in Calabria to a minimumof 18.6%in Toscana(table1.1.4.2.a).
In the North-easternpart of Italy, forestoperations areinfluencedby specific conditions ofAlpine forests,particularlysteepslopeterrains.Felling, delimbing andbucking are doneat felling site while skidding operations may beperformedthrough off-roadmachines(80%)or cablesystems(20%). This is alsoknown asShort Wood System (SWS) or Cut-to-Length (CTL) system. Felling and delimbingoperationsareusedto be donewith chainsaw, while skidding dependson the steep slopeand the presence of adequateroad infrastructures. Off -road machines are mostlyrepresented by 4WD (80-85%) or trucked(15-20%) tractorswith winch. Winchesmay befixed (40%)or not (60%)andnewmodelsareequippedwith remotecontrol. Cable systemsaredividedin fixed (sledgeyarders)andmobile (tower on tractor or trailer) in a proportionof 1:1 or 3:2 which variesin relation to the working site conditions andthe distancesthatwill bereached(CAVALLI 2004).In the last years,other working systemshavebeendeveloped: one is felling and partialdelimbing at felling site,thenskidding and finishing processingat roadside (this is usuallycalledFull Treecombinedwith Cut-to-Length, FT-CTL); theotheris the Full Treesystem(FT) wheretreesarecut andskiddedto roadsidewheretheyare processed. Thesesystemsrequiretheuseof anexcavatormountedor a carried processor thatmakesall delimbingandbucking operations. It is estimatedthat12 processorsareworking on thestudy area(fi gure1.1.5.a), five arecarriedon a tractor,six areexcavator mounted(bothwheeled andtrucked)andoneis on a truck coupledwith a tower (figure 1.1.5.b) of a mobile cablecrane(thesocalledGebirgsharvester). The number of thosesystems is growing rapidly and probably itwill continuebecauseworkersaregladof it andprocessingat road sidewill bemoreusualwherethesizeof roadsandthedimensionof piling siteswill allow it.
High forest mechanization in N-E Italy
0
1
2
3
4
5
6
7
mac
hin
esn
.
tractor-mounted processor
excavator-mounted processor
Gebirgharverster
wheeled harvester
trucked harvester
hybrid harvester
forwarder
Figure 1.1.5.a:numberof machinesworking (ZUCCOLI
BERGOMI 2006)Figure1.1.5.b:gebirgharvester
28
Although motor manualfelling is themost commonfelling method, both in theconiferousandthe broadleavedforests,in Italy therearealso few contractors working with harvesterand forwarders: SPINELLI (2004) relates that in Italy there are totally 44 harvesters,including in thatnumberalsoexcavators with an harvester headand processors.Accordingto CAVALLI (2004), in the North-easternItaly there are 6 harvesters and 4 forwardersworking. Harvester are wheeled(4 of them),trucked andhybrid (wheels and legs). Thesemachinesareeconomicallycompetitivewhenworking with high yields and small-mediumsized logs. Wheeled harvestermay work on steepslope terrains up to 40% while thetruckedone,which the cabinhasan auto-leveling system,up to 60% and the hybrid onereaches100%and more (CAVALLI andZUCCOLI BERGOMI 2006).Thinnings in coniferous high forest are done only when there is some European orgovernmental fund for forestry improvement. Actually thinnings are uneconomicaloperations becausethe manpoweris too costly so some entrepreneurs use processorsmountedon the tractorto processtreesat roadside(CAVALLI and ZUCCOLI BERGOMI 2005).Thinningswith harvesterarevery rare (EMER 2005) even if recentstudiesconfirm that it ischeaperthan the traditional method (8 €/m3 against25 €/m3 usingchainsaw)(SPINELLI andSTAMPFER2002;CAVALLI and ZUCCOLI BERGOMI 2006).Two of the four forwardersareworking togetherwith harvesters. The intereston themisfastgrowingbecauseof their high productivities and thepossibili ty of introduce themevenonsystemspartiallyhardmechanisedwherethey areusedinstead of tractorand trailer.
1.1.6. Forest roads
Roadsarea vital componentof civilization. Theyprovide access for people to study, enjoy,and, commune with forestedwildlands,to extract an array of resourcesfrom natural andmodified ecosystems. Roadshave well-documented, short- and long-term effects on theenvironment that have becomehighly controversial, because of the value society nowplacesonunroadedwildlandsandbecauseof wildernessconflictswith resourceextraction.When planning roadsshouldbe identifies links amongprocesses and effects that suggestboth potential compatibleusesand potential problems and risks. The debate on theirpositive and negative aspectsis wide and concerns not only Italy (BALOCCO 1994;LAURENT et al. 1996; MARCHI and SPINELLI 1999; BENGSTON and FAN 1999; BORTOLI
2001). Roads issuesand road scienceusually cannot be effectively separatedfrom thespecific ecologic, economic, social,andpublic lands management contextsin which roadsexist or areproposed(GUCINSKI et al. 2001).Across a forest or river basin, the access needs, economic dependencies, landscapesensitivit ies, downstreambeneficial uses of water, and so on can be reasonably welldefined,but theserelationstendto differ greatly from place to place.An effective synthesisof roadissuesdrawslocal expertstogether to thoroughly evaluateroad andaccessbenefits,problemsandrisks,andto inform managers about what roadsmaybeneeded, for how long,
29
for what purposes,andat whatbenefitsand coststo theagency andsociety (POZZATI 1979;HIPPOLITI et al. 1997;CIELO andGOTTERO 2004).Roadeffectsandusesmaybesomewhatarbitrarily dividedinto beneficial anddetrimental.The largest group of beneficial variablesrelates to access (TUFTS et al. 1988; HIPPOLITI
1988, 1989 and 2003; KELLOG et al. 1996a and 1996b; LANFORD and STOKES 1996;GREULICH 1997, WIEST 1998). Access-related benefitsmay be identified as harvest oftimber andspecialforestproducts,grazing, mining, recreation, fire control (CALVANI et al.
1999; BOVIO 2001), land management,researchand monitoring, access to privateinholdings,restoration (CHIRICI et al. 2003), local communitycritical needs, subsistence,and the cultural value of the roads themselves. Nonaccess-related benefits include edgehabitat, fire breaks,absenceof economicalternatives for land management,and jobsassociatedwith building andmaintaining theroads.Undesirable consequencesincludeadverseeffects on hydrology andgeomorphic features(such as debris slides and sedimentation)(WEMPLE et al. 1996; FURNISS et al. 1997;GUBIANI 2004), habitat fragmentation (REED et al. 1996;FORMAN et al. 1997), predation,road kill, invasion by exotic species,dispersal of pathogens, degraded water quality(GRAYSON et al. 1993)andchemical contamination,degradedaquatic habitat (ALEXANDER
andHANSEN 1986; CORN and BURY 1989; WELSH 1990), useconflicts, destructive humanactions (for example,trashdumping,illegal hunting, fires), lost solitude, depressed localeconomies, lossof soil productivity, anddecline in biodiversity (HEYWOOD andWATSON
1995; FORMAN andHERSPERGER1996).
1.1.6.1. Roads classification
When speaking of forest roadsit is necessary to understand that there is not only oneclassification, but it dependson theproperty of theroad,on the areas it cross and serve, ontheaccessregulation(with or withoutpermission).From a juridical point of view, roads are divided in public and private roads.The mainNationalrulesare:
- L. n. 224820/3/1865on “public works”- Decreto luogotenenziale n. 1446 1/9/1918 on “constitution of public Consortia for
building androadmaintenance”- L. n. 12612/2/1958 on “classificationandmaintenanceof roads”- D. Lgs.N. 285 30/4/1992modifiedby L. 2141/8/2003: thenew“road codex”
Public roadshavepublic interestandaccess. If the property is also public (State, Region,Province or Municipality) theyareincludedin thesocalled“Demaniostradale”, if theyareprivatestheyarecalled“stradevicinali” (proximity roads).In this casetheMunicipality hasthe right of use and it has competenceon the police patrol. The roads included in the“Demanio stradale”are classified, that meansthey are recordedin public databases(LA
ROCCA 1996). Databaseof proximity roadsis not compulsory.ThenewRoadCodexclassifiesroadsby a technical andfunctional criterion:
30
A – highwaysB – principal rural roadsC – secondaryrural roads(almosttwo sides)D – urban roads (highspeed)E – urban district roadsF – local roads,ruralor urbannot includedbeforeFb – hikeand bike roads
Roadsincludedin lettersB, C andF, links cities and townseachothers andare alsocalledNational-, Regional-, Provincial- or Municipality-roads. The maintenance of proximityroads (if privatebut with public access)is partially paidby themunicipality (from 20%to50%).Privateroadsmaybedividedin:farmroadswhentheyareinsidea farmand theyareusedonly for internalactivitiesproximity roads that are ownedby peopleliving near the road andwho contributed withmoneyfor their building.Ownersmaybeassociatedin Consortia
municipality roadsownedby the town. They are usuallyclosed to accessbut they canbesubjectedto civic rightsasforestsare.Whentalkingof a rural-forestroadnetworkit meansa groupof rural roadsdrivenby motorvehicles and used as main purpose to managerural areas, pasturesor forests. If they areusedmostly with forest purposesor they lie inside forest, they are called forest roads.Similarly, if they areusedonly for agriculturethey are called rural roads or pastureroadswhenused asaccessin reachingmountainpastures(figure1.1.6.1.a).
Figure 1.1.6.1.a:classification schemaon road function basis (IPLA 2001; CIELO et al.2003)
Forest roads may haveother functions than the main one providing access, for exampletheyare alsoclassifiedas:tourist-roadswhenthey crossprotectedareasor protection forests
31
wildland fires protectionroadswhenthey arebuilt to provideaccess of fire-fighting teamsor of watertanksor to cut thecontinuityof wood (firebreaks)wood transport andstoring(piling sites)Consideringthe building structure, roadsmaybeessentially divided in threetypes: truckroads, tractor roads and skidtrails. They can be also divided in native-soil surface oraggregate surface.Native-soil surfacingcanbeusedwhenharvestoperationsare conductedduring the dry season.However, road operations in the wet season require aggregatesurfacing (crushedrock) to increasethe strength of the forest road surface to supportvehicle traffic (AKAY and SESSION 2004). The general classificationin tractor and truckroads concerns the width of the road section and other geometrical parameters (table1.1.6.1.a)
* 1 m should be addedto roadsif they have a ditch on the uphill side or a fill -slope onthedown-hill .
** A shortsection is lessthan 50 m. If there are many steepslope sectionson the road,theyshouldnot be morethan20%on thetotal length.
As an example, the Trentino Regional rule n. 12/2006 classifies forest roads into twocategories:A – forestroadswith accesspurposes:only forest workersor forest enterprises are allowed
to enter. Skidtrails areincludedin thiscategory.B – all roads with mixedfunction(rural-, pasture- and forest roads). Only privateowners or
inhabitantswho have civil rights can drive through. Other people need a specialpermissionthat can be obtainedby asking the owner or the manager of the road(municipality or consortium)
32
The Regional databaseinclude a third category, the L that are junction roads (figure1.1.6.1.b)with forestinterest(seealsofigure 1.1.6.1.a).
Figure1.1.6.1.b:anexamplefrom theTrentoroadshapefil e.
1.1.6.2. Roads, sylviculture and forest mechanization
The traffic needs are connectedto the typology, frequency, economics and level ofmechanization usedin forest or rural management: the environment conditions and theintensity of forestcuttingshavehigh influence on the needsof accessibil ity. Forestswithhigh fertility andyoungtreesor coppiceforests requirea good accessibility becausecuttingwill be frequent(every10-15 years).High standing forests with low yieldsor sitedin highmountain may require lower road density, while protection forests may also be un-reachable.Theposition andthe spacebetweenroadsis to bedefined in relation to thetechnical limitsand the maximum skidding distanceof systems used in forest operations. When smallcuttingsareplanned(10-20 m3/ha) andonly walkingpeoplewill enterthe forest, roads maybemoredistant. Whenskiddingoperationsare donewith machines,it should be consideredthat thereis an optimal working distance(PICMAN et al. 2001): if it is overcome,workingbecome first more difficult and expensive than technically un-feasible (HIPPOLITI andPIEGAI 2000; CIELO et al. 2003). For example,tractorscanwork form 50 to 200m far fromroad, insteadof cable systemsthat are economical till to 1000 m if logs are big. Beforeplanning or building a new road network it is important to know the range of using
33
different machinesconsideringthe slope, logs and making approximations to simplify thechoice.On flat terrain (slope < 25%) tractors and skidders can work even outside roads orskidtrails without any problemof tractionandstability. Theywerethemost productive andcheapsystembefore the introduction of the forwarder. When skidding uphill from fardistances,tractors mayrequirea limitation on heavylogs (not morethan 200m). Firewoodor small logsmaybe loggedon trailer or inside specific mountednests.Theuse of winch iscommonwhen skidding heavy logs. Off-road movementcould be limited on prescribedskidtrails if there are soft terrains or wet areas. On these gentle slopes only terrainroughnessmayobstructthemachinesmovement.On gentle slopes (from 26 to 50%) building new roads is easyand off-road systemsaremorecommon thancablesystems. For theproblemof traction, skiddersmaywork only ondownhill directionandover35%of slopeonly trucked machinesdo it. Tractor with winchcan reach not more than 50-100 meters(figure 1.1.6.2.a), but cablesystems have higherproductivity on far distancesandcancarry heavier logs. When terrain roughnessis high,tractors movement is not possible but can be used high-density polyethylene slides(firewoodor small logs).On steep slopes (morethan50%)andon youngforests, skidding downhill is only possiblewithin 100 m. Skiddinguphill with mobilecable cranes may beeconomically feasible until300-400m (figure 1.1.6.2.b). Whenworking inside high standing foreststhe sledgeyardersystem allow to skid logs up to 1000 m, but it is important that the yield wil l beproportional to thelengthof theline to maintain low costs.
Figure 1.1.6.2.a: forest systems used ongentleslopeterrains
Figure1.1.6.2.c: a simpletableresumingthe maximum distancefrom road for diff erentsystems.
Actually the forestroadgeometricalparameters (maximum slope, width, curve radius) areinadequate to the new technologies.More or less every 15-20 years, new buildingparametersshould bedefined.As happened in thepast, new plantationhave beendone afterthe second world war, but they built small path thinking that mules or horseswould havebeenused in future operations;plantationsneeded long time to be ready for cuttingsandnow thesetracksare too narrowevenfor the smallest tractor, so theyareinadequateevenbeforeto be used. Roadsbuilt on late Seventies have a 2.2 m width that dependon thewidth that had the front excavatorblade.Roadsof that size could not be drive by heavytrucks,nowadaysindispensablefor civil, hydraulic engineering, andwood transportation.Thewidth wassizedto machinesand techniquesof thattimes, building biggerroads wouldhavecosttoomuch.Todayexcavatorshaveat leastawidth of 3 m.
Analyzing the technology development it is possible to observethat machinesbecomebigger(width size,netweightandgrossallowable load),increasetheir abil ity to move evenon steepterrainsandincreasetheir stability thanks to auto-levelling systems. It is estimatedfor the next future that 50-55% of terrain will be reachableby off-road systems(maybemoreif considering high level mechanizationas the harvester-forwarder chain)soneedsofforest accesswill change(CIELO et al. 2003): forest roads will require higher bearingcapacity (new building techniquesintroduce the useof geo-textiles), wide sizesand morespace for piling woodor install cablesystems. With theincreasing technology, thedistancebetweenroadcould bewider andsotheir densitylower.Theroad density is anindex thatexpress the lengthof roads in relationto thearea(m/ha).This parameter can be used the access service given by roadson big sized areas: forexample it canbecalculatedfor a valley, a regionor a State.The roadnetwork variesalsodependingon the yield of forests.In the mostproductive alpine forests, the optimal valuevariesfrom 25 to 35 m of forest roadper hectare (COLPI et al., 1999). Insideproductiveforestslying on gentlesoils thevaluemay increaseup to 50 m/ha. On plain areas,tractorsareableto moveoff-roador on temporary skidtrails, sothevaluedecreaseto 10-15 m/ha.In the Piemonte region, the rural-forest road index is between 5 and 20 m/ha. At thebeginning of the Nineties,forestry roads in Trento province where about 27 m/ha (PAT1991), while in Austria (in 1987) therewere 40 m/ha iside productive high forestsand7m/ha inside protection forests(TREZSNIOWSKI 1990). In VenetoandFriuli-VeneziaGiuliaregion the averagevalue is near 14 m/ha (CAVALLI 2004). This numbers are notrepresentative for theaccessof a singlestand and thedistribution of roads is not rational ifconnectedto forest.Thedifferencedependon the geography:Trentohas all forestslying onmountain, steepterrains,while in VenetoandFriuli forests grow also on hills so the indexis lower because the accessis easier.However the road network is less dense than theoptimal valuesrequired in suchtypical forest areas(BORTOLI 2001).
36
1.1.6.3. National and Regional laws
Therulesconnectedto planningandbuilding rural and forest roads is quite intricate. Someruleson buildings or civil engineeringsometimeshave instructions or describe particularproceduresconcerning forest roads. Rules may be grouped logically, starting from thechoiceof buildingsite, theplanningandthebuildingoperations:
About regional administrative and legislative competences (soil and environmentuse,urban, environmental goods, etc…) sometimes there are important differenceseven ifregionalrulesfollow nationalprinciples(POSTIGLIONE andTROIANI 2001).Next follow the list of valid rules:National rules:General rules:
L. 1150/1942, urbanlawD.P.R. 164/1956, rulesonworkingsafetyduring excavationandbuilding foundationD. Lgs.626/1994,actuationof CEErulesonsafetyand wellnessof workersD. Lgs.242/1996,moreabout 626/94D. Lgs. 494/1996, actuationof 92/57/CEEon safety and wellness in temporary andmobileworking sitesD. Lgs.528/1999,moreabout 494/96L. 10/1977,soil classificationand building rulesL. 109/1994(L. Merloni), law onpublicworksD.M. 145/2000,generalcontractspecificationsD.P.R. 380/2001, UniqueText oncivil buildingsL. 166/2002, transportand infrastructuresD. Lgs.227/2001, innovationandguidelines for forestry sector
Classification of roads:L. 2248/1865, law onpublicworks.AttachedF: public roadsclassification andlawsD. luogotenenziale1446/1918, managing and building roads by group of users(Consortium)L. 126/1958, public roadclassificationandmaintenance; substitutedbyD. Lgs.285/1992, roadrulesL. 214/2003, conversionin law of “decreto”27jun03: theRoadCodex
Environmental laws:R.D. 1497/1939, naturalbeautiesprotectionL. 394/1991, law onprotectedareasD.P.R. 357/1997, protectedareasD. Lgs.490/1999,UniqueText oncultural and environmental goods“Direttiva Habitat” and Natura 2000 net, protected sites as in DGR 4489/2003 and44910/2003 basedonDPR35711/1997“Direttiva Uccelli” (birds),L. 157/1992updatedwith L. 221/2002
37
Technical laws:D.M. LL.PP.11 mar. 1988,technicalruleson terrains, rocks andslopesfor designing,executing andtesting support walls andbuildingsfoundationworksD.M. LL.PP.4 may1990,technicalrulesfor designing,buildingandtesting bridgesCirc. Min. LL.PP.34233/1991, technicalcodes for bridgebuildingD.M. LL.PP.9 jan. 1996,technicalrules for designing,buildingand testing concrete andsteelstructuresD.M. LL. PP.5 nov. 2001,technicalandgeometrical rulesfor road building
Regional rules:Veneto region:
L.R. 52/1978,forestregionallawL.R.: forestmanagementpolicerules(“Prescrizioni di massima di polizia forestale”)L.R. 14/1992,rural-forestroadsrulesL.R. 5/2000,articlen. 9“Deliberazione” 152/2005, att.n. 4
Trento province:L.P.30/1977,fire-fi ghtingL.P.48/1978,forestry sectorandresourcegrowthL.P.11/2007,government of forestsandmountains, riversandprotected areas
Friuli-Venezia Giulia region:L.R. 91/1981,classificationandmaintenanceof public roadsL.R. 6/1982,buildingandmaintainingforest roadsL.R. 34/1984,rulesfor designingforestroadsL.R. 22/1985,roadsregionalplanL.R. 15/1991,motor vehicleaccessrulesfor roads in protected areasL.R. 20/2000 (art. 1) and D.P.R. 32/2003, forestry rules for soils with hydrologicalproblemsL.R. 14/2002(art.51 andrules)Environmental rulesfor changingtheuseof soilsL.R. 9/2007,ruleson forestresources
When building a new roador whenextramaintenance is needed, authorization should beasked asprescribedby lawson thehydrogeological and environmental bond, or, if theworkis heldby privates,thegrantconstruction is necessary. Theordinarymaintenancedoes notrequireanypermission.
1.1.6.4. Planning and building projects
Trentino
TheForestServicein Trentoprovincehasto makea planto preventforest wildf ires(figure1.1.6.4.a). Inside the plan forestsare classified according to their burning risk. All themanagementandbuilding of infrastructures, both for preventing and for theactivefight,arein chargeof theProvince.So,evenall roadsthat areplannedinside high risk areasor whichhave the forest fires function are built with public money. The project of all the other
38
function roads maybedoneby private forestersconsultant, but they haveto beapprovedbythe forestservice.The project usually musthavea general map (scale 1:50000)that shows how the road islocatedon the environmentand if it hassome limitationsdueto otherurbanor territorialplanning. Then there are a more detailed plan with the road track (1:1000) and alongitudinal profile thatshowstheaverage slope andsections of excavation or filling. Moredetailed transversal sectionswith the evaluation of ground or rock cubic metersto beexcavatedaredrawn in a 1:200scale(figure1.1.6.4.b).
Figure1.1.6.4.a:the forestwildfire prevention planandaproject of anew road
In Venetoregion all the roadsareprojected by professional foresters except in somecaseswhentheroadis insidea regionalor national park(figure 1.1.6.4.c). In thatcase, the roadis
39
plannedby regional forest services.Before building it is usually necessary to askfor a grantconstruction the municipality andalsoask for an authorization to regional forest servicesandtheparkcouncil if it is insidea protectedarea.If the lengthis more than10 km or theroad lies on a SIC area,it is also requested to write an environment impact evaluation(VIncA) that wil l be judged by a regionalcommission. The most important thing whenbuilding a road inside a protectedarea is also to make a work well integrated to theenvironmentusing preferablymaterial found on the place (figure 1.1.6.4.d). The projectshould includeall mapsandevaluationof volumesasin Trentoprovince(figure1.1.6.4.e).
Figure 1.1.6.4.c: the working siteof a roadbuilt inside“ParcoColliEuganei” (Padova) with wildfireprevention purpose
Figure 1.1.6.4.d: the same road two years afterconstruction. Spontaneousvegetationhas well re-colonizedroadhedges.
Figure1.1.6.4.e:projectandquotedprofile n. 5 (MARTELLO 2005)
40
Friuli-Venezia Giulia region
In Friuli-Venezia Giulia it’s similar to the Veneto situation, but there are someforestersmoretrainedin planning roadsandusingmorepowerful instruments. For exampletheyusea laserto measuredistancesandanglesand data are stored on a small portablecomputer(figure 1.1.6.4.f). At homethedataaredownloadedon a pc andthrougha specific softwareit is possible to draw the terrainprofile andchoose which is the best locationfor buildingthe road. Automatically also the general plan is drawn and longitudinal and transversalprofiles with the estimation of groundvolumes(figure1.1.6.4.g). This is a very powerfulinstrumentbecauseit is possibleto optimize the volumes reducing environmental impactsandcosts.It is alsopossibleto insertwalls and drainagesystems to prevent themovementof sediments.
Figure 1.1.6.4.f: the instruments(laserand palm) used during survey and the planningphaseasit appearon thecomputerscreen
Figure1.1.6.4.g: sectionof a projectwith corresponding profiles (SOLARI 2005)
41
The projectof a new roadhasto follow a quite intricateprocedure beforeto be approved(figure 1.1.6.4.h). All authorizationareusually obtained in a time that varies from 3 to 5monthsdepending on thesizeof thework (if morethan10 km or it is insideprotectedareasit requireVIA or VIncA). Usually professionalconsultants earn money in proportionwiththe total cost: this is about 10% divided in 6% for survey and project and 4% to leadbuildingoperations.
Figure1.1.6.4.h:theapprovalprocedurein FVG region
1.1.6.5. Road management with GPS-GIS systems
Often themanagement of a roadnetwork is easiest with theuseof GIS softwaresintegratedwith GlobalPositionSystemsto verify track or to up-load new information.PELLIZZARI (2002) madea studyabouttheapplicationof a systemcombining GPS andGIStechnologies for surveying the infrastructures and the obstacles of roads to produce athematic cartography supporting the firefighting operations. The study provided thecreation of a data dictionary and the digitalization of surveying tables/schedules aboutinfrastructuresandobstacles(aspull-in areas, point of reverse,watersupplies, helipadsorobstacles on the groundandin-flight). The real time GPStracking has been experimentedto capturing newgeometries,combinedwith a real time fi ll ing in a dataentry form (figure1.1.6.5.a) with the most interestingparameters for firefighting features. Working in realtime wasa greatadvantagebecauseentrydata did not need anyparticular post processingreview. The result of suchan applicationis a database which can be managedon a GISplatform for producing thematic maps (figure 1.1.6.5.b). These maps are useful forpreventing wildfires risk, planning infrastructures, identify the weakpointsor for a betteractive fight coordination.
Figure 1.1.6.5.b: access map for differentclass firefighting vehicles
The useof GPSis powerful whenthereis a big areathat need a managementplan, asthecaseof a mountain community. Inside a project the Dept. TeSAF had with ”Feltrina”Mountain Community (CM), the shapeof new built forest roads wascheckedusingGPSmountedon a car in a tracking option (recording 1 point every 5 or 10 seconds). Due to alow quality positioning, data were post-processed with the use of a second fixed GPSantenna. More over, they were checked overlying georeferencedaerial photographsandlinkedto theexisting public roadnetwork. Sucha work hasto aims: thefirst oneis to checkthe forest road accessfunction andidentify which areas need new roads(or viewedon theother sideof the mountaincommunity technician, to havean objective map or indexestojudgeand accept/refusenewbuilding projects); thesecondaim is to haveinside a databaseall information they needto managethe road net. During the survey, many data werecollected, the average slope,averagewidth, switchback curve radius, the road pavementtype, the presence of longitudinal or transversal works and their need of maintenance.Manyphotographs werealsotakenfor each describedpoint andlinked (figure 1.1.6.5.cand1.1.6.5.d) to the geographical database. The CM has so the possibili ty to plan themaintenanceandestimate theyearlycosts (duealso by theVenetoregional law n. 19/1992andn. 39/1999: maintainaccessonpublic roads).
Figure1.1.6.5.d:thedatabaseandphotorelated to each forestry road
44
1.2. THE IMPORTANCEOFPLANNING
Wood chain is a multifacetedprocessinvolving peopleand machinesunderinfluencesofseveral environmental, ecological,social and economical factors. Througheach step of thechain, wood increasesits value. Cutting, skidding and hauling operationscould be veryexpensivebecauseof hardforestoperation environmentandnot-efficient working system.Consequently timber value could be depreciated up to the point that wood is not cutbecause it is not convenient.Logging and transporting optimization are becoming, thus,evermorea key factorto beimproved.For this reason, studies andanalyseson wood chain,mainly basedon modelingandplanningtool have beenin thepast developed andtoadyarestill increasingdue to the introductionof powerful software as Geographical InformationSystems.First interestandapplicationson modeling andplanningby developing Decision SupportSystem(DSS)were primarily relatedto military needsand to estimatetrafficability of soilfor off -roadvehicles (AA.VV. 1961;ANDERSON1985; BONASSO 1989). Theseapproacheswerethentransferredto manysectorsof agriculture andforestry (SAMSET 1975; ROWAN
1977;MELLGREN 1980; LÖFFLER1984).Accessibilit y maps and analysis on planning forest operation have been developedpreventing damages to wetland soils and ecosystems (WRONSKI 1989; AA.VV. 2002;EICHRODT 2003; CAVALLI 2005; MURPHY et al. 2006).In steepAlpine areas,whereforestmanagementaims at different forest functions, modeling represents a complex analysisconsidering also not productive forest function (HEINIMANN 1999; DEL FAVERO 2000):densityand size of remainingstandingtrees (clear cuttings are forbidden), for example,haveanhigh influenceonskiddingoperations.Moreover,planning models haveto considernot only environmentalandstandfactorsbut also canbedeveloped to support preventionofsoil compaction damages (ZIESAK 2003). Also many works have considered theoptimizationof different skiddingsystemsin relation to differentmachinesize, as for cablecranesand forest operationconditions(HEINIMAN N 1986 and 1994; LÜTHY 1998; KRČ
1999, CHUNG et al. 2001). Further interestscould be oriented to develop models andsupport systemsin orderto preventalsoforest workersinjuriesandconsequently increasingsafetyof forestoperations(GANDASECA et al. 2001).In thecontemporary sense,considerationmust begiven to theimportance of theforestasasourceof non-wood forestproductsandenvironmental services,as well as its role in theconservationof biological diversityandcultural values. Timber harvestingoperations mustthereforebe plannedin sucha way asto accommodate, andwhere possible enhance thesemultifunctional characteristicsof theforests (BALDINI andPOLLINI 1998).Thinnings operationsare designed to remove someof the trees in order to enable theremainderto thrive, which is an essential sylvicultural operation. During first thinningoperations, it is necessaryto open up access routes (trails) within the forest for use byharvestingand extractionmachines. As the trails are the only routesfor the machinesto
45
operate, they can becomebadly damaged due to repeated trafficking. The “t rails” layouttypically consistsof short “side trails” (along which the timber is gathered)leading into“main trails” which act as theprincipal routes out to thestackingpoint. As the main trailsarethe most highly trafficked,mostdamage (e.g. deeprutting in excessof 0.3 m in somecases,soil compaction and tree root damage) may occur along these routes. The maintraffic source through the forestis the forwarders, astheyhaveto makerepeated journeysto and from in order to collect the logs. In contrast, the harvester fells the treesas itprogressesslowly alongthetrails andgenerally has no requirement for repeatedtraffickingof the trails. In a clear felling operation,machinery movement is less restricted, hence,forwarderscan reducethe numberof passes along the sameroutesin order to minimiserutting and soil damage.Soil damagecan also be minimised by effective use of brash i.e.stemandbranches with diameterbelowtheminimumset for utilisation (AA.VV. 2002).Dependingon the soil typessomesoil structural changeis an inevitableconsequence ofmechanisedtimber harvestingoperations.Such damageis of particular importanceif itimpactsnegatively on theenvironment (e.g. acceleration of reducedinfi ltration and surfacewater run off into watercourses). Mechanised timber harvesting operation should beplannedand executed in sucha manneras to avoid suchpotential environmental impact.Somesites are more “sensitive” to environmental damagethan others.For example,wetpeatsoilson sloping groundcanposeconsiderable difficultiesfor environmentally efficientharvestingoperations (NUGENT et al. 2002).Theenvironmentalimpactsof mechanisedharvestingoperations depend on several factorssuchas site type, matchingthe machinery to the site, machinery operation, layout of thetrails so as to minimise trafficking by the forwarders. The time of year during which theoperationsarecarriedout mayalsobeimportant (HINZE 1990). For example,harvestingoncertain peatsoils may be feasible only during the summerwhenthesoil is relatively dry orduring thewinter in cold climates(suchas Finland) whenthesurfacesoil is frozen.A key factor in determining the environmental impact of mechanised timber harvestingisthe potential risk of run off water entering local streams, rivers or lakes. For example,traffic damage in trails (suchassevererutting) only posesa significant environmental riskif it channels surfacerun off water into a watercourse. Some rutting or soil scuffing isinevitable when dealing with mechanisedharvesting operations on sensitive sites, butjudicious selection and operation of the machinery system can minimise the potentialsite damage. However,given that this risk exists, the overriding principle mustbe one ofcontainmentof water flowssoasto minimise therisk of run off intowatercourses.While itis importantthatdamagealongthetrails is minimised, this must becombined with planningthe rack layout to includeriparianbuffer zones,which minimise the risk of direct run offinto watercourses(WRONSKI and HUMPHREYS 1994). Rehabilitationoperationsafter theharvestingand extraction that includes levelling of deep ruts and establishing surfacevegetation may be necessaryalso. Soil erosioncan posesignificant environmental riskwhen mechanisedtimber harvestingis carried out on sloping sites, particularly in dry
46
climates (e.g. Mediterraneancountries). Severe scuffing exacerbates the effect, hence theselectionand operationof the mechanisation system is important in containing the risk.Scuffinghastheeffect of looseningthesurface layer,hencepredisposes it to erosionfromwind or rain.The sensitivity of a forestsite encompasses a broadrangeof issues such asaestheticsandsocial functions, inherentarchaeologicalfeatures, economics, and potential environmentaldegradation such asthepollution of watercourses.Oneprincipal aim of planningis how tominimise the impact that mechanisedharvesting operations can haveon the environment.With this consideration, the following definition of a sensitive site may be adopted(NUGENT et al. 2002):“A sensitive forest site is where alterations to normal mechanised harvesting practices are
required in order to avoid adverse effects on the ecological, economic and social functions
of the forest”In this context,thesitesat risk of degradation asa result of timberharvestingandextractioninclude:areaswith gleysoils,particularlyon sloping terrain, andwherethereis insuff icientbrush to minimise surfacedisturbance;poorly drainedshallow peat soils (less than 1 mdeep)oftenwith inferior treecropwith limited amountsof brash; deeperpeat (greater that1m), usually with good drainage networks which present very dif ficult harvestingconditions; low organicmattersoils on steep slopesin areas prone to droughtand suddenspells of high rainfall (asoccur in Mediterraneanareas). The percentage of total forestedareain Europe that is classifiedassensitive rangesfrom 5% to 25%,depending on country.For example, 50% of forestedarea in Italy is on steep terrains (more than 40%) andprotected areasasSIC or ZPScover in Nort-eastern Italy more than 50%of the productiveforests.Ground skidding comprisesa significant proportion of harvesting operations in southernEuropeancountries. Planningeco-efficient andcost-effective timberharvesting systemsforsensitive sitesshould:1) minimise or eliminate the associatedsoil disturbance (viz. terrain surface rutting, soil
compaction, layer inversion,erosion)that ordinarily may be incurredby harvestingandextractionoperations
2) minimise the damage to residual tree crop andseedlings, in thinning operations andnatural regeneratingstands,respectively
3) minimise or eliminatethedamage to natural watercourses, and artificial drainage andsoil protectionstructureswithin or adjacent to the harvestedareas
4) optimise the productivity of the extraction operation, i.e. deliver the trees/logs tolandingsat economic ratesandwith minimal loss of volume and/or quality, and
5) ensure the safety of the extraction crewsand other personnel involved in the relatedharvesting processes,by ensuring that only skil led operators are engagedfor planningand execution of theharvestingandextractionworks.
47
Within the first threepoints thereare five main categories of site damageand secondaryenvironmental degradation that can occur due to the operation of timber harvestingmachinery.Thesecanbedividedin categories as follows:1. Rutting: repeated passesof heavy machinery along the same route lead to the
development of ruts.Rutting is a phenomenon closely associatedwith soft soils,suchaswet peatsor gleys. On most of thesesoils the rutting effect is incremental with eachmachinepass,but is mostpronouncedin thefirst 1 to 2 passes. In extreme cases,suchaswhere inappropriate machinery systemsare used, the soil structure can become sodamagedthat it turnsinto a liquid slurry (socalled “slurrying”)(figure1.2.a).
Figure 1.2.a: rutting after 10 passesof awheeledforwarder (with 8 t load)along amain extraction trail comprising a shallowgley soil overlying solid foundation
Figure 1.2.b: Forwarder (with 8 t load)operating on a waterlogged site with ashallow(<700mm depth)solid foundation.The machine causedsevere rutting as itsank right down to the underlying solidstratum. This is also a risky situation forworkingpeople.
2. Soil compaction: the developmentof ruts (as outlined above) is in effect an outwardmanifestation of soil compaction(figure 1.2.c). The soil beneath the ruts becomescompacted,with the zone of maximum compaction extending to a depth equal toapproximatelyhalf the rut width (viz. the zonetypically extendsdown to ca. 300 mm).This compactionwill reducethewater infiltr ation capability of thesoil hencemaking therut an excellent channel for surface water flow. It is therefore very important that thenetwork of ruts, resultingfrom forestmachinery operationsare remediated anddo notchannel waterinto watercourses.
48
Figure 1.2.c: typical moisture related soil structural alterations after traffic. Up tomoisturecontentsof w = 26% total pore volume and coarse pores show little effectsonly, while moisture contentsaroundliquid limit leadto a complete lossof soil structuraldiversity (=soil damage)(MATTHIES et al. 2006).
3. Surface disturbance: Forestrymachinesrely on slip betweenthe wheels (or tracks) andthesoil (figure1.2.d) in order to generatedthe requireddrawbarpull. Themagnitudeofthis slip dependson several factorssuchas soil condition, vehicleweight,tyre (or track)type, inflation pressure, drawbarpull requirement and several other soil and vehicleparameters. Damagedue to slip includes smearing of the soil surface,mixing (anddislodgment) of componentsof theuppersoil layer (top 50 mm or so),root damageand,in extremecases,a breakdown in the structure of the top layer of soil leading to“slurrying” in wet soils. Looseningof the soil surfacecan lead to significant erosionproblemsin dry climates,suchas in certainMediterraneansitesafterrainfall.
49
Figure 1.2.d: on the left a cable-forwarder corridor with 40% steepslope. On the right,without thehelpof thewinch, thewheels slip andarecauseof surface damages(ZUCCOLI
BERGOMI 2006; CAVALL I et al. 2006)
4. Residual stand damage: Traffic inducedstand damagecan be important in thinningoperations. The processof soil compaction,outlined above, leads to compaction ofroots, particularly thosein the maximumcompaction zone(viz. down to ca. 300 mm).Such compaction when associated with rutting may make the trees besidethe tracksmore prone to tipping over in heavy winds. In addition, roots may become exposed(figure1.2.e) asa resultof a tearingactionby thewheels (or tracks), andthis canreducesubsequenttree growth and allow entry of pathogenic fungi (ISOMÄKI and KALLI O
1974). Theextent of suchroot damagedependson thedegreeof rutting and theseverityof the machine’s action(ČERMÁK et al. 2006). The useof metal cleats(track shoes)toenhance machine flotation exacerbatesthe effect. As rut depthscanextendto 500 mmon poorly maintainedmain extraction routes, this implies that root damagemay not beconfined to surface roots and can have a significant negative impact on the residualtrees.RUMMER and KLEPAC (2002)studiedthe differenceon residualtreedamagewhenharvesting with manual felling or mechanized (harvester) system. They found arelationshipbetweenthe distance from the extraction trail andthe incidenceof scarring(figure1.2.f). Fifty percentof thedamagedtreeswere located from 1.5 to 3 m from trailcenter (table 1.2.a). Since the harvesterhad to processand pile treesalong the skidcorridor, more trees were damaged than during manual operations. Only 5% werelocatedmid-reach(3 – 4 m), with the remaining45% located4 – 7 m from trail centre.This likely reflects the difficulty of handling treesat the extreme limi ts of the boomreach. LIMBECK-LILIENAU (2003) found that the cut-to-length wheeled harvester-forwardersystemcausesthe lowestnumberof damages to remaining trees if comparedto trucked harvester-forwarder, harvester-sledge yarder and chainsaw-cable yardersystems.During thinnings,steep terrain and cutting intensities may be the reason forhigher damagelevel.
5. Soil erosion and accumulation of sediment in streams: Input of soil to the watercourses(increasedsuspendedsolidsandsedimentation on thestream bed) is potentially themost
50
significant change in the environment surrounding the forests. Erosion can beparticularly severe in hot dry climateswith occasional short periodsof veryhigh rainfall.Harvesting canincreasesoil input to watercoursesespecially in mountainousareas by avariety of processes,including:• surfaceerosion from landingsandskid trails;• slopefailurecausedby theremovalof vegetation;• physical damageto thestreambanks,suchasslippageand bankcollapse,and;• increased surfacerunoff asa resultof clear fell operationsThe environmentalimpactof the aboveprocesseswill depend on the proximity of theharvest site to watercourses,the expanse of the disturbed areas, site-sensitiv ity,topography,weatherconditionsandtheintensity of the harvesting operation.
Figure 1.2.f: frequency of damagedtreesfromskidtrail centerin theharvesterplots
Figure 1.2.e: illustration of damageinflicted by machine traffic on anexposedroot
Forestersshould considerthe technologywhen planning yield andcuttings inside a foreststand.If enterpriseswill not havetheright machinesor thereare not enoughforestroadstoenter the forest or the value of wood get lower and operations will not be economicallyviable, cuttingswill not bedone.And if this will happened,thework of theforesterand theecologicalvalue of cuttings will looseall their significance(LUBELLO et al. 2007). Even
51
more forestswill be abandonedand the cultural and social value of the environmentalmanagementwill be lost.Thinnings or selective cuttings should also be planned in a way that makes themeconomically feasible,reducing at the minimum fixed costs andproviding the enterprisesof alsosomegoodassortments.But thework of forester should not bedeleted by themanwho have to sign the trees which must be cut and which not. He should have readprescription as reported on the forest managementplan and he should also know whichutil ization systemswill be used.With this knowledgehe shouldadapt the yield amount tothesiteconditions:asanexample,signedtrees wouldnotbefar fromroadmorethan 150mon gentleterrains if tractor with winch is used.Otherwise skidding operationswill causevery high level of standingtreesdamage.Theproblem is whena wrong cut effectsan economical loss.The useof cable systems,forexample, should be carefully planned.The table 1.2.b showsthe results of two differentextraction sitewheretheaveragediameterswhere thesame, and soalso thecut volume,buthaving mounted and dismountedthreecorridors (that wherenot planned) instead of onecausedhigher operationcostsanda lower selling pricewhich gavea 13780 € total loss (13e/m3 lessthanexpected). Moreovertheyield of thesecond working site was700 m3 with alow rateper hectare (asusualin thinningsoperations), but installing the threelinesneededto clearthecorridor and300 m3 more wherecut (43% more)with a big ecological impacton the site becauseit changedthe normality of the population(numberand diameteroftrees).
Table 1.2.b: the effect of wrong cable crane planning operations (GRIGOLATO andLUBELLO, 2006)
Working site1 Workingsite2Cablecorridors 1 3Cutting type Final cutting(clear cutting) Selection cuttingPlannedyield 1000m3 700m3
Unit yield 75m3/ha 13.7 m3/haAveragediameter 34cm 34cmCut wood 1070m3 1060m3
Clearingcorridors 70m3 360m3
Cable craneindex 1.74m3/m of cable 0.57m3/m of cablePrices
Roadside 98€/m3 86 €/m3
Harvest-skidding 42€/m3 37 (planned)50 (real)€/m3
Standingtree 56€/m3 49 (planned)36 (real)€/m3
Total selling 59920€ 5194038160€
Inside high forests with high value logs it should be planned to use high mechanizedsystemsasforwardersor cablesystemson steep terrainsto give to the wood a little morevalue.Sawmillspayfrom 2 to 3 €/m3 more clear logs(SAMBUGARO 2006), in fact dirty logsdragged on thegroundmaypick upsomesmall stonesthatcouldbreakthesaw-teeth.
52
Ensure the safety
A goodplanning may helpregionsor provinces in organizing training and learning coursesfor operatorson thebasisof enterprisesneedandnewtechnology.A workers illnessis madfor him, but hasalsosomenot negligible social costs. New machinesfollow Europeanrulesandprovidesaferworking site ( thinking for example of a worker sitting insidea harvestercabin:he is far from cutting tools,he do not breath chainsaw smoke,he is protectedfromfalling branches,etc…), but working rhythmsand new posture of the body introducenewillness more common to video-terminal workers (e.g. musculoskeletal disorders)(AXELSSON and PONTÉN 1990; SYNWOLDT and GELLERSTEDT 2003). One of the riskiestthings in forest is walking (table 1.2.c and 1.2.d), meaning falling, so a good forest roadinfrastructureand a goodsitespecificplanningshould improveworkerssafety.
Table 1.2.c:forestworkersaccidentsin 2001 in Trentoprovince(PAT 2002)Forestworkers 236<10daysstopaccident 15Up to 20 6Up to 40 3>40days 7Total 31 (13.4%)
Table 1.2.d:wheretheaccident tookplaceandwhich part of thebodyhit (PAT 2002)shoulder eye face arm breast hand leg knee back others total
Forest resourcemanagement is the art andscienceof making decisions with regardto theorganization, use and conservationof forests and related resources (BUONGIORNO andGILLESS 2003).Forestsmaybeactivelymanagedfor timber,water, wildlife, recreation,ora combination of their functions(COSTANZA et al. 1996). Managementalso includesthe“hands-off” alternative:letting naturetakeits course,which maybe thebestthing to do insomecases.Forest resourcemanagersmust makedecisionsaffecting both the very long-term future of the forest and day-to-day activities (WILLIAMS 1992). The decisions maydealwith verycomplexforestsystemsor with simple parts.Thegeographic area of concernmaybeanentire country, a region,a singlestand of trees,or an industrial facility. Someofthe forestresourcemanagementproblemswhich canbeconsidered include:
- schedulingharvestingandreforestation in even-agedforests to best meetproductionand/orecologicalobjectives
In tackling problemsof this sortandmaking related decisions,forest managersusemodels.Models are abstract representationsof the real world that are useful for purposes ofthinking, forecastinganddecisionmaking.Models may be very informal, mostly intuitive, and supported by experience andinformation that is not put together in any systematic manner. Nevertheless, in the processof thinking about a problem, pondering alternatives, and reaching a decision, oneundoubtedly uses a model, that is, a very abstract representation of what the real-lifeproblem is. Most decisionsaremadewith this kind of informal model. Theresultsmay bevery good,especiallyfor a smart,experiencedmanager,but the process is unique to eachindividualand it is difficult to learn.
54
Forestmanagershavelongusedmore concrete models. Somearephysicall y very similar towhattheyrepresent.For example,a foresthydrologist mayuseasand-and-water model of awatershedthatdiffers from therealwatershedonly with respect to scaleanddetails.Wateror a liquid of higher density is madeto flow throughthemodelat varying ratesto simulateseasonal variation in precipitation and flooding. The resulting erosion is observed,andvarioussystemsof damsandleveescanbetested usingthismodel.A forest map is an example of a more abstract model. There is very litt le physicalcorrespondence betweenthe map and the forest it represents. Nevertheless, maps areessential in manyforestryactivities. Fewmanagementdecisionsaremadewithout referringto themto define the location andthe extent of activitiessuchasharvesting, reforestation,campground development, androadbuilding.Mathematicalmodelshave little visual analogy between the real world and the model.Reality is capturedby symbolic variablesand by formal algebraic relations between them.Despite or because of their abstraction,mathematical models are very powerful. Thesemodelsarenot newin forestry.For example, tabularand mathematical functionshave longbeenusedto expressbiometricrelationships betweena stand volumeper unit area,its age,andsite quality. Foresteconomistslong ago developed formulas to calculate the valueofland as function of its expectedproduction, forest product prices (both timber and non-timber), management costs, and interest rates (BRACK and MARSHALL 1996). Theseinvestment models are fundamental to forest resource decision making. In general,mathematicalmodels can tackle problems with a very large number of variables andrelationships.This makesthemwell suited to complex, real-life managerial situations.
1.3.3. Systems models
Forest resource managementproblems involve many different variables. Some arebiological, like the growth potential of a particular species of treeson a particular soil.Othersare economic,li ke the price of timber and the costof labor. Still othersare social,like the environmentallaws that may regulate for whom and for what a particular forestmust be managed.Often, thesevariables are interrelated. Changes in one of them mayinfluencetheothers.All these variables andrelationshipsthat tie them together constitute a system. Because ofthe complexity of the real forest resource systems, foreseeing the consequences of aparticular decision is not aneasy task.For example, to increasethediversity of the treesina forest,we may think of changing the method, timing, or intensity of harvesting (REED
1986; HEMM et al. 2006). But whatexactly is the relationbetween harvest, or lack thereof,anddiversity? How muchdoesthefrequency andthe intensity of theharvestmatter? Whatis the effect on the long-term healthof the forest of taking sometreesand leaving others?What is theeffect of changingtheharvesting patternon the timber incomefrom theforest?How much will it cost,if anything,to increaseforest diversity?
55
Systemmodelsaremeant to helpanswersuchquestions. Theyare tools that managerscanuseto predict theconsequencesof their actions. In a sense, a model is a device to bring thereal world to the laboratory or to the office. As HELLRIGL (2005) stated: the dreamforforesters is to have the forest inside their computer. Managerscan, and do carry outexperimentswith models that would be impossible in reality. For example,they can tryseveral management alternativesona modelof their forestand observe the consequencesofeachalternative for manyfuturedecades(WOOD and DEWHURST 1998; HINRICHS 2006), athing that is impossibleto do with a real forest. It is this abilit y to experiment andpredict,to ponderdifferentchoices,thatmakesforest systemsmodeling such anexciting endeavor.Someof thefirst systemsmodelsandthe methods to solve themweredeveloped during theSecond World War, to assistin military operations (U.S.ARMY, 1961).This led to a bodyof knowledgeknown as operations research or management science (BUONGIORNO andGILLESS 2003, HEINIMANN 2007). After the war, operationsresearchmethods beganto beapplied successfully in industry, agriculture and government. The first applications ofoperations researchto forest management problems date from the early 1960s. Theirnumber hasbeengrowing rapidly sincethen. The Society of American Foresters hashadfor many yearsan active OperationsResearch Working Group. A similar group existswithin theInternationalUnionof ForestResearch Organizations (IUFRO Division3). Several modernsystemsmodelsin forest resourcemanagement combine the methods ofoperationsresearchandthoseof economics. Economics remains an essential part of forestresourcemanagement:evenwhentheobjectivesof managementarepurelyecological,suchasin designinga conservationprogram,economics are neededto compare thecosts,if notthebenefits, of alternativeapproaches.
1.3.4. The role of computers
Althoughsystemsmodelsareformulatedvia mathematics,mathematics alonecannot makethemwork. Thereasonis thatonly very simple mathematical modelshaveexact analyticalsolutions. For example,a simplistic model of the growth of a deer population in a forestwould state that the growth proceeds at a rateproportional to thenumberof animals. Thatrelationcanbe expressedasa simpleequation, a solution of that equation would give thepopulationsizeasa functionof time. In fact, thegrowthof thepopulation is alsoa functionof the amountof food availablein theforest, which itself changes at a rate thatdepends onthewaytheforestismanaged,andsoon.To model theserelationshipsproperlyoneneedsasystemof equations for which thereis no exactsolution,only approximateones.This exampleis typical of systemsmodels.By their very nature, they do not haveexactanalytical solutions.They mustbe solvedby numerical methods, that is to say, essentiallyby trial and error. But algorithms can decrease the number of trials considerably.Algorithms are methods of calculation that ensure that, starting from a roughapproximation, a goodsolutionis approachedwithin a reasonablenumber of steps.
56
Algorithmshavelong beenusedin approximating solutionsof equations. But thepowerofalgorithmshas been increasedimmenselyby computers. The advent of computers hascaused a scientific revolution similar to the discovery of differential and integralcalculus.Problems that a mere50 yearsagocould not evenbe considered arenow routinelysolvedin a few seconds on a personalcomputer.Computerscan now easily determine the bestsolution to problemswith severalthousandvariablesand as many constraintson thevaluesof thesevariables.Thesearchfor optimality, that is, seeking not just a solution but thebest
solution among a possiblyinfinite number of solutions, is a recurring themein operationsresearch.
1.3.5. Good models
Theavailability of powerful andcheapcomputersis not without dangers.In forestry,asinother fields, it has often led to the development of many awkward, expensive, andcumbersomemodels. A good roadmap does not need confusing topographical detail.Similarly, the best forestsystemmodelsareusually the simplestonesthat reflect the keyelementsof the questionto be answered.Too manytimes, models havebeensought thatcould “do everything”.It is usuallybetter to precisely define theproblemto besolvedandto limit a modelstrictly to thatproblem.In this respect,onecanrecognizethree elements inmodel development: problem definition, model building and model implementation.Thereis a tight dependencybetweenthem.A well-definedproblemis half solved,andthesolution of a well-definedproblemis likely to be readily understoodand implemented.Tobeanygood, modelsmustultimatelyhelp managers make decisions. Thus, it is unfortunatethatmanagersdonot usuallybuild modelsthemselves.A recent development that is helpingto bridge the gap between forest resource managersand model builders is the popularity of computer spreadsheets.Most managers are nowusing spreadsheetsroutinely for a variety of purposes. Modern spreadsheets havesophisticated built-in functions, including optimizers that avoid the needfor specializedcomputer programming. A spreadsheetis an idealmedium for managersto developsimple,small, purpose-orientedmodelson their own (BUONGIORNO and GILLESS 2003). A fullimplementation of simple modelsmay requirespecialized software or programming, butthe approachitself ceasesto bea “black box” with little managerial inputor understanding(JOHNSEN et al. 2000).Good modelingis not a way of computing,but rathera way of thinking. More thanfindinga particular solution, good models shouldhelp forest resourcemanagers reasonthroughaproblem in a logical manner.Thus,althoughthe quality of data underlying the model isimportant, it is not critical. Much useful understandingof a problem can be acquired bybuilding a model with very rough data. All important decisions must often be madequickly. Good models do not needthe perfect dataset to materialize. Instead, they helpmake thebestdecisionpossiblein a timely fashion with whatever dataareavailable.
57
1.3.6. DSS and S-DSS models
1.3.6.1. Decision Support Systems origins
The conceptof DecisionSupport System(DSS) is based on the seminal work by Simonand associates in 1950sand 1960s (SIMON 1960). During the years1960s, researchersbegan systematicallystudying the use of computerized quantitative models to assistindecisionmakingandplanning (RAYMOND 1966; TURBAN 1967; URBAN 1967). FERGUSON
and JONES (1969) reportedthe first experimentalstudy using a computeraided decisionsystem.Theyinvestigateda productionscheduling application running on anIBM 7094. Inretrospect, a major historical turning point wasSCOTT MORTON's (1967)dissertationfieldresearchat HarvardUniversity.Scott Morton’s study involved building, implementingandthen testing an interactive,model-driven management decision system.The concept ofdecision support systemswas first articulated by Scott Morton in February 1964 in abasement office in Sherman Hall, HarvardBusiness School (POWER 2007). During 1966,SCOTT MORTON (1971) studiedhow computersandanalytical models could help managersmake a recurring key businessplanning decision. He conducted an experimentin whichmanagers actuallyuseda ManagementDecision System(MDS). Marketing andproductionmanagersused anMDS to coordinateproduction planningfor laundry equipment.Thepioneeringwork of GeorgeDANTZIG andWOLFE (1960), DouglasENGELBART (1962)andJayForresterlikely influencedthefeasibility of buildingcomputerized decision supportsystems.In 1952, Dantzig becamea research mathematician at the Rand Corporation,wherehe began implementinglinear programmingon its experimental computers. In themid-1960s,ENGELBART (1962) and colleaguesdevelopedthe fi rst hypermedia-groupwaresystemcalledNLS (oNLine System).NLS facili tated the creation of digital libraries andthe storageand retrieval of electronic documents using hypertext. NLS also provided foron-screenvideo teleconferencingand was a forerunnerto group decision support systems.Forresterwas involved in building the SAGE (Semi-Automatic Ground Environment)airdefensesystem for North America completed in 1962 (EVERETT et al. 1963). SAGE isprobably the first computerizeddata-driven DSS. Also, Professor Forrester started theSystem Dynamics Groupat the Massachusetts Institute of Technology SloanSchool. Hiswork on corporate modeling led to programming DYNAMO, a general simulationcompiler.Keen and Stabell claim the concept of decision support systems evolved from "thetheoretical studiesof organizationaldecision making done at the Carnegie Institute ofTechnology during the late 1950sand early '60s and the technicalwork on interactivecomputer systems,mainly carriedout at the Massachusetts Instituteof Technologyin the1960s. (KEEN and SCOTT MORTON 1978)". SIMON’s books (1947, 1960) and articlesprovideacontext for understandingandsupporting decisionmaking.
58
In 1960, J.C.R. LICKLIDER published his ideas about the future role of multiaccessinteractive computingin a papertitled “Man-ComputerSymbiosis.” He saw man-computerinteraction asenhancingboth thequality andefficiency of human problemsolvingandhispaperprovided a guide for decadesof computer research to follow. Licklider was thearchitect of Project MAC at MIT that furthered the study of interactive computing. ByApril 1964,the developmentof the IBM System360 and other morepowerful mainframesystemsmade it practicalandcost-effectiveto develop ManagementInformation Systems(MIS) for largecompanies(DAVIS 1974). TheseearlyMIS focusedon providing managerswith structured, periodic reportsand the information was primarily from accounting andtransaction processingsystems,but thesystemsdid not provideinteractive support to assistmanagers in decisionmaking.Around1970 businessjournalsstartedto publish articleson management decision systems,strategic planningsystemsand decisionsupport systems (SPRAGUE and WATSON 1979).DSSevolved asa field of research,development, andpractice during the 1970s and80s(SPRAGUE and WATSON 1996); the SDSS concept has evolved in parallel with DSS(DENSHAM and GOODCHILD 1989). The first useof the term decision supportsystemwasin GORRY and SCOTT-MORTON’s (1971)SloanManagementReview article. They arguedthat Management Information Systemsprimarily focused on structured decisionsandsuggested that the supportinginformation systems for semi-structured and unstructureddecisionsshould betermed“DecisionSupportSystems”.GERRITY (1971) focused on DecisionSupportSystems design issuesin his article titled"The Design of Man-Machine Decision Systems: An Application to PortfolioManagement".His systemwas designed to support investment managersin their dailyadministration of a clients'stock portfolio. JohnD.C. Little, alsoat MassachusettsInstituteof Technology, was studying DSS for marketing. LITTLE and LODISH (1969) reportedresearchon MEDIAC, a mediaplanning support system. Also, LITTLE (1970) identifiedcriteria for designing modelsand systemsto support managementdecision-making. Hisfour criteria included: robustness,easeof control,simplicity, andcompleteness of relevantdetail.All four criteriaremainrelevantin evaluating modernDecisionSupportSystems.By1975, Littl e wasexpanding the frontiersof computer-supportedmodeling. His DSScalledBrandaid (LITTLE 1975) was designed to support product, promotion, pricing andadvertisingdecisions.In 1974, Gordon DAVIS, a Professor at the University of Minnesota, published hisinfluential text on Management Information Systems. He defined a ManagementInformation Systemas "an integrated,man/machine system for providing information tosupport the operations, management, and decision-making functions in an organization". Davis's Chapter 12 was titled "Information System Support for Decision Making" andChapter 13 was titled "Information SystemSupport for Planningand Control". Davis’sframeworkincorporatedcomputerizeddecision supportsystems into the emergingfield ofmanagementinformation systems.
59
In 1995,KLEIN andMETHLIE notedthat“a study of theorigin of DSShasstill to bewritten.It seems that thefirst DSSpapers werepublishedby PhDstudentsor professors in businessschools, who had accessto the first time-sharing computer system: Project MAC at theSloan School, the DartmouthTime SharingSystems at the Tuck School.In France,HECwasthe first Frenchbusinessschoolto have a time-sharingsystem(installedin 1967), andthe first DSSpaperswerepublishedby professorsof theSchoolin 1970”. 1.3.6.2. Definitions
Definitions of decisionsupportsystemsrangefrom: “interactive computer basedsystemsthat decision makersutilize dataandmodelsto solveunstructuredproblems”(GORRY andMORTON, 1971) to “Any system that makes some contribution to decision making”(SPRAGUE and WATSON, 1986). MALCZEWSKI (1997) statesthat SDSS is an interactive,computer-basedsystemdesignedto supporta user or group of usersin achieving a highereffectivenessof decisionmakingwhile solving asemi-structuredspatial decisionproblem.A decision is a choice betweenalternatives. The alternatives may representdiff erentoptionsof action basedon differenthypothesesamongwhich a choice is desirable basedonsomecriteria.A criterion is somebasisfor adecision thatcan be measured andevaluated. Itis the evidence upon which a decisionis based. Criteria canbe of two kinds: constraints,that excludeany kind of action and factors that act in favour of a specific decision. Adecisionis basedon a set of rules by which criteria are combinedto arrive at particulardecision(SPRAGUE 1980; SPRAGUE and CARLSON 1982). Decisionrules are structuredinthe context of a specificobjective,for example, to determine which area is suitable for agivenactivity. To meeta specificobjectiveit is frequently thecasethat several criteria willneedto beevaluated(Multi -CriteriaEvaluation).The decision support field is the “development of approaches for applying informationsystemstechnology to increasetheeffectivenessof decision makers in situationswherethecomputer cansupport andenhancehuman judgement in theperformanceof tasks thathaveelementswhich cannot bespecifiedin advance” (SOL 1983).Decisionsupport systemsmust provide integration of informationand feedbackloops tosupport investigationin the quest for scientific discovery. The intangible factors in thedecisionmakingprocessmay be accounted for through information supplied and choicesmadeby a decision-maker who operatesthe SDSS interactively or through an analyst(LEVINE and POMEROL 2005).The above suggestthat spatial decisionsupport systemsmay be developedas general-purposetools for decision-making(GOODCHILD and DENSHAM 1990).Thespatial decisionsupport systems have been extensively and adequately covered in the literature(GOODCHILD and DENSHAM 1990; CRAIG andDAVID 1991; DENSHAM 1991; MOON 1992;NCGIA 1992). According to DENSHAM (1991) and GEOFFRION (1983),DecisionSupportSystemshassix characteristics:− Explicit designto solveproblems;
60
− Powerful andeasy-to-handleuserinterface;− Ability to flexibly combineanalytical modelswith data;− Ability to explorethespaceanalysissolution by building alternatives;− Capabilityof supportingavariety of decision-makingstyles;and− Allowing interactiveandrecursiveproblemsolving.Thedistinguishing capabilitiesandfunctionsof spatial DecisionSupport Systemsare to:− Providemechanismsfor theinputof spatial data− Allow representationof thespatial relations andstructures− Includetheanalyticaltechniquesof spatial and geographical analysis− Provideoutputin avarietyof spatialforms, includingmapsNotwithstanding, in the specialisedliterature (HOLSAPPLE and WHINSTON 1996) DSS ismainly viewedasa mathematicaltechniqueor a set of techniques for decision makingbyoptimising something under some specific constraints, we consider SDSS in its broadmeaningasaninformationsystemthatcan beusedto support decisionsat spatiallevel. BySDSSwe meanthe integrationof all themethodsand tools thatcan beuseful to build up adecisionsupport systemfor spatially related problems. The system needsthe followingcomponents:GIS, Data analysis and Image processing, modelling and Expert systems,Simulation and Optimisation, Multi-Criteria Decision Analysis and a suitable UserInterface (FEDRA andFEOLI 1998)The ultimate objective of a computerbasedspatial decision supportsystemfor integratedecosystem management is, or should be, to improve planning and decision makingprocesses by providing useful and scientifically sound information to the actorsinvolved in these processes, including public officials, planners and scientists, and thegeneral public.
SDSScomponents:A Geographic Information System (GIS) is designed as a computertool to effic ientlycapture, store, update, manipulate, analyse, and display all forms of geographicallyreferenced information (e.g., ESRI). A GIS typically links data from differentsets, usinggeo-referencing,for example, spatialcoordinates, asacommonkeybetweenthedataset.DataAnalysis and Imageprocessing: the maps obtained by GIS may be seennot only ascartographic representationsof a classification of the landscapeat the endof an analyticalprocess,but mainly asdatasources for the landscape spatial patternanalysisthrough themany different indices of the landscapestructure such as shape, fragmentation, fractal,diversity, etc. (EBDON 1977; TURNER 1989; MILNE 1991; GARDNER and O'NEILL 1991;FABBRI 1991; BAKER and YUNMING 1992; CULLINAM and THOMAS 1992; GUSTAFSONandPARKER 1992; OLSEN et al. 1993). Many GIS have internal data analysis and imageprocessing systemsthat cancalculatedifferent pattern indices. SomeGIS such asIDRISI,ILWIS, GRASS(seeMALCZEWSKI (1999) for a comparisonbetweendifferent GIS) havethe possibility to treat remotesensingdata(Imageprocessing) coming from LANDSAT,
61
SPOT, NOAA, etc. however there aren’t GIS including data analytical and statisticaltechniquesthatareableto classifyspecificOperational GeographicUnits (OGU) accordingCROVELLO (1981). The classification may be obtained by applying the clusteringalgorithms(ORLÓCI 1978; LEGENDRE and LEGENDRE 1983; GOODALL andFEOLI 1988) orother multivariate techniques. FEOLI and ZUCCARELLO (1996) treat this aspect. GIS canmanagedifferentOGUsto obtainmaps.Modelling and expert systems: in GIS, the basic conceptis one of location, of spatialdistribution and relationship; basic elements are spatial objects. In environmentalmodelling, by contrast,the basicconcept is one of state, expressed in terms of numbers,mass,or energy, of interaction and dynamics; the basic elements may be biological,chemical, andenvironmentalmediasuchasair, water or soil.In a Multi-Criteria Evaluation(MCE), an attemptis madeto combinea set of criteria toachievea singlecompositebasisfor a decisionaccordingto a specific objective (EASTMAN
et al. 1995). Decisionsabout the allocation of land typically involve the evaluation ofmultiple criteria accordingto several,often conflicting-objectives (EASTMAN et al. 1995).Making-decisionsaboutthe allocation of land is oneof the most fundamental activities ofresourcedevelopment(UNESCO 1993). With the developmentof GIS, we now have theopportunity, for amoreexplicitly reasonedprocessof land-useevaluation(TUČEK 1994).Theadvantageof MCE is that it providesa flexible way of dealing with qualitativemulti-dimensionalenvironmentaleffectsof decisions (MUNDA 1995).Although a varietyof techniquesexist for the development of weights for the criteria, oneof the most promisingwould appear to be that of PAIRWISE comparisonsdeveloped bySAATY (1980) in the context of a decision making process known as the AnalyticalHierarchy Process(AHP). In the PAIRWISE comparison method the decision-maker isasked to give therelativeimportanceto thecriteriaby comparingthemtwo by two.Multi -Objective Evaluation(MOE): while many decisionswe make are prompted by asingle objective, it also happensthat we need to make decisions that satisfy severalobjectives. A Multi -Objectiveproblem is encountered whenever we have two candidatesets(i.e., setsof entries)that sharemembers.Theseobjectives may be complementary orconflicting in nature(CARVER 1991). In caseof complementaryobjectives, multi-objectivedecisions can often be solved through a hierarchical extension of the multi-criteriaevaluation process. For example,we might assign a weight to each of the objectivesandusethesealongwith thesuitabilitymaps(seefigure1.3.6.2) developedfor each to combinethem into a single suitability map indicating the degree to which areas meet all of theobjectivesconsidered(VOOGD 1983; KRČ 2006).
62
Figure1.3.6.2: Example on how suitability files are derived by KRČ (2006) in his modelselectingthe most suitableskidding mean. It is based on a weighted linearcombinationof factorsandasquarereciprocalmatrix of pairwisecomparisonbetween thecriteria.
However, with conflicting objectivesthe procedure is more involved. With conflictingobjectives, it is sometimespossible to rank order to objectives and reach a prioritisedsolution (ROSENTHAL 1985). In thesecases,the needsof higher ranked objectives aresatisfied beforethoseof lower rankedobjectivesare dealt with. However, this is often notpossible,andthe mostcommonsolution to conflicting objectives is the development of acompromisesolution. Undoubtedlythemost commonlyemployed techniquesfor resolvingconflicting objectives are those involving optimisation of a choice function such asmathematicalprogramming(FEIERING 1986) or goal programming(Ignizio 1985). In both,the concernis to developanallocationof theland that maximisesor minimises anobjectivefunction subject to aseriesof constraints.
63
1.3.6.3. Principles of SDSS
TheDDM paradigm: the technologyfor a DSSmustconsist of threesets of capabilities inthe areas of dialog, data, and modeling (the DDM paradigm) (SPRAGUE and WATSON,1996).A well-design SDSSshouldhavebalanceamong thethreecapabilit ies.Thecomponentsof SDSSarethree:
- the Data Base Management System(DBMS) which contains the functionsto manage thegeographic data base;
- the Model Base Management System(MBMS) which containsthe functionsto manage themodel base;
- the Dialog Generation and Manage-ment System (DGMS) which managesthe interface betweenthe userand therestof thesystem.
Figure1.3.6.3:thecomponentsof SDSS
There are different technologies for developing SDSS (CROSSLAND et al. 1995;MALCZEWSKI 1997):- DSS tools facilitate the developmentof either a DSS generator or a specific DSS;
examplesinclude:o procedural programminglanguagesand codelibraries (e.g., Arc Macro Language
- DSS generator is a packageof relatedhardware and software which providesa set ofcapabilitiesto quickly andeasilybuild aspecific SDSS;examplesinclude:o GISystems(e.g.ARC/INFO, ArcView, ARCNetwork, SpatialAnalyst, MapObjects
- Specific DSS aresystemsdevotedto theanalysisof a particular set of decision problems;the systemswhich actually support the decision makers in tackling semi-structuredproblems;examplesinclude:o Active ResponseGeographicInformation System;o IDRISI DecisionSupport;o GeoMed;o Spatial GroupChoice;o winR+GIS Spatial DecisionSupport.
Planning forest harvesting systems is a complex undertaking. Many factors must beconsidered: thephysical characteristicsof theterrain, theforeststand, the climate, theforestmanagementandsylvicultural plans,theproduct,labor, logging equipmentandthemethodof measuringproduction (FAO 1977). Al l the factors havebeen studied according to thetypical mountainousalpineItalian forestand consideredwhile building a Spatial DecisionSupport Model (SDSS)for planningforest operations.The modelwas conceived as a GIStool, working on GIS ArcMapsoftware,and user friendly as much as possible to be sharedwith other researchers.Consequently to its building phase, a validation and a sensitivityanalysis were carried on to verify results. The model, called Forest Operations Planning(FOpP),would beusefulnot only at theassessmentstage, but also when analyzing the roadnetworkand its influenceon logging costs(for example whenevaluating a new forestroadproject).
68
69
3. METHODS
3.1. TERRAIN EVALUATI ON AND GRADEABILITY
Systematic terrain classificationfor forestrywasoriginall y startedafter World War II in theNordic countries,particularly in Norway (AA.VV. 1961; ANDERSON 1985; BONASSO
1989). During the last two decades numerous proposal for characterization andclassification of forest land havebeensubmitted.In several countries (Norway, Sweden,UnitedKingdom,NorthernItaly) terrainclassification hasalready been in usefor scientificandpractical purposesfor years(LÖFFLER 1984). For more thana decadeFAO, the JointCommittee and IUFRO have beenattempting to unify or make comparable at least thevariousapproaches,so far, however,without success.After preparatory work by ROWAN
(1977) the Joint Committeestartedanother attempt in 1978. In accordancewith IUFRO agroup of experts,composedof members from Canada, the United Kingdom, the FederalRepublic of Germany,Finland, Yugoslavia, Norway, the Soviet Union, Sweden and theUnited States of America, was formed and commissioned to elaborate a proposal for aterrain classification systemfor forestry. Thereport(LÖFFLER1984)is the resultsof severalconsultationsandwrittencontributions.
3.1.1 Terrain classification for forestry – definition and purposes
Thetechnicalpossibilitiesarelimited andthecost of forest operationsareinfluencedby theaccessibility of forest land. Due to this relation the kind and intensity of the managementand treatment of forestsalso dependupon accessibil ity. In this context forest operationsinclude all operational field activities necessary to establishor re-establish, to tend, toprotect, to openup and to harvestforests. As pointed out by SAMSET (1971 and 1975)accessibility isa functionof:
Transport conditionsor infrastructuremeans the connection of a forestareawith the publictransportnetwork aswell as the internalopening up of a forestareaby means of transportlines, mainly by roads. Terrain classification (for forestry) is understood as thecharacterization and grouping of forest land according to the accessibility or, in otherwords,according to thedegreeof difficulty andto thepossibilities and limitations of forestoperations.In some cases terrain classification is seenin a narrower senseand restrictedmerely to the characterizationof the terrain conditions, i.e. without considering theinfrastructural situation.For numerouspurposesterrainclassification is a necessary or at least a useful instrument inthe scienceand practice of forestry.Following the example of a similar list of the BritishForestry Commission (ANONYMOUS 1975), three groups of application with differentrequirements asto the sizeof the areasto be characterized andto the minutenessof detailof description andclassificationcanbedistinguished:
70
- Long-term management planning, referring to areasof medium (managementunit,forestenterprise)or largesize(region,province,country) taking only the permanentand “average” or “normal” terrain conditions into consideration and with low tomedium requirementswith regardto theaccuracyanddetail of terrain description.
- Medium-term operationalplanning, referringmainly to areasof medium size andwithmedium requirementsasto accuracyandintensity of terrain characterization.
- Short-term operational planning, working site assessment and follow-up, dealingwith the planning and control of activities to be carried out in the near future oralready executed,relatedto small areas(individual and identifiable working sites),with medium to high requirementsas to accuracy and detail (figure 3.1.4.c and3.1.4.d)andwith thenecessityto considertheup-to-date terrain conditions.
Theimportanceof auniformor at leastcomparableterrain description and classificationforexchangeof knowledge and experienceon an international level may be pointed out inparticular. Information on performanceand cost of equipment and operational activitiescannotbe interpretedand transformedto other situations unless the conditionson whichthey have beenobtainedarementioned(BEKKER 1969; BERG 1992). So far manyvaluabledata cannot be utilized elsewhere,since information on the terrain and infrastructuralconditionsaremissingor notcomparable.
Typesof terrain classificationsystemsThe scientific findings andpracticalexperienceindicate clearly that one hasto distinguishbetween:- adescriptiveor primaryterrainclassification system, and- functionalor secondaryterrainclassification systems.A descriptive or primary terrain classificationsystem describesand classifies forest landaccordingto the terrain featuresinfluencing the degree of difficulty of forest operations.Functionalor secondaryterrainclassification systems describe andclassify forestland withregardto thepossibilities andlimitationsof operationalmethods and technicalequipment.A functional terrain classification refers always to a defined operation or equipment.Typical and commonlyusedfunctional terrain classification systems are for example thegroupingof forestlandaccordingto thetrafficability for off-roadvehicles like tractorsandskidders,or according to theworkability of thesoil andtheapplicabilityof soil preparationand planting equipment respectively. For functional classification systems the verydifferent regionalandlocal conditionsandneedshaveto be considered. Besides,with thedevelopmentof technical equipmentandworking methods functionalsystemsbecome outof date, and new techniquesrequire the adjustment and modification of functionalclassification. A descriptive terrain classification system must provide the possibility tocharacterizeand classifythe terrainwith different intensity andconsequently with varyingdegreesof generalization. In orderto guaranteethis flexibilit y, it is recommendedthat twoclassification levelsshouldbeenvisaged(IUFRO 1967; SAMSET 1971):
71
- a macro descriptionof terrainor regional terrain classifi cation or classification on thereconnaissanceor upper level,and
- a micro descriptionof terrainor local terrain classificationor terrain classification onthelower level,
eachof themto beappliedseparately or combinedand each of themto beworkedout withvarying degreesof intensity.Terrainparametersarepropertiesof the terrain whichdeterminethedegreeof difficulty andthe possibilit y and limits of forest operations and are used for characterization andclassification of the terrain.In relationto temporal variability the terrain parameters canbedifferentiatedasfollows:
- permanentor invariablefeatures- featuressubjectto seasonalvariations(affectedby weatherconditions)- features subject to medium- to long-term changes(decay of stumps and logging
residues,constructionof newroads)It dependsupon thepurposeof theclassification, which stateof thevariablefeatureshastobe considered. As a rule for medium- to long-term planning purposes the “average” or“normal” state of featuressubject to seasonal variations should be taken as a basis.“Average” or “normal” conditionsmean:normalmoistureconditions in summerand frost-or snow-free ground. In the case of short-term operational planning, working siteassessmentand follow-up the variablefeaturesmust be considered, if at all, in the stateatthe time theoperationwill becarriedout. An entirepicture of theoperational conditions inanarea(accessibility) requires,in addition,information on theinfrastructural situation.The underlined terrain parametersin table 3.1.1.a have been considered as factorsinfluencing the choiceof the skidding system inside the model. All othersmay be alsoincludedbut they aresometimesredundant or their importanceis lessthenthediff iculty tofind data about.On thenextpages,terrain parametersused insidethemodelwill bedeeplyexplained.
3.1.2 Terrain parameters
Macro description and Classification of terrain
Climatic conditionsThefactorclimateis to bedescribedby thefollowingobligatory features:climaticzone,distinguishingarctic,sub-arctic, temperate,sub-tropicaland tropicalclimatic type(maritime or continental)For more detailed characterizationoptional features may be used: mean annualprecipitation, meanannualtemperature,numberof daysper yearwith frost andsnow cover.Thesedataareusuallygivenby regionalenvironmentalagencies(e.g.ARPAV) for freeorpaying a small fee. If possible it would be better to use specific dataof meteo-station neartheplaceof planning.
72
Table 3.1.1.a:terrainparameterson macro and micro classification level. The underlinedfactorsare includedin themodelfunctioning.Upper classification level Micro classification level
Geology and ground conditionsFor reasonsof operational orientedterrain classification information about the geologicalsituation(parentor geneticmaterialandmodeof formationof thesoil material) is valuable,but of lessimportance,however,ascompared to the factorsmacro-topography, climate andgroundconditions. If the geologicalsituation is described this should bedone according tothe following rules:-asto theparent(genetic)materialthecustomary terms might beused-as to the mode of formationof the soil material the following terminology, proposed byCanadianResource AnalysisBranch(GOLOB 1978;TSAY 1979;MELLGREN 1980b),canbeapplied:
73
A Anthropogenic O OrganicC Colluvial R BedrockE Eolian SSaproliteF Fluvial V VolcanicI Ice W MarineL Lacustrine U Undifferentiated
Within the scope of macro descriptionthe terrain factor “prevailing soil class” is to betypifiedby oneof thefollowing four soil classes:1 coarse-texturedsoils (gravelandcoarsesand,sand,loamysand)2 medium-textured soils (sandy loam, fine sandy loam, very fine sandy loam, silt
loam,loam,clay loam,silty clay loam)3 fine-texturedsoils (silt, sandy clay, silt y clay, clay)4 organicsoils (contentof organicsmorethan 30%)In thecasewhere otherclassesthanthepredominantoneoccur on a noticeable percentageof thearea(more than10%),this shouldbenoted.
Micro descriptionandClassificationof terrainTheclassificationon thelower (or micro) level is intended to serve thefollowing purposes:- to characterize smallerareaswhich asa rule aredelineated on the map and in the fieldrespectively andconsequentlyareidentifiable,- to give a statistical breakdownon the terrain conditions (terrain classes) of large areas,based on theclassificationof sampleplotsusingthe rulesof micro classification.While terrainclassificationon the upper or reconnaissancelevel in formal and taxonomicrespect (macro description) is a moreverbal description, it is recommended, in principle,touseterrain condition classesat thelevel of micro classification(LÖFFLER 1984).
Soil strength classFirst of all, trafficability of soils,which is the capacity of the groundto support vehicularoff-roadmovementor the interactionof vehicle andsoil, and the workability of soils, whichmeansthe interactionof soil working tools and the soil, should be recorded.Finally, aclassification of ground conditions should provide information concerning the mainbehaviorof soils from thecivil engineeringpoint of view (constructionof forest roads)andthe sensitivity of soils to compaction and erosion as far as influenced by and dependingupon soil conditions. Thesesoil or ground properties are first of all a function of soilstrength and consequentlysoil strength should be used as main criterion for thecharacterization and classificationof ground conditions within the scope of a descriptiveterrain classification system.However, to classify forest soils according to soil strengthcausesconsiderabledifficulti es:- evenamongst the expertsdivergingopinions exist asto which method should beusedtomeasure soil strength andhow it shouldbe expressednumerically (CBR-value, coneindex,modulus of elasticity as received by the plate bearing test, parametric methods likebevameter,etc…)
74
- until now litt le wasknownaboutthestrengthof forestsoilsAgreement hasbeenreachedat leastto thepoint where soil strength,asit is understoodinthatconnection, is correlatedwith thefollowingphysical propertiesof a soil:
Thesoil drainageclassesreferto thefrequencyandduration of periodswhenthesoil is freeof saturation or partial saturation. The classes indicate the combined influence ofprecipitation, runoff andponding,soil permeability and internal soil drainage. The classesare used extensively in pedology and soil surveying as a means of characterizingtheseasonal soil moisturevariations(AA.VV. 1975). The definitions of the drainageclassesareasfollows:- Excessively drained – wateris removed from thesoil very rapidly, commonly due to very
poroussoil or a combinationof poroussoil and slopeand steepslope.Soils are freeofgley mottlesindicativeof wetness,andareseldom saturated
- Well drained – water is removed from the soil readily, but not rapidly. Porosity issufficiently rapid and/orinfiltration suffi ciently slow to preventsaturation except for afewbrief periodsfollowing theheaviestrainfalls. Soil is freeof gley(gray) mottles.
- Moderately well drained – wateris removedfrom thesoil somewhat slowly, in mostsoilsof this typebecauseof a slowly permeable layer deep in the soil, a high water table,oradditions of water throughseepage.Soil has gley mottles deepin the profile, usuallybetween 1.5 and 2.5m, andis saturatedfor shortperiods.
- Imperfectly drained – water is removedfrom the soil slowly enough to keep it saturatedfor significant periods,but lessthanhalf the time in the average year.Gley mottlesarepresentin theupper1.5 m of thesoil.
75
- Poorly drained – water is removed so slowly that the soil remainssaturated for a largepart of thetime.Gley colorsaredominant in theupper 1.5m of thesoil.
- Very poorly drained – water is removed from the soil so slowly that the water tableremainsat or near the surfacethe greater part of the time. Areasof these soils arefrequentlyponded. Gleycolorsdominate.
If it is impossiblehereto go into detailsof soil physics andsoil mechanics. Thebasic soilstrength classificationmaybeusedflexibly in the following way:- thefive mainstrengthclassescanbefurthersub-dividedby formingsub-classes- theclassificationaccordingto therulesof soil strengthconditions maybevaried- soil drainageclassifi cationshouldbederived from thedescriptive classificationThe information necessaryto assessthe ground conditions can be obtained by ad hocinvestigations of soil samples, but here were derived from already existing soilclassificationsdevelopedfor otherpurposes(soil stability) .
GroundroughnessGround roughnessis determinedby the size (height) and incidence of obstacles(Samset1975; Mellgren1980). Thetermobstaclerefers to:
- depressions that havehardedgesandarewell defined. Relative to ground level, adepression must be at least0.2 m. Depressionswith an average diameter greaterthansix timesthedeptharenot included,unlesstheedges areverysharp.
- Stones, bouldersandground obstructionsat least0.1 m high. The following rulesareappliedto accumulationsof stonesandrocks.
• RULE 1: a stone,whosecentreis closerto thatof anadjacent, larger stone than theheightof the largerstone,is not counted
Figure 3.1.2.a: on the left side, the stone in “shadow” of larger stone is notcounted;on the right side,thecentreof thestone(imaginary centre of gravity) isoutsidethe“shadow” of thelargerstone:counted.
• RULE 2: a stone whosecentreis closerto the circumferenceof an adjacent, largerstone than twice its ownheight, andwhose height is lessthan a quarterof thatof thelargerstone,is not counted.
76
Figure3.1.2.b:on the left: thecenterof this smaller stoneis closerthan twice itsheight to the circumferenceof thelargerstone,not counted.On theright side, theheight of the smaller stoneis more than a quarter of that of the larger stone,counted.
The height of an obstacleis determinedby taking the mean value of two measurements(ROWAN 1977;LÖFFLER 1984):
Stumpsand logging residues,which will bedegradedin time, are not counted asobstaclesin thecontext of adescriptiveterrainclassification.Obstaclesareclassifiedasfollows:1) by height:
All surfaceswith ground roughnessmore difficult than that ofclass4
5 Veryrough
Figure 3.1.2.c: example of terrain roughness on the Italian North-eastern alpine studyarea.On theleft sideasmoothterrainandon theright averyrough surface.
Inside themodel, a simplified version of ground roughnessclassification (table3.1.2.b) wasusedaccordingto HIPPOLITI and PIEGAI (2000). Table 3.1.2.b: ground roughnessasconsideredby the modelSurfaceoccupied(%) Obstacledimension (m) Max distance (m) Class
If notdefined If not defined If not defined 0 -< 33 < 0.5 > 2.5 1 Smooth
Slope conditionsSlopeconditionsarecharacterized by:gradient(inclination) asmainandobligatoryparametershapeor typepf slopeandlengthof slopeasoptional factorsThe gradient is given asa percentageor in degrees. It should be measured (assessed) overhorizontaldistancesof approximately25 m in the direction of themaximuminclination,i.e.perpendicularto contours.Slopeclassesmaybedeterminedfromthegradientvaluesrecorded asin table3.1.2.c.
For smaller areaswith more or less uniform relief, specific terms may be used (fi gure3.1.2.d)(SAMSET 1971).In the caseof larger areaswith irregular relief, for examplewith a heterogeneous slopepattern,the characterizationusedin the Norwegian terrain classification (KIELLAND-LUND
Figure3.1.2.d: relief description Figure 3.1.2.e: large areas irregular reliefdescription. 1) Uniform hillsides, 2)Basinshapedhill sides, 3) Close valleys, 4)Coneshapedhillsides,5) Plateaux
79
Theslopelength is classifiedaccordingto:- the uninterrupted length, i.e. theoverall length of a slopefrom thebottom to the top
or to a forest(truck) road,regardlessof terraces,ditches,etc…- the interrupted length, i.e. the most frequent length of regular stretchesof slope
betweenterraces,ditches,etc…, occurringwithin theoverall length.This interruptedlength is usuallyregardedasamarginalclass.
Thelength of aslopemaybeclassifiedaccording to thefollowing scaleClass1 25– 100mClass2 100– 200 mClass3 200– 300 mClass4 300– 700 mClass5 > 700m
Off-road distance classOn the level of micro classificationtheinfrastructural conditions maybecharacterized bestby themeanoff-road transportation(skidding,extraction) distance, which is definedastheaverage distancebetweenstum-site and the next forest (truck) road or storageplace forfurther transportation. The rangeof the off-road transportation distance is grouped intoclassesasfollows:Class1 < 100mClass2 100– 250 mClass3 250– 500 mClass4 500– 1000mClass5 > 1000mFor a very exact description, as on the occasion of scientific studies (machinesproductiviti es), it might be recommendable to report the concrete value. The mean(realistic) off -roadtransportationdistancecanbeachieved in two ways:- by direct measurementon the topographical map according to the point-grid methodsuggested by SEGEBADEN et al. (1964)- by an indirect way with the help of road density (RD in m/ha) and road spacingrespectively and road network factor (f) appropriate to the area under consideration. Themeanoff-roadtransportationdistance(TD) is then:TD = (f · 250) / RD [m]
3.1.3 Gradeability
The completeterraindescriptionand classification of an area(a site, a sampleplot, etc..)under operational aspectsis representedby the terrain condition or accessibilityclass.Tothis, the classes(and additional information) of the single features are combined in thefollowing sequence and importance: ground conditions, ground roughness, slopeconditions, infrastructureand snow conditions. As an example, the terrain description on
80
the micro level might be representedby a number sequence(table 3.1.3.a and figure3.1.3.a):2.3.3.4where 2 meansstrongsoil
Figure 3.1.3.a: on the left a long-term activity planning, on the right a detailedoperational planning. Reference to terrain strength, ground roughness and gradients(LÖFFLER 1984)
To evaluate performancecharacteristicsof off-road vehicles, different criteria wereproposed such as drawbar performance, transport productivity and maximum feasibleoperating speed(WONG 1993). Mobility is a multidimensional concept which considersvehicle performancein relation to terrain stability, obstacle and slope negotiation, watercrossing,andride quality (WONG 1993).To evaluateperformanceof carriers on slopes,ananalysis of relationships between vehicle parameters, slope negotiation, and terrainproperties is of primary importance(BONASSO 1989; HEINIMA NN 1999). Terramechanicsoffers three basic approachesto this analysis: (1) empirical, (2) analytical, and (3)numerical (computeraided,seeWONG 1994). Analytical andnumericalmodelsarebasedon the plasticequilibrium theory andrequirea parametric description of the soil’s plasticbehaviour. In keeping with the work of BEKKER (1956 and 1969) usually five soil
81
parameters must be determined.This limits covering the variability of soil properties inspace andtime.Therefore empirical approachesbasedon characterizing soil propertiesby the Cone Index(CI) aremoresuitableandwereusedfor thecurrent analysis. Following engineering designequilibrium principles, single wheel and single track conditions may be formulated,respectively, asshownbelow:For powereduphill motion,
[ ] Ftowaccslopethrustr
FFFR γγ
⋅++=⋅1
[1]
for brakeddownhill motion,
( )[ ] Ftowaccslopethrustr
FFFR γγ
⋅−−=⋅1
[2]
and for powereddownhill motion
[ ] Ftowaccslopethrustr
FFFR γγ
⋅++−=⋅1
[3]
where Rthrust= Thrustresistanceof thesoilFslope = Slopeaction(driving effect of gravityon an inclinedplane)Facc= Accelerationaction(a·mass)(a> 0 acceleration, a< 0 deceleration)Ftow = Soil action against moving of a wheel/track(towing)γr = ResistancefactorγF = Action factor
Downhill motion requirestwo equilibrium conditions [1] and [2] considering that thetowing action Ftow can become greater than the sum of the slope action Fslope and thedecelerationactionFacc.Gradeability wasanalyzed to evaluateperformanceof carrierplatforms basedon theworkof BRIXIUS (1987) for wheeled, and HALEY et al. (1979), for tracked vehicles. Figure3.1.3.b presents the relationships betweengradeabili ty, soil properties and wheel/trackcharacteristics.
82
Figure 3.1.3.b: gradeability for tracked and wheeled carriers as a function of soilproperties(ConeIndex).
The underlying vehicle parametersare typical for the IMPEX “Bengal Tiger„ trackedharvester, theFMG Timberjack1270Bwheeledharvester (600/55-26.5tires),andthe FMG1710 clambunkskidder (800/40-26.5 tires). The derived gradeability curves agree quitewell with figures of WONG (1993). In most textbooks on forest operations, limits ofmobility areprovidedin termsof maximumnegotiable slopegradient.Results in figure 3.1.3.b show that slope gradient alone is not an adequate criterion. Soilbearing capacitymust be taken into consideration, especially on soft ground conditions(WRONSKI et al. 1989; HEINIMANN 1999, EICHRODT 2003). Wheeled carrier harvestingsystems shouldbe applied only to soil with bearingcapacities greaterthan850 kPa CI (=4.6% CBR). Wheeledharvestersmayoperateon slopesup to 35-45%. Wheeledextractionis limited to uphill gradeabilityof about45-50%, which agreeswith recommendationsofLAMBERT and HOWARD (1990).Downhill transport may takeplaceon slopeswith gradesup to 50%,but is strictly limited to terrainwith goodbearingcapacity. On very soft groundconditions, soil with bearingcapacitiesof 400 kPa CI (= 1.6 % CBR) to 700 kPa CI (=3.3% CBR) which may be encountered on the northern slopes of the Alps, trackedharvesters should be used, whereas extraction should be done by cable systems or byhelicopters.The advantage of tracked versuswheeledcarriers is quite clear. However,applicability of theknown vehicleconfigurations is limitedto about a60%slope.
The practice of forestryis more interested in functional terrainclassification systems thanin descriptive ones (PUTKISTO 1964; HAARLAA and ASSERSTAHL 1972). However, noconsensuscan be internationallyachievedabout functional terrain classification systems;
83
functionalterrain classificationsystemscanonly be developed underconsideration of thelocal and regional circumstances,and finally that functional terrain classification willgenerally only beappropriatefor shorterperiods.The following examples(§ 3.1.4) merely demonstrate in which way functional terrainclassificationsystemscanbederivedfromadescriptive terrain classifi cation. Thestepfromthe descriptive to a functionalclassification calls for anevaluation of thedescriptive terrainclasseswith regard to the function in question. So for instancethe relationshipsbetweenterrain conditions and technical properties of the machinesmust be investigated anddefined,or thosebetweenterrainconditions and the sensitivity to soil movement(OLSEN
and WÄSTERLUND 1989; WRONSKI et al. 1989; ZIESAK 2003). This can be done on thebasisof experiences aswell asof purposeful experimentsand studies.
3.1.4 Matching systems to the area – reference examples
Severalauthorsstudied a functional classification of soils andtheybuilt their own matricesto matchsystemsto each terraincategory.They also draw simpleplanningmaps showingtechnical working areasfor forest utilizations, but at that time they had no powerfulsoftwares like ArcGIS andthe work wasmadeby handandneededa lot of observations.Themostinterestingexamples,very nearto the Forest OperationsPlanningpresentedhereare thoseof ROWAN (1977) in table 3.1.4.aand figure3.1.4.a,3.1.4.b, 3.1.4.c and 3.1.4.d,MELLGREN (1980) shown on figure 3.1.4.e, LÜTHY (1998), figure 3.1.4.f and 3.1.4.gandSpinelli andothers(FORESTSERVICE 2000;AA. VV. 2002),table3.1.4.b.
Table 3.1.4.a:probableterrain limits of forestmachines.This table is the only onewhichconsiderdifferentparametersaccording to theextraction direction.
Worst terrain class on whichmachinecanbeexpectedto operate
Figure 3.1.4.a:long-term planning, descriptive map.This maprecords terrain datain afairly “broad-brush”manner,astheobjectis to provide information on which thechoiceof possibleharvesting systems, and consequent roadplanning, canbebased.So it is notnecessaryto record every patch of differing ground, as these wil l have li ttle or noinfluenceon thefinal result(ROWAN 1977).
85
Figure 3.1.4.b:long-term planning, functionalmap.This is an exampleof the type ofoperational planningmap.It could take the form of an overlay on the descriptivemap(figure 3.1.4.a).Information presentedon such planning mapscould include: the areaswhich are negotiable by particular machinesor machine types; theareasto beharvestedby particularharvesting systems.
86
Figure 3.1.4.c:short-term planning and operational control: descriptivemap. Thisrecordsdetailedterraindataon thesiteson which work will bedone within thenext twoyearsor so.Areasof the foreston which no work is proposedin thenearfuturearenotsurveyed,and there is no attemptto obtain complete coverage of the forest initially.Information on sites on which work will be donein lateryearscanbe collected nearerthe time it is required, and sothereis abuild-upof lasting value
87
Figure 3.1.4.d: short-term planning and operational control: functional map. Thistype of mapshave a limited “ life”. They can record a rangeof information, usuallyrelating to currentwork, suchas: definingworking areasfor specifiedmachines,perhapsat a particulartimesof theyear; planningextraction routes;defining areaswherecostsorincentive payments can be expectedto change according to terrain features, eitherdirectly or because the terrain imposessomechange in working method.
Figure 3.1.4.f: skiddingsystemsmap.This is one of the first maps createdwith the useof a geographical software as ArcInfo (LÜTHY 1998). The evaluation of systemallocation is doneonaregulargrid and not on a continuesurface.
89
Figure3.1.4.g:costsmap.Theevaluationis donepoint by point startingfromresultsoffigure3.1.4.f.A simpleprogramwasbuilt insideanexcelsheetand run on thebasis ofinput parameterset by theuser(HEINIMA NN 1986; LÜTHY 1998).
90
Table 3.1.4.b: general terrain classification scoring for Ireland (AA.VV. 2002; FOREST
SERVICE 2000)
91
3.2. SKIDDING SYSTEMSAND THEIR LIMI TS
3.2.1 Defining off-road vehicles and aerial systems
The first dimension of BOYD and NOVAK ’s (1977) approach,concept factors,considersmachinefunctions.Ground-basedharvestingconcepts arebasedon carriersthat are capableof moving over natural terrain. Tree felling and processing dependon the functionalabilities of attachment devicesandhandlingfeatures(positioning, reach,liftin g force,etc.).Extraction dependson loadbuilding, attachmentperformance,andcarryingcapacity.In forest to mill transportation, the most costly portion is often from stump to landing(SILVERSIDES 1980).Thereforethesystem chosenfor off-roadtransport is oneof themostcritical aspectsof a tree harvestingsystem.Four principal technologypaths are availablefor facilitating off-road transportation: groundvehiclesmoving on natural terrain, groundvehiclesmovingonskid roads,carriagesmoving on cable structuresandairshipsmoving inthe atmosphere(HEINIMANN 1999). Figure 3.2.1 shows the factors differentiating theseharvesting concepts.
As long as harvesting technology is basedon ground vehicles, they are classified asground-based. Systemcomplexity increases with the effort to ensureoff-roadlocomotion.Ground vehicles may move on a path over natural terrain or, if the terrain conditionsbecome too complex, over geotechnical structures (skid roads). If terrain conditionsbecometoo diffi cult, cable structuresenablethe transport of partially or full suspendedloadsoverlargedistances overcoming variousterrain obstacles.Airship-basedtechnologiesusetheatmosphereasmediafor transport. Althoughat a high operational cost, helicopters
92
havefound a nichein transport for a numberof site-specific situations.Cablesystems andairships may be applied in all terrain conditions. Their use is limited due to economicinefficiency and to environmental disturbance (e.g. lack of energy efficiency inhelicopters).Ground-basedtechnologiesarelimited becauseof the restrictions in off-roadmobility. Therefore,understanding the factorsinfluencingmobilit y is absolutely essential.There are no generalrules for differentiating the basic conceptsof figure 3.2.1. In mosttextbooks and guidelines, rules of thumb are often basedon slope gradient. Recentinvestigationsbasedon life-cycle cost analysis demonstrated that differentiating ground-basedandcable-basedconceptsis unclear(HEINIMANN 1998) andmaybedefinedonly forknownharvesting strategy androad buildingcosts.
3.2.2 Off-road systems
TractorandwinchThe tractor with winch systemis the most spreadinside Italian forestenterprisesbecausetractor is cheap and may be adaptedto the forest use with very few adjustments.Agricultural 4WD tractors are usually modified putting protections to wheels valves,increasing front weight andmountingchains(CAVALLI 1997).Theprincipal factorsinfluencingits operability arethe terrainslopeand roughnessandtheinfrastructuresdensity.The terrain maximumslopeis different according to the skiddingdirection (uphill or downhill) and if moving with or without loads.Moving uphill, themaximumslopeis about10-20%, up to 35% if driving unloaded,with amaximum of 40%on very short road tracks.Moving downhill themaximum slopeis 30%,up to 60% on well maintained roads and short tracks. Both the uphill and downhillextraction is not possibleout of skidtrails androadsif theaverageslopeis morethan 20%(HIPPOLITI and PIEGAI 2000).The terrain roughnessshouldbe very low, the groundsmooth so the roadnetwork is thefactor limiting forest accessibility of tractor when average slope is high. Density oftemporary roads(skidtrails) in this case is also very important (CIV IDINI 1983; FABIANO
2002).The extractiondistances, within which the productivity of tractor is not badly influenced,have to be distinguished if skidding uphill or downhill. When skidding uphill, themaximum distanceis 150 m, the optimal would be 100 m, while skidding downhill themaximum distances are respectively 500 and 300 meters.Tractor with winch is welladapting to manydifferent situations,even on thosecuttings with very low yield, but logsmust be concentrated inside the forest stand in a way that extraction distancesare nothigherthantheallowed ones.Logscanbe of all dimensions,usually 4 to 6 metersbut bigger dimensionswould be alsobetter for optimizing the load(PIEGAI 1990). The average load size is between0.5 to 1.5m3, but maybealso 2 m3 for hugemachines.Productivitiesareinfluencedby manyfactorsas the extractiondistance(figure 3.2.2.a), logs dimensions (figure 3.2.2.b), skidding times,
93
technicalpropertiesanddirection andthe characteristics of skidding path. As an example,daily productivities of a tractor with two operatorsworking is 10-20 m3 inside youngforestswith small diameters(thinnings),15-30 m3 inside forestswith averagedimensionsand 20-40 m3 on final cuttings(HIPPOLITI and PIEGAI 2000;CAVALLI and MENEGUS 2003).Costs are related to working times andproductivities and they arealso influencedby theextraction distance(figure 3.2.2.c) andtheloadsize(figure3.2.2.d).Whenskidding firewood it seemsthat thereis a optimum sizeof piecesbetween15 and 16cm diameter(figure 3.2.2.b)becausethe loading is doneby hand:when thesize is smallerit takeslongertime to fill the firewoodnest (PIEGAI andQUILGHINI 1993),whenchopsarebiggertheyarealsoheavieranddiff icult to li ft or handle.
Tractor with winch productivity (logs)
y = 36,293x-1,1791
R2 = 0,8619
0,00
0,05
0,10
0,15
0,20
0,25
0 100 200 300 400 500 600 700
skidding distance
m3/
ma
day
0,00
1,00
2,00
3,00
4,00
5,00
6,00
7,00
m3/
h
productivity m3/mproductivity m3/h
Figure 3.2.2.a:tractor productivity when skidding logs (DELLAGIACOMA et al. 2002,modified)
Figure 3.2.2.d: firewood skidding costsaccording to averagechopsize.
ForwarderThe forwarderis anarticulate tractorcomposed by two units free to move andsteelon thehorizontal plan. On the fi rst unit are sited the driving cabin and the engine usually verypowerful, up to 170 kW. The secondunit is composedby a trailer and an hydraulic boomwhich commandsare sited inside the cabin (BIDINI 2004). This particular configurationallow easier loading and un-loading operations, decreasing the operator stress andincreasing his safety.The trailer may be adjustable both in length and width dimensionsadapting it to different log lengths andsizesor to stand characteristics like treedensityorsoil bearingcapacity.Italian forest enterprisesare usually small and they have not enough money to buy aforwarderwhich asnewmaycostmorethan250000€. Moreover the yearly wood cuttings are not enoughto cover fixed costsand depreciation in a short period. The use of thismachinewould alsocausea changein the way of the working schemeandlogistic that isquite difficult to realize.Few examplesof peoplebuying forwarder in Italy show thatthis ispossibleonly when the enterprisehas a well organized logistic and scheduled work (asCiech in Trento province), when the machine is bought used from an other country(Sambugarobrothersin Asiago)or when regional fundscover a percentageof the sellingprice (Dalle Ave brothers in Asiago).The useof forwarder at its highest performanceisonly possible after attending a specific courseandafter months of practice (ACKERMAN et
al. 2002; PURFÜRSTandERLER 2006).The first forwarderswere thoughtto work on openspacesandflat terrains in theNorthernEuropesotheydid not fi t inside Alpine forests becauseof their size. During theyearsnewadapted smaller machinesentered the marketand opened to the Italian forest sector. Tillnow its useis still highly connected to thecuttingsand thestandtreedensity.As other off-groundmachines,the forwardertechnical limi ts dependon the terrainslope,roughness and extractiondistance(GARDNER 1966). The uphill extractionis feasible onslopesup to 25-30%,while skidding downhill slopesmayreach40%.This ability is dueto
Distance(m) Averagevolume(m3)
95
the hydraulic transmission which is spreadover all traction wheels and which varycontinuously(thereis no gear)adapting to the terrainconditions. The wheels havea largewidth and a low tire pressure andthey are coupledon a bogie system which limits thesoildamagesandincreasesthegrip evenon muddyconditions(ACKERMAN et al. 2002).Theterrainroughnessis lessinfluencing theforwarder than thetractorbecauseits frameishigher from ground (more than 60 cm) due to the wheelsconfiguration and hydraulicsystem. Moreover, the wheels bogies increaseits agility over obstacleslike rocks andstumps.Foresttruck roads are not required, but the roadnetwork should bequitedensetoallow the machinereaching logs at felling sites inside the forest. The cutting operationsshould take count of the use of forwarder and treesshould be felled and bucked in afavorabledirectionwhich makeeasier theloading phase.The forwardertrailer may load up to 15 tons andthis makeconvenientalso long distanceextraction, but not more than 1 km (figure 3.2.2.e) becausethe productivity decreasesandskidding is not yet cheap(GARDNER 1966; ACKERMAN et al. 2002).Logs can be of anydimension,but they influence productivity andcosts (figure 3.2.2.f and3.2.2.g). The timefor loadingandun-loading small logsis higherandthewoodvolumeis lessthanthatof bigdimensions,so eachtrail may increasecosts up to 40% than the average(KELLOGG andBETTINGER 1994). Usuallytreesarebuckedat 4, 6 or 8 meters,but longerlogsor full treescan beloadedaccording to theloading spaceor usingsomeartifice.The forwarder increasedthe safetyof worker because he is inside a protected cabin, butnew problems are introduced, for example the muscle and skeletal diseasesor thepsychological problems linked to the working stress, due to fast operations, and to asolitary work which brings to social relation problems(ACKERMAN et al. 2002).Thesearewell know problemson countrieswhere theuse of forwarderis now commonandit is morestrongwheretheoperatorsareshiftedon a24h workingday.Referencesstatehigh productivities, from a minimum of 6 m3/h up to 47-50 m3/h andaveragesof 20 m3/h, dependingby assortmentsand extractiondistancesbetween500 and1000m (PULKK I s.d.; ACKERMAN et al. 2002), but first studiesin Italy (figure 3.2.2.g) showa variation between10 and 20 m3/h. Skidding costsare lower than 10 €/m3, but they aredepending on the log size: in fact skiddingbig size logs at far distancesmay be cheaperthanskiddingsmall logsnearroads (figure3.2.2.f).
96
Forwarder productivities
y = 16,14x-0,8126
R2 = 0,966
y = 110,66x-1,1574
0,00
0,10
0,20
0,30
0,40
0,50
0,60
0,70
0,80
0 200 400 600 800 1000
Distance (m)
m3/
ma
day
0,00
5,00
10,00
15,00
20,00
25,00
m3/
h
ITA field data
FIN model
clear cutting
Potenza (ITA field data)
Figure 3.2.2.e:the forwarderproductivity function in Italy andcomparedwith a Finnishproductivity model(EMER 2005)
Cable-forwarderUsually the forwarder begins to work two days after the harvester, drives on the samecorridors, loadsthe logs left on the two sides (likely bunchedaccording to homogenousassortments) and transportsthe load to the landing site. Due to the recurrentpassages atfully loadedconditionson thesametracks, this machine,muchmorethantheharvester,candamagethesoil (compaction,rutting); anyway,negative effectsaremitigatedusing loggingdebris (branches, tree tops) to reinforce the strip roads, which results in a substantialincreasein soil bearing capacity (MCDONALD andSEIXAS 1997). Most recentforwardersare agile, stable andcompactenough to movein the forestwithout specific corridors,afteramotor-manually performedcut.In Italy forwardersareusually matchedwith thefew harvesters,mostly operating in poplarplantations. The alreadyscarceliterature about forwarders (TUFTS and BRINKER 1993a;TUFTS and BRINKER 1993b; KELLOGG and BETTINGER 1994; MCNEEL and RUTHERFORD
concrete limits areunknown.Their usein mountainous areas hasalways beenhold up bythe maximumnegotiable slopegradient,which diffi cultly canbeover40%.In the Austrianliteratureexamplesof cable extractionof harvester-felled thinningsarepresented(VISSER
and STAMPFER 1998;HEINIMANN et al. 1998; STAMPFER and STEINMÜLLER 2004),but thismethodis not so widespreadin everyday’s practice. Exactly in Austria, considering theneed to widen forwarder’s range, has recentlymadeits appearancethe so-called cable-forwarder. If pilot studies were requiring an external winch to pull up the machine(BOMBOSCH et al. 2003), the project has evolved to its actual state, which sees theforwarderableto self-haul up by a winch integratedin the machine;therolling up speedofthe cable is synchronized with the transmission of the vehicle. The winch is mountedbehindthehead boardof the bunk andthe cableexits from the back of the machine;oncethe cableis fixedon ananchor tree or stump, theforwarder canclimb up alongthecorridorcreatedby theharvester,negotiatingslopesup to 70%without evident wheelslippage.Before travelling uphill, the machine needs to have the cable of the winch fixed on ananchor treeor stump at the headof the corridor. The harvesterpull the cable up alongthefirst corridor, in order to sparethe forwarderoperator a very heavy task.The processiseasier for theothercorridors, because,oncecompletedthehaulage, theforwarder canuseaforestride at theheadto move to thebeginning of theadjacent corridor,readyto descenditloading the logs. Unhooking the cable and setting it up againon a new stump is usuallyrequiring just few minutes.Consideringthesteepslope,thecable is always kept in tensionwhile moving on the corridor, but onceon the forest road the operatoris loosening it inorder to freely move on the road (perpendicular to the corridors) and unload the logs(CAVALLI et al. 2006).Extraction distance,as evidencedin Figure 3.2.2.h, exerts a stronger influenceover theproductivity, confirming how a goodforestroaddensity is fundamental to carryout forestexploitation in aproductiveand economicalway.Figure 3.2.2.i revealshow productivity decreaseswith the increasing slope negotiatedbythe cable-forwarder.The gap, anyway, is not so noticeable (no more than 2 m3), henceunderlining the validity of the system: the use of the winch minimizes the effect of theslopeon themovingof themachine.Theaverage productivity formula is shown.Travelling speed(both uphill anddownhill ) remainsalmostconstant, thanksto the uniformpulling forceof thewinch.
98
Figure 3.2.2.h:productivity of thecable-forwarder(m3/PSH15) accordingto averagelogvolumeandextraction distance
Cable-forwarder productivities
y = 82,278x-1,1571
0
0,1
0,2
0,3
0,4
0,5
0,6
0,7
0,8
0,9
1
0 100 200 300 400 500 600
Extraction distance (m)
Pro
du
ctiv
ity
m3/
ma
day
slope 30%
slope 45%
slope 60%
Potenza (slope 45%)
Figure 3.2.2.i: productivity functions according to extraction distanceand averagecorridor slopes.Theformulawasusedinsidethemodel.
The machinehourly cost was estimatedin 71.46 €. The extraction cost per cubic meter(€/m3) derivesfrom the quotient betweenthe machinehourly cost (€/h) and the machineproductivity (m3/h). Figure 3.2.2.j evidences how the extraction cost decreaseswith thegrowing productivity.
Mobile cablesystems– toweryarderThemobile cable systemsareusuallycomposed by somedrums(for the skyline, the mainline andguy-lines) mounted on a compactunit andby a tower usedasspansupport. Thesystemmaybeautonomousif it is provided by anengineandmountedon a wheeledtrailer,or it is carriedandconnectedto thetractor pulling force(BORTOLI andSOLARI 1996).Carriages can be mechanic or semi-automatic. The mobile cable cranesare the simplest,cheapest and rapid to install aerial skidding systems. They usually work with gravityskidding small size logs deriving from thinnings or coppices on short corridors (100-400m). Thelateralskiddingnevergoesfarer than25 m (BORTOLI e SOLARI 1996).To makethesystem economical,the minimum yield should be at least 0.3-0.5 m3 per linear meter(HIPPOLITI andPIEGAI 2000). Theproductivitymayreach5.5m3/h, but consideringalsothemounting and dismounting times it decreaseto 3-3.5 m3/h. Skidding firewood, theproductivity is between2 and 5 tonsperhour beinginfluencedby theaveragesizeof wood(figure 3.2.3.a).The differencebetweenfi rewood and logs extraction is more or less1/3(comparingtons and cubic metersas equal),but after 200 m this becomes lessevident(figure3.2.3.b).Commonlyskylineshavea 14-16mmdiameter,with a breaking loadunder15 kN (about 1.5 tons).Working with gravity force, the minimum slopeshould beat least20%, while the maximum slope is 100% skidding downhill or 120% skidding uphill(BORTOLI andSOLARI 1996; DELLA GIACOMA et al. 2002). The working sitesrequire enough spaceto set up the tower and piling logs, tractor roadsand skidtrailswith goodpavementare sufficient.The forest roaddensity should be40 m/ha
100
consideringan averageskidding distanceof 400 m, but it would bebetter between60 and70 m/ha(BORTOLI andSOLARI 1996).
During time studiesalsolateralskidding distancesweremeasuredandit wasdemonstratedthat the lateral distance has a statistical influenceon total productivi ties (figure 3.2.3.c).Thecorridorwidth is importantwhenplanningcuttingsbecauseit influencesthenumberoflinesrequired.Themountinganddismounting times may be lessthan2 daysfor the towercranes, so it would be better to build one more corridor than skidding with far lateraldistances. When skidding farer than 25 meters, the total productivity decreaseof 60%,moreoverthe forcesand structure stressis higher and workers safetydecrease.Averagecostsarevery low whenskidding within 200 m (over 15 €/t, figure 3.2.3.d), but they can increasedependingon thelogssizeandon thesite characteristics.
Productivities and lateral skidding
R2 = 0.4969
0.00
2.00
4.00
6.00
8.00
10.00
12.00
14.00
16.00
18.00
20.00
0 20 40 60 80
Lateral skidding (m)
Pro
du
ctiv
ity
(t/h
)
Firewood skidding costs
R2 = 0.5086
0
10
20
30
40
50
60
0 50 100 150 200 250 300 350 400
Distance (m)
€C
ost
(/t
)
Figure 3.2.3.c: the relation betweenhourlyproductivityandlateralskiddingdistance.
Figure3.2.3.d:extractioncosts.
101
SledgeyardercablesystemThesledgeyardersystemis composedby threeelements.The first is the yarder, which is mounted on a sledge, and the main line which is storedinsidethe drum.The drum is poweredby anengineandthemovementmaybemechanicalor hydraulic, asthebrakesare.It is fixed usually uphil l neartheanchortreeand skids logsdownhill using the gravity force. The main line can be used to lift the sledgeuphill andreach placeswherethere are not forest roads. The skidding direction may also be uphillwhenthe felling site is locatedabove the forest road; the sledgeyardercanbe fixed bothuphill and downhill, so the evaluation of the skidding direction is not important. Theminimum slopeis 15-20%while the maximumslopeis 100% skidding downhill and120%skidding uphill (CAVALLI and MENEGUS 2003). The use of an additional drum and anendlessropeallow to work on “all terrain” conditions,evenon flat terrains, but this is quiteexpensiveandit is usedonly for civil engineering.The secondelementis the skyline which it is usually storedon an another big drum. Thisdrum is independentandit is used only to storetheskyline, it canbesited on a forestroadand can be poweredwith the tractor force when storing back the cableafter its use.Themaximum extractiondistance depends on the main line length and diameter (the drumvolumeis fixed) andthe maximumallowedload. Whenskidding light logs,theropecanbethinner and lighter, so the maximum extraction distance may be up to 1500-2000 m.Usually the skyline is a 22-24 mm diameter with minimum break load of 20 kN andtensionedup to 120kN (about 12 tons)(BORTOLI andSOLARI 1996).The third elementis the carriage.The automatic carriagesmay load up to 3 tons andarevery practical becausethey can stop everywhere along the line with hydraulic clamps.Other cheapercarriagesare the semi-automatic oneswhich are lighter but they can notwork with high spansbecausetheblockswould not beeasilymoved.These carriagesmayloadnot morethan2 tons.The sledge yarder is a versatile and powerful system, but the long mounting anddismounting times causefirst a productivi ty reduction (if we consider that mounting anddismounting a line of 900 m with two or threesupports may take one week), second thatcuttings should be intense and well distributed on the area to compensate the lowproductivity andthehigh unit costs.These systemsare optimal whenskiddingbig sizelogsbuckedinto 4 to 8 m size or thefull tree.Productivitiesareabout 8-10 m3/h (figure 3.2.3.e),but theydecreaseto 3-5 m3/haconsideringthe time for settingthe line; skidding firewoodthe productivity is lower, between2 and6 tonsper hour (figure 3.2.3.f) depending on thesite organization and to the firewood assortment (full tree or 2 m tied pieces). To beconvenient, the linesshould measure morethan200 m, andyield should beat least0.9-1.8m3 pereachlinearmeter(HIPPOLITI and PIEGAI 2000;IENTILE 2003),correspondingto 200-400m3 per working site (MARCHI 1997).Being able to move through the forest using the main line to lift it up, and thank to thelength of the ropes,the sledgeyardersystemdoesnot require high densityroads.When
102
skidding at 800 m distances,20 to 30 m/ha of roads are quite enough; if the extractiondistanceis evenmore, road density might decrease to 15-20 m/ha (BORTOLI and SOLARI
1996).
Sledge yarder productivity - logs
R2 = 0.0711
0
5
10
15
20
25
30
0.0 0.5 1.0 1.5 2.0 2.5 3.0
Average log size (m3)
Pro
du
ctiv
ity(m
3 /h)
Sledge yarder productivity - firewood
R2 = 0.2886
0
1
2
3
4
5
6
7
8
9
10
0 0.2 0.4 0.6 0.8 1 1.2
Average load size (t)P
rod
uct
ivity
(t/h
)
Figure 3.2.3.e: the sledge yarderproductivity slowly increase with theaveragesizeof skiddedlogs
Figure 3.2.3.f: productivity of the systemwhen skiddingfirewood, dataover0.8 t were2 m tiedpieces.
The systemproductivitiesare different when skidding logs and firewood. Figure 3.2.3.gcompares 50 carriagetrails skidding big sized spruce logs (RIZZI 2007) and 179 trailsskidding beechfirewood on very steepterrain (CAVALLI andLUBELLO 2006; RIZZI 2007;ZANONI 2007).Theproductivity is higher whenskidding logs becausetheir tying is easierand theyhaveless problemsduring thelateralskiddingoperation. Theoperating costof thesledge yarder was estimated in 98 €/hour so t he productivity influences costs (figure3.2.3.h)more than the distance.The averagecosts arequite constant between 10 e/m3 or18-28€/t.
All the information of skidding systemswere collected from literature and supported byfield observations.At theend,theywereresumedon table 3.2.4.ato have a clear ideaof allvariables(technicalsystemslimits, costsand formulae)which would be needed inside themodeland to easilycomparethem.The graph on figure 3.2.4.a showsthe productivity functions of all the consideredfivesystems. The different productivities will be helpful when optimizing the chooseof theoptimal system becauseafter the generalorder given by importance,the mostproductive(andconsequentlyeconomic)systemwill beselectedby the model.
Table 3.2.4.a:resuming all systemstechnical limi ts and functions.
Figure 3.2.4.a:systems productivity functions derivedby li terature and gathered fielddata.
3.3. COSTS EVALUATION
Today’s logging equipment rangesanywherefrom chainsawto complex multi -functionalequipment which can fell, delimb, buck, and haul to the landing. To select specificequipment andusethatequipmentprofitably, loggersshould know something of equipmentcostsandhowto determine them.A “machinerate” is a calculated hourly charge for owning and operating a piece of capitalequipment. Theclassical approachwas definedby MATTHEWS (1942)andmorerecently byMIYATA (1980). Costsare averaged over the ownership li fe of the asset to estimate aconstanthourly charge.Theformulaehavebeenusedin manyformsas a simple methodofcost estimation (e.g.BRINKER et al. 2002).The machine ratecalculations aresimple, easyto understand, do not require detailed cost history, and are constantover the lif e of themachine.However, a numberof authors (RICKARDS and PASSMORE 1977; STENZEL et al. 1985;BURGESSandCUBBAGE 1989) notethelimitationsof themachinerate:
- the treatmentof depreciationand interestdoesnot consider the effect on compoundinterestoncapital recovery
While the limitations are well-known, the standard machine rate is still widely usedforquick estimationof machinecostswhenactualcostsareunknown(FAO 1992).A more exact approach to estimating machine costs is the discounted cash flow,incorporatingadditionalcost categories such as tax effects. The detailed calculations areparticularly importantfor economic analysis of expensive equipment(helicopters,yarders,
105
harvesters). BUTLER and DYKSTRA (1981) and TUFTS and MILLS (1982) il lustrate theapplicationof discountedcashflow analysisto equipmentreplacement decisions.While themachinerate method haslimi tations, it has advantagesfor specific applications.The machine rate spreadsheetusedhere (seenext tables) usesa modified approach toaddresssomeof thestatedconcerns with earlier formulationssuchasMIYATA (1980):
- economiclife is estimatedaslonger(PETTENELLA andCUTOLO 1987;EDWARDS 2001;AMMAN 2004)
- capital costsare estimatedusing an equivalent annual cost calculation (RIGGS 1977;SARTORI andGALLETTO 1992)
- insuranceis calculatedasa% of averageannualinvestment- salvagevaluesareestimatedbasedonCUBBAGE et al. (1991)- housing is calculatedas the result of the formula: Vm(0.054CSh), whereVm is the
volumeof theequipment, CSh is the initial investmentor the rent rate for thebuildingand 0.054 is the yearly maintenance cost (% on building value) as depreciation,interests,maintenanceandinsurances(CROSS1998; AMMAN 2004)
- potential repair is estimatedas a % of depreciation,but chargedat a variable ratedependingonutilization (SARTORI andGALLETTO 1992;EDWARDS 2001)
- fuel consumption is adapted taking care of information from the owner records(HIPPOLITI et al. 1980)
- cost of lubricantsis calculatedaspercentage of total fuel cost (SAMSET 1972;CROSS
1998;EDWARDS 2001;ASAE 2004)The spreadsheetalso displays calculatedannual coststo aid comparison with actualcostdata. Costs for cable cranesystemsdo not consider the time neededfor mounting anddismounting the line: this cost shouldbe addedtime by time depending on length of theline (BORTOLI andSOLARI 1996) andshouldbe divided by the real skidding time (in daysor hour,but this is possibleonly whenthework is finished!).
106
Table 3.3.a:evaluatingtractor/skidderunit costs, fields in greyhaveto be fi lled by user.TRACTOR or SKIDDER WINCH TIRES (x4)
Cost item Symbol Formula Value Unit Value ValueInitial investment P 29602 € 15000 3000Salvagevalue S 15% P 4440,3 € 3000Economicli fe (years) n 10 years 10 3,4Daily scheduled operating time DSH 8 h 8 8Operating time(days) DY 150 days 95 150Scheduledoperating time SH DSH*DY 1200 h 760 1200Averagevalueof yearlyinvestment AI (P-S)*(n+1)/2n+S 18279 €/year 9600 1941Maintenance(rate) RMr 80 % 60Interestrate R 4 % 4 4Insurances,taxesandhousing ITGr 6 %Fuel consumption Fc 4 l/hLubricantconsumption Lc 0,11 l/h 0,4Fuel cost Fp 0,9 €/lLubricantcost Lp 2,4 €/l 2,4
Table 3.3.b: evaluatingmobile tower yarder(cable crane)unit costs, fieldsin greyhavetobe fill ed by user. In this case the tower is powered by tractor engine so the fuelconsumption is null.MOBILE TOWER ACCESSORIES TIRES (x2)
Cost item Symbol Value Unit Value ValueInitial investment P 55000 € 15200 400Salvagevalue S 11000 €
Economic life (years) n 15 years 10 4Daily scheduledoperatingtime DSH 6 h 6 6Operatingtime (days) DY 195 days 195 195Scheduledoperatingtime SH 1170 h 1170 1170Averagevalueof yearlyinvestm AI 34467 €/year 8360 250Maintenance(rate) RMr 60 %Interestrate R 4 % 4 4Insurances,taxesandhousing ITGr 2 %Fuelconsumption Fc 0 l/hLubricantconsumption Lc 0,2 l/hFuelcost Fp 0,8 €/lLubricantcost Lp 2,4 €/l
Table 3.3.c: evaluating sledgeyarder (fixed cablecrane system) unit costs, fields in greyhaveto befilled by user.SLEDGE YARDER CARRIAGE, ROPES, ACCESSORIES
Cost item Symbol Value Unit ValueInitial investment P 75000 € 28000Salvagevalue S 15000 €
Economic life (years) n 12 years 10Daily scheduledoperating time DSH 6 h 6Operatingtime (days) DY 150 days 150Scheduledoperatingtime SH 900 h 900Averagevalueof yearly investment AI 47500 €/year 15400Maintenance(rate) RMr 60 %Interest rate R 4 % 4Insurances,taxesandhousing ITGr 2 %Fuelconsumption Fc 4,1 l/hLubricantconsumption Lc 0,3 l/hFuelcost Fp 1,1 €/lLubricantcost Lp 2,4 €/l
Fixed costsDepreciation Ammort 5000 €/year 2800Interests In 1900 €/year 616Insurances,taxesandhousing ITG 950 €/yearUnit fixed costs OCh 8,72 €/h 3,8Daily fi xedcosts OCg 52,33 €/day 23Yearly fixed costs OCa 7850 €/year 3416
Table 3.3.e: evaluatingcable-forwarder unit costs, fields in greyhave to be fi lled by user.Thecable-forwarderis a forwarderwith basically two more accessories:thetilt system,thatallow the boomworking properlyand gain pulling force when the machineis on angledposition,andarearwinch to helpmovingupanddownonsteepterrains.JOHN DEERE 810D GRAB/ACCESSORIES TIRES (x8) TRACKS&CHAINS
Cost item Symbol Value Unit Value Value ValueInitial investment P 230000 € 12000 15200 8000Salvagevalue S 46000 €
Economiclife (years) n 8 years 4 4 8Daily scheduled operating time DSH 8 h 8 8 8Operating time(days) DY 195 days 195 195 150Scheduledoperating time SH 1560 h 1560 1560 1560Av. valueof yearly investment AI 149500 €/year 7500 9500 4500Maintenance(rate) RMr 60 % 60Interest rate R 8 % 8 8 8Insurances,taxesandhousing ITGr 8 %Fuel consumption Fc 9 l/hLubricant consumption Lc 0,3 l/h 0,1Fuel cost Fp 0,9 €/lLubricant cost Lp 2,4 €/l 2,4
Theunit costscalculated in sucha wayarethenfill edin themodelto evaluatethecheapestsystem insidedifferent assessedforeststands. The user-interfacewindow allow to changeinputsadaptingthemto specificsocial,cultural and technical level environment.
3.4. INPUT DATA
To run themodel,five input shapefiles arerequested: TheDigital Elevation Model (DEM),the soil stability andcomposition, the yearly amount of rain, the roadnetwork and forestassessmentalplaninformation.The model was first developed on a small area inside Veneto Region, on the Asiagohighlandsbecausedetaileddatawerealreadyavailable.The Digital Elevation Model was providedfrom the regional forest and economy headoffice (DFEM – DirezioneForesteed Economia Montana). It is a grid fil e that coversall
111
the region with a cell sizeprecisionof 25 meters. Thefil e is quite heavy,about 250Mbites,so it hasbeencut with theExtract by mask tool (ESRI 2005) on the studyarea(figure3.4.a)to makes fasteroperations andcalculations.
Figure3.4.a:location of studyareaandtheDigital ElevationModel
Theprecisionis not badcomparingit to Friuli DEM that is of 40 m, but it would havebeenbetterto have10 m as Trentino did. Smaller is thecell sizeandmorepreciseareoperationslike converting featureshapefiles, as roads, to raster (seealso figure3.6.2.d).working withinteger valueswould alsobepreferable.Soil information wasfound on a cd-rom containing severalVeneto region shapefiles(DEL
FAVERO 2001). The file has completeand preciseinformation about the soil formation,permeabilityof water,susceptibility to erosion andstabili ty. Al l information weremergedand a new field called “B_CATEG” was created(table 3.4.a and 3.4.b). This field isessentialwhen running the model: actually all soils are reclassified into three stabilitycategories(figure 3.4.b) to determine gradeabili ty (seenext chapter).Eventhestringvaluesand field name inside the databaseshould be the same,and in the same position to avoiderrors.
112
Table 3.4.a:databasefieldsof soil shapefile, fieldsin graycolor arecompulsory.Field Type Precision
The annual amount of rain comesfrom the samecd-rom thansoil shapefile (Del Favero2001). It is a polyline feature and each one has a single value (mm/year).Observingtheregionaldistributionit is evident that it rains heavier on mountainsthanon the plain (figure3.4.c).Thereis only one essentialfield to run themodel thathasto be called “A_MM_AA”(table 3.4.c). This kind of data arenot easyto be found,sometimesthey canbe gathered orbought from regional environmental agencies(ARPA), otherwise inside websites therecould be find nice imagesshowingrain lines. It is possible to import those imagesinsideArcMap, georeferencing them and creating a new fil e as needed.Rain values werereclassifiedinto four categories(<700mm;700-1500 mm; 1500-2500mm; >2500mm) andmixed insideamatrix togetherwith soil categoriesto evaluate gradeabili ty.
Table 3.4.c:databasefieldsof rain shapefile, fieldsin graycolor arecompulsory.Field Type Precision
All mapsare alreadyin a shapefile format including several data as buildings, objects,rivers, etc… The fact is that working on a big areait is necessary to download a lot ofdifferent mapsandthanmerge (ESRI 2005) them obtaining one unique file (figure 3.4.e).This is only time consuming,the real problemis that thosemapshave been doneprobablyby differentpeopleat different moments,soit is common to find writing errors,wrongdataor informationwith no coincidenceon whatshould be thesame road.All data were deeplychecked before the road reclassification according to forest machines accessibility. Onenew field (“TRANSIT” ) wasaddedto the file database(table 3.4.d), this field is necessaryto run the model togetherwith “NUMERO” which must contain unique valuesfor eachroadsector. The roads reclassify wascarriedon according to available information astheroadgrading(index related to their size andmanagement) andwidth as reported in table3.4.e.andon figure3.4.e.
Table 3.4.d:databasefieldsof roadsshapefile, fields in gray color arecompulsory.Field Type Precision
Figure 3.4.e:the studyarearoadnetwork.On the left side rough dataandregional grid oftechnical map are shown. On the right side roadshave beenclassified according to theiraccessibilit y (skidtrail, tractor roador truck road).
The regionaldatabaseof forest assessmental plans, called GPA, was provided from theregional forest and economy head office (DFEM – Direzione Foresteed EconomiaMontana). It is a polygonshapefile that coversall the regional public properties.The 204Asiagoforest standswereextractedfrom a total of 136assessmental plans and6644 stands.Like the roadsfile, even heresomedatawerenot exactor they were lost, so it hasbeenneeded to checkthe original printed version of the forest plan. In therewere foundmoredataaboutthe prescribed yield andthe yearof cutting. Information about the accessibilityand the ground were compared to a field survey with the aim of determine groundroughnessvaluesfor each stand (figure 3.4.f). All data wereupdatedinside a new dataset(table 3.4.f ).
INCR_PER numeric double(8 – 0) % yearlyincrement of forest
M_FUST numeric long(4 – 0) total high foreststock
M_CED_Q numeric long(4 – 0) total coppicestock
YEAR numeric long(4 – 0) yearof standcutting
Shape_Lenght numeric double(8 – 0) -
Shape_Area numeric double(8 – 0) -
117
3.5. BUILDIN G THE MODEL
3.5.1. Model basics
The model, called Forest Operations Planning (FOpP) is based on three differentinformative layers. The first one considers technical and economical data for eachmechanicalsystem,for exampleproductivit y (m3/h), costs (€/h) and technical limits (see§3.2 and3.3). Theseelements areentered inside the model asparametersand theystronglyinfluence thechoose of the most suitableharvesting system,technically andeconomically.The second informative layer concern to sylvicultural and assessmentaldata includingstandsboundaries,standing stocks and plannedyield which are neededto calculateunitcostsandto makespatial statistics.The last informative layeris themost importantbecauseis the basis to evaluate the forest accessibil ity. Both geographical, climatic andinfrastructuraldataareincluded asDigital Elevation Model, terrainroughness, forestroadnetwork, geologyandhydrology (yearly precipitation, mm/year). Digital dataor userdataenter themodelasinputs (figure 3.5.1.a) througha window panel(kind of interface).Thenthe model starts elaborating: the elaboration time depend on the grid size becauseallcalculations (morethan150) have a cell-basisdepending on theuse of geoprocessing tools
inside Spatial analyst (Arcmap, ESRI). The expected time for a 10 km2 area can be 8minutes if DEM cell is bigger than70 m andreach20 minutesfor 25 m cell size.Outputsare directly displayedin Arcmapandcanbeusedfor furtherevaluationsor comparedwithotherscenarios.
Figure3.5.1.a:theFOpP(Forest OperationsPlanning) model functional schema.
118
Themodelis built to evaluateharvestsystemsinsidehigh forests, but canbe adapted to beused also in coppice forests. We must distinguish high forest sites from coppiceonesbecauseif systemsare involved in both forest type they have different productivities anddifferent costs. A solution is to make first evaluations inside high forests and then incoppiceforests changingparametersandselecting appropriate system.Actually in coppiceforests tractor with winch, high-density polyethylene chutes and simple cable yardingsystems are used, insteadof high forests where tractor with winch, forwarder, cable-forwarderandcableyardingsystemswork. Chainsaw and harvestercanbeusedfor felling,otherprocessingoperationscanbeperformedby processorsor debarking machines. Fellingoperation costsor other managementcostscanbeaddedinsideoutput *.dbf fi lesto evaluatetotal working site costs(LUBELLO et al. 2007;KRČ et al. 2007).
3.5.2. The Arcmap ModelBuilder
There aremany programming languagesusedfor building models,asC+ (STÜCKELBERGER
et al. 2006), Pascal(LÜTHY 1998), Visual Basic (MEYER et al. 2001, HRADETZKY andSCHOPFER 2001, PRETZSCH et al. 2002, VÄÄTÄINEN et al. 2006) and others (statisticalmodels (GELLRICH et al. 2006, GELLRICH et al. 2007) or integer variables models(BUONGIORNO and GILLESS 2003)), but they are not easyto learn and often they needpowerful computers to be ran. GIS is a good software to handle and manipulatedigital/spatialdataand it is possible to build complex procedures to solve qualitative orquantitative problems(SHIBA et al. 1990, ARONOFF 1993,LAARIBI et al. 1993, BILL andFRITSCH 1994). The power is given connecting databaseto data logical structure likegeometries (points, polygons, lines, coordinates), topologies (position and boundariesrelatedto other adjacent objects),data structures(tablesand databases) and it is an easyway to manipulate,to build query andmakestatistics (TOMLINSON 1987, DENSHAM 1991,KEENAN 1995, CHIRICI et al. 2003). In ArcGIS 9.1 ESRI introduced a new useful toolcalled ModelBuilder. When you right click on the toolbox and add a new model, theModelBuilderwindow(figure 3.5.2.a) opens automaticallyand providesto you a graphicalenvironmentin which you canbuild models (ESRI, 2005).
Whenyoustartworkingwith theModelBuilder window you find that:- you canbuild a modelby stringing processestogether- you canconstruct processesby adding tools andsetting valuesfor theparametersof eachtool- you canshareparametervaluesbetweenprocesses- youcansetmodelparametersinside theModelBuilder window sothatthevaluesfor theseparameterscan besetwhenthemodel is run from itsdialogbox- you canedit dialogbox with customtips and helps- you canchangethe default diagramproperties to changethe layout of the model or thesymbologyappliedto elements- you canaddtext labelsto thedisplaywindow, elements,connectorlinesor customscripts- you cannavigateeasilyin themodelusing thezoomor pantools- you caneasil y repair aninvalid parametervalueor tool reference- you canprint your model andgeneratea report- you can import existing modelscreatedin ArcView GIS 3, andyou canexportmodelstoscriptsor graphicsto shareit.In geoprocessingin ArcGIS, a processis madeby a tool and its parametervalues (ESRI,2005). One process,or multiple processes connectedtogether, createsa model. Eachprocess in a modelis in oneof threestates:
- not readyto run- readyto run- hasbeenrun
Thestateof a processdependson the stateof its elements. A process is readyto run wheneach of its elementsis ready to run. By default, elementsthat are not ready to run aresymbolized in white. An element is not readyto run if the required parametervalue orvalues for that element have not been set. When you initially drag a tool into aModelBuilder window, the tool is in a not-ready-to-run state because the requiredparametervalueshavenot beenspecified,asthegraphic below shows:
Elementsthat arereadyto run are symbolizedwith colors: input (or project) dataelementsare blue, tool elements are yellow, and output data (derived data)elements are green.Aprocess is readyto run when all elementshavebeensupplied with the required parametervalues.
120
Whena process hasrun successfully,the tool and deriveddataelements are displayedwithdrop shadows, indicating that theprocesshasrun and the deriveddatahasbeengenerated.You canalsodecidethe order of tools when running the modelby right clicking any tooland setting priorities.
Oncethemodelhasbeensaved,it is useful to give it a nameand a shortdescription. This ispossibleenteringthe General folder inside the Model propertieswindow. The model heredescribedwascalledFOpP(ForestOperationsPlanning)
It is very useful to introducein themodels someparametersthatwil l bemanagedby futureusersthroughtheuserinterfacewindow. Fromthebuilding modelwindow it is possible tointroducea new variable by right clicking any tool. Variablesareshown in light blue and
121
havea “P” if theyare setasmodel parameter. As in the examplebelow, you mayask theuser to give a new reclassification method or you could ask to find this informationselecting it from a*.txt file.
All your modelparameters areshownas a list in the Parametersfolder insidethe Modelpropertieswindow (seeabove). You canorder them asyou prefer andthe sameorderwillbe in theuserinterface.To eachparameter you canalsoinserta comment describing it or ashort linesto helptheuserfillin g or modifying datato adapt themodelto his necessities.
Through the Model Properties window, or if you are a userthrough the Dialog window,you canentertheEnvironmentssettings.
122
Figure3.5.2.c: theEnvironmentssettingwindow
This is the core of the model, you must set your workspace (input data and outputgeodatabases)and your geographical coordinate system. If you do not, you could haveproblemsin showing or evenin running the model becausegeoprocessingtools will notwork properly. It is suggested to set your input Digital Elevation Model as mask for theOutput extent and for the Cell size. This will avoid problems of not exact coincidencebetweenoutput rasters that could deriveby some conversionsthat themodelperforms.It isthe caseof convertingpolylines or polygons into grid or rastersfi les (figure 3.5.2.d): youmaynoticesomeloosingdatanearroadsor nearyourstudyareaboundaries.
123
Figure3.5.2.d: anexample of errorsthatmay occurperformingshapeconversion
3.5.3. Organizing data: geodatabases
Whenworking with a model, you needto setthe location of your files in the “environmentsettings” window. For this reasontwo foldersare needed,one containing input shapefiles,the other wil l storeall output-files. But whenclosingArcMap,all those output-fi leswill bedeletedbut not thosethat weredefinedas“parameters”inside the model. All intermediatecalculationsandmaps will belost, but you wil l savea lot of spacein your hard-disk.Thesefolderscontaininggeographicfiles arecalledgeodatabases.Thegeodatabase, short for geographic database,is thecore geographic information modelto organize GIS data into thematic layers and spatial representations (ESRI 2005). Thegeodatabaseis a comprehensive seriesof application logic and tools for accessing andmanaging GIS data. This application logic is accessible in client applications (ArcGISDesktop),serverconfigurations(ArcGIS Server), andlogic-embeddedcustomapplications(ArcGIS Engine).The geodatabaseis a GIS and database managementsystem (DBMS)standards-basedphysical data store and is implemented on a number of multiuser andpersonal DBMSsandin XML. Thegeodatabasewasdesignedasanopensimple-geometrystorage model.Someadvantagesof a geodatabaseare:
o Geodatabasescan have built-in behavior and are stored completely in a singledatabase.
o Largegeodatabase feature classescanbestored seamlessly, not tiled.o In addition to generic features,such as points, lines, and areas, you can create
o Custom featurescan have specialbehavior to better representreal-world objects.You canusethis behavior to support sophisticated modelingof networks,dataentryerror prevention,customrendering of features, and custom forms for inspectingorentering attributesof features.
o Each featureis storedasa row in a table. Thevector shape of thefeatureis storedinthe table'sshapefield, with the feature attributesin other fields. Eachtable storesafeatureclass.
Figure3.5.3.a:thegeodatabaseandmodelfil esasshown inside the ArcCatalog (left) andin the“resourcesmanager”of a personal computer (right)
Two typesof geodatabasearchitecturesareavailable: personalgeodatabasesandmultiusergeodatabases. Personal geodatabases, which are available to all ArcGIS users,use theMicrosoft Jet Engine database file structure to persist GIS data in smaller databases.Personalgeodatabasesaremuchlike file-basedworkspacesandhold databasesup to 2 GBin size.Microsoft Accessis usedto work with attribute tables in personal geodatabases.Personalgeodatabasesare ideal for working with smaller datasetsfor GIS projects and insmall workgroups.Personalgeodatabasessupport single userediting, and no versioningsupport is provided.Multiuser geodatabases require the useof ArcSDE andwork with avarietyof DBMS storagemodels (IBM DB2; Informix; Microsoft SQL Server;andOracle,with or without OracleSpatial or Locator). Multiuser geodatabases are primarily used inworkgroups, departments, and enterprisesettings. They take full advantage of theirunderlying DBMS architecturesto support:
o Large,continuousGISdatabases.o Manysimultaneoususers.o Longtransactionsandversioned work flows.
Multiusergeodatabasesreadily scale to large sizesand numbersof users.Geodatabase XML representsESRI's openmechanismfor information interchangebetweengeodatabasesand other external systems(i.e.: internet). ESRI openly publishes andmaintains the completegeodatabaseschema and content as an XML specification andprovidesexampleimplementations to ill ustrate how you can sharedataupdatesbetweenheterogeneous systems. XML interchange of geospatial information to and from the
125
geodatabaseis simplified using the geodatabaseXML specification. External applicationscan receiveXML datastreams,including:
o Exchangeof complete losslessdatasets.o Interchangeof simple featuresets(much like shapefile interchange).o Exchange change-only (Delta) record setsusing XML streamsto passupdatesand
changesamonggeodatabasesand otherexternaldatastructures.o Exchangeandsharingof full or partialgeodatabaseschemasbetweenArcGISusers.
Geodatabases are relational databasesthat contain geographic information. Geodatabasescontainfeatureclassesandtables.Featureclassescanbeorganizedinto featuredatasets.Featureclassesstoregeographic featuresrepresentedaspoints, lines,polygons, annotation,dimensions,and multipatches and their attributes.All featureclassesin a feature datasetshare the same coordinate system. Tablesmay containadditional attributesfor a featureclassor geographic information, such asaddressesor x,y,zcoordinates.Manyobjects in a geodatabasecanberelatedto eachother.For example, tablescontainingcustomer addressesand billing information are related, just as state and county featureclassesarerelated.To explicitly definethe relationships betweenobjects in a geodatabase,you must createa relationship class. Relationships let you use attributesstored in a relatedobjectto symbolize,label, or querya featureclass(BURROUGH 1986;SMITH et al. 1987).Feature classes in a feature datasetcan be organized into a geometric network or atopology. A geometricnetwork combinesline and point feature classes to model linearnetworks - for example,electrical networks - and maintains topological relationshipsbetweenits featureclasses.A topologyis a set of relationships that defineshow thefeaturesin oneor morefeatureclassessharegeometry - for example, citiesmust beproperly insidestates.Topology in a geodatabaseallows you to represent sharedgeometry between featureswithin a featureclassandbetweendifferent feature classes.You canorganize the featuresin a geodatabaseto createplanartopologiesor geometric networks.Featureclassescan sharegeometrywith other feature classes in a planar topology. Forexample, you might definea topologicalrelationshipbetweenstreets,blocks,block groups,and census tracts. The street segmentsdefine the boundary of the block they enclose.Groupsof blockscanbecollectedinto blockgroups, andblockgroupsinto tracts.A planar topologyis composedof a setof nodes, edges,andfaces.Whenyou updatetheboundary of onefeature, thesharedboundariesare updatedaswell.
Figure3.5.3.b: basisof topology
126
Topologically related edgeand junction features within a datasetcan be bound into ageometric network. This is usefulwhen the featuresmust be connectedto eachother withno gaps. For example, you could organize pipes,valves,pumps, and feedersinto a waternetwork.
3.5.4. Describing processes of the model
The ForestOperationsPlanning model is split in two parts to simplify procedures andreducetherunningtime.Thetwo partsarecalled:
They may be opened trough the ArcMap toolbox by double-clicking the icon. An userinterfaceli ke that on figure 3.5.2.b will appearandenable the userto setparameters andrun thetools.
The functioning structure of the model is quite intricate (figure 3.5.4.a) and will be nextexplained stepby stepwith diagramsandexamples.
127
Figure 3.5.4.a: the defining skidding systems and systemsoptimization andcoststoolsdiagrams. They include more than150 stepswhich takefrom half to onehour runningtimedependingon thesizeof theplanningarea.
3.5.4.1 Defining skidding systems
Thefirst stepof this tool is determining trafficability classesandgradeability. Starting fromgeology and precipitation, the model definesa list of soil trafficability classes(AA.VV.1961; ANDERSON 1985; BONASSO 1989; AA.VV. 2002). On the basis of the soilcomposition andpH, the geology shapefile is converted into a grid fil e and consequentlyreclassifiedinto threestability classes:high, normalandlow (values1-3 - table3.5.4.1.a).The rain input shapefile is alsoconvertedinto a grid file andreclassified into four classesaccordingto the averageamount of rain (values10 - 40). Classesaredefined consideringtheAlpine climate.The two grid files (stability and h2o_year) are summed(figure 3.5.4.1.a) with algebraicinstrumentsand reclassified into four gradeabilit y classes (table 3.5.4.1.b). Theseclassesare used then to selectthe maximum slope to which off -road systemscan move insideforest(BEKKER 1969; SAMSET 1975; ROWAN 1977; MELLGREN 1980;LÖFFLER 1984). Themaximum slopevaluesaresetas model parameters,so they canbe modified by the userthrough the model interface.Figure 3.5.4.1.bshow an exampleof the output gradeability
file.
Table 3.5.4.1.a:Reclassifying soil andrain input fil esto evaluategradeabilitySoil stabili ty
Rain mm/yearHIGH
1NORMAL
2LOW
3< 700 10 HIGH (11) HIGH (12) HIGH (13)700-1500 20 HIGH (21) HIGH (22) NORMAL (23)1500-2500 30 HIGH (31) NORMAL (32) LOW (33)> 2500 40 NORMAL (41) LOW (42) VERY LOW (43)
128
Figure 3.5.4.1.a:lay-out for gradeabili ty calculation starting from stands, soil and raininput shapefiles.
Table 3.5.4.1.b:Maximumslopevaluesaccording to gradeability classesGradeability
Consequently, threebasicmapsare created:theslope,the extraction distanceandtheuphillor downhill direction(figure3.5.4.1.c).The slope is created starting from the Digital Elevation Model using the slope tool insidetheSpatialAnalyst toolbox. Valuesarecalculatedin percentage(figure3.5.4.1.d)The extraction distanceis generated,starting from the roadsshapefile, by the Euclideandistancetool (TUČEK and PACOLA 1999). The maximum distance may be changedby the
129
user,as default it is set up to 1500 m. The map is after reclassifi ed to eliminate a smallerror, in fact thecellscorresponding with theroad trackhavenull value and this will causea wrongchoiceof systems.A new value(we used15 m as average)wassetto thesecellsand acontinuoussurfaceis obtained(figure3.5.4.1.e).
Figure3.5.4.1.c:FOpPmodel lay-out of slope,extractionandUpDown mapsevaluation
Figure3.5.4.1.d:theslopemap Figure 3.5.4.1.e: the extraction distancemap
The evaluationof up anddown skidding direction is a littl e complicate (figure 3.5.4.1.f).Vector roadsareconvertedinto a grid fil e (only truck andtractor roads,skidtrails arenotconsidered)andthey areusedasa maskto extractvaluesfrom theDEM (theRoadSlm map
130
is obtained).UsingthePathDistanceallocation tool thevaluesof eachroadcell arespreadall over the areaat an equal distance from other roads (demRoad grid fil e). Through asimple operationperformedwith the map calculator) DEM values are subtracted fromdemRoadvaluesobtaining a mapwith positive and negative values.TheUp-downgrid file(figure3.5.4.1.g)is calculatedby a reclassification of values: positive values correspondtothe uphill side (downhill skidding direction), negative values to the downhill side(GRIGOLATO 2006).
Figure 3.5.4.1.f: showing elementsconsideredgeneratingtheup-down grid fi le
Figure3.5.4.1.g:theup-downmap
Theevaluationof feasibility mapsis quite similar for theoff-roadsystemsandfor thecablesystems, as it is shownin figure 3.5.4.1.h.The model makesa cell-by-cell evaluation forboth skiddingdirectionsaccording to slopeanddistancetechnical limits (CIELO et al. 2003;HIPPOLITI and PIEGAI 2000) ason table3.5.4.1.c.Theseparameters(the blue balloons infigure3.5.4.1.h)may beadaptedto theuserneeds.
Table 3.5.4.1.c: technical limits used in the ArcMap model. The maximum slope variesaccordingto thegradeabili ty.
Skidding Downhil l Uphillsystem maxslope maxdistance maxslope maxdistance
With the technical limits information,model is able to determinefeasibleareasfor eachselected skidding system. Output maps (example on figure 3.5.4.1.i) distinguish theskidding direction (HEINIMANN 1986 and 1994; LÜTHY 1998; KRČ 1999) and for cable
131
systems themodelverify (sort of profile slopeanalysis) thataverage inclination from eachcell to thenearestroadis enoughto guaranteethegravity functioning (figure3.5.4.l).
Feasibility analysis
Tractor– TR
Mobile toweryarders– CC
Forwarder– FO
Sledgeyarder– SY
Cableforwarder– CF
Figure 3.5.4.1.h:the schemaof tool usedcreating feasibility maps.In blue balloonsaremodel parameters that may be setby the user.Circlesunderline a sort of profile slopeanalysis.
Figure 3.5.4.1.i:exampleof mobile tower cranesoutput map (on the left side) and theoverlayof tractorandforwarder maps(on theright side).Thestandwith the arrowis thesameoneconsideredon themodelvalidationparagraph (§ 3.6.1)
132
Figure 3.5.4.1.l:mobile cablecranesystems(tower yarders)aredividedin two types,the2 ropescable systemsskidding uphill andthe 3 ropescable systemsskidding downhill.If theterrainshapeand slope arequiteflat or irregular, thefeasibili ty mapwil l show “noslope” areasin whichonly all-terrainsystemscan work (on theright side)
3.5.4.2 Systems optimization and costs
The secondpart of the FOpPmodel makesan overlay of all five systemsmaps (tractor,forwarder,cablecrane,sledgeyarder and cable-forwarder)in two different ways, from atechnicalandaneconomicalpoint of view.Both algorithms start from a basic standclassification according to the terrain roughnessand to thestandyield (cutting amount). Theterrain roughnessis one limit ing factor for themachineoff-roadmovement,while the yield influencetheproductivity of systemsandtheirchoice. If there are less than 48 m3/ha it is not convenient to relocatebig machines asforwarder,but to usetractor and winch. Systems have so an order of importance:tractorand mobilecablecranesareat samelevel, thenfollow theforwarderandsledgeyarderandlast comesthecable-forwarder.According to the definedclasses, thechoicewill bedoneonthe “importance”basis.Starting from inputstandshapefile, terrain roughnessis reclassifiedinto four levels(values10 – 40), while theyield is reclassified into threelevels(values0 –2). Thetwo mapsare summedandstand classesareobtained(figure 3.5.4.2.a).All possiblevaluesare shown on table 3.5.4.2.a: to eachvalue is assignedthe most feasiblesystem(written in red) and all the other systemswhich could work on the sameparameterscombination. Whenthemodelmakesthemapoverlay it wil l selectsystemsin that order.
Table 3.5.4.2.a: matrix of valuesdefining stand classesand order of systems for theirchoice.
Yield m3/cellRoughness
= 00
0 - 31
> 32
Smooth 10 10TR
CC / FO/ SY / CF
11TR
CC / FO/ SY / CF
12FO
CC / SY /CFUneven 20 20
TRCC / FO/ SY / CF
21TR
CC / FO/ SY / CF
22FO
CC / SY /CFRough 30 30
CCFO / SY /CF
31CC
FO / SY /CF
32CC
FO / SY /CFVeryrough 40 40
CCSY
41CCSY
42CCSY
Figure3.5.4.2.b: exampleof classesoutput map.
The technical evaluation algorithm starts from the five systems maps and perform anoverlay taking care of classesas defined in table 3.5.4.2.a and figure 3.5.4.2.b (figure
134
3.5.4.2.c). The procedure looks like complicate, but the used tools are only two, thereclassify tool and the single output map algebra. The number of systems and thedistinctionbetweenuphill anddownhill extraction makecalculation quite long.Figure3.5.4.2.dshows an exampleof technicalsystemevaluationmap, someareasarenotreachabledueto distance from roadsor steepslope.
SYST
EM
S
Figure3.5.4.2.c:lay-out of the FOpPalgorithm for technicaloutput map
Through the input model window the user can set averagecosts and productivities ofselected systems.With thesedata the model makesa simple evaluation of costs. Thetechnicalmapis reclassified andcostsare calculatedcell-by-cell both per cell andpercubicmeter (figure 3.5.4.2.e).Outputs canbe seeas grid maps (figure 3.5.4.2.f) or resumedindatabasetables with some statisticson forest stand basis (table 3.5.4.2.b). Minimum,maximum, average andtotal costs arecalculated.Costs arestrictly dependingon the yielddistributionandthechoiceof systems.
135
Figure3.5.4.2.e:lay-out of tools usedto makestatistics.
Table 3.5.4.2.b:summary statisticsof somestands.Valuesequal 0 meansthatthere will notbe cuttings in the next 10 years. Skidding costs vary from 5.5 €/m3 where forwarder ismainly usedto 8.8where sledgeyarder is necessaryto work (standsA223andA228).
Having different productivities and costs, eachsystem has a unique value per eachcell,different from values of the other systems.The optimization tool starts from thisassumption and select the cheapestsystem through a cell statistic tool (choose theminimum valuebetweendifferent overlaying grid fil es).Theobtainedmap(cost_select) iscompared with systemscost maps to assignto eachcell the systemswhich correspond to(tool equal to). The optimal systemsmapis obtainedmaking a sumof the previous maps(obtained from the comparisonof costsselection and systems costs) as shown on figure3.5.4.2.g. The result map(figure 3.5.4.2.h)is similar to the technicalsystemmap,but forexample the tractor disappearedbecauseis thelessproductive systemswhich meansoneofthemostexpensivewhere theyield is very low.
Figure3.5.4.2.g:lay-out of toolsusedto makesystems andcostsoptimization.
The optimization method usesthe systemsproductivity functions (figure 3.2.4.a) whichwere estimatedgiving correlation to skidding distance from forest road (PIEGAI 1990;FANARI et al. 1999; DELLA GIACOMA et al. 2002;ZUCCOLI et al. 2006). Theresultgives adecreasing value (in m3/hour) for eachsystem working far from road (figure 3.5.4.2.i).After this calculation,dividing productivitiesby yield it is possible to know how muchtimeskidding operationswill last and how muchthey will cost (figure 3.5.4.2.l). This value issuddenlydivided by the yield (cell by cell), transformed in €/m3 and a statistic table iscreated(table3.5.4.2.c).
Figure 3.5.4.2.i: on the left side a generalcost function map; on the right side a costoutputmap(€/m3).
Figure 3.5.4.2.l: optimizedcostsmaps,costs arecalculatedcell-by-cell (left side) or percubic meter (right side).
Costs increasewith distance
Extractioncosts (€/m3)
138
Table 3.5.4.2.c:summarystatisticsof somestands.Valuesequal 0 meansthatthere will notbe cuttings in the next 10 years.Skidding costs vary from 9.66 €/m3 where forwarderismainly usedto 16.91wherecablecranesystemsarenecessary(standsA223andA224).
An interestingstepof themodelwastheevaluationof how muchwood wil l beskiddedtoeach forest road section, and to calculate averagecosts. The schema was implementedinside the model (figure 3.5.4.2.m), but after severaltries was eliminatedbecausethereweresomefunctionalproblems.In fact, thereweretwo joinsbetweentablesthat hadto becreatedrunningthemodel, but thiscausederrorsand theevaluationneeds to behand-made.Neverthelessresults (figure 3.5.4.2.n) are interesting becausethey highlight which roadswill supportmoretraffic and will needmore maintenance.
Figure3.5.4.2.m:lay-out for woodskiddingto roadanalysis.
The FOpP modelcan be sharedwith other researchersby exporting and installing it asasimple toolbox in ArcGIS(*.tbx file). This is not theonly one way, it canbe exportedas atxt file or as a program into a specifi c language (Python) or into a Visual Basic forApplications(VBA) using ArcObjects.Thereareseveralhelps on-line inside thecustomerservice websites that everybody could modify the model or improve it with ownalgorithms.
Model verification and validation (V&V) are essential parts of the model developmentprocess if modelsareto be acceptedandusedto support decision making. In fact, oneofthe very first questions that a person who is promoting a model is likely to encounteris“hasyour modelbeenvalidated?”(MACAL 2005).Verification is doneto ensure that themodelis programmedcorrectly,thealgorithms havebeen implementedproperly and the model does not contain errors, oversights, or bugs.Verification ensuresindeedthat the specification is completeand that mistakes havenotbeen made in implementing the model, thus it does not ensure the model solves animportant problem,meetsa specified setof model requirementsandcorrectlyreflectstheworkingsof a realworld process.Thepracticalverification is a longprocessandit should takecount that:- no computational model will ever be fully verified, guaranteeing100% error-freeimplementation- a high degree of statistical certaintyis all that can be realizedfor any modelasmore casesare tested
• Statistical certainty is increasedasimportantcasesaretested
• In principle, a properly structuredtestingprogram increasesthe level of certaintyfor averified modelto acceptable levels
• Exercisemodelfor all possiblecases
• Automatedtestingprocess- model verification proceeds as more tests are performed,errors are identified, andcorrectionsaremade to the underlying model,often resulting in retesting requirementstoensurecodeintegrity
140
- the endresultof verification is technically not a verified model, but rather a model thathaspassedall theverificationtests!Validation ensuresthat themodel meets its intendedrequirements in termsof themethodsemployed and the results obtained.The ultimate goal of modelvalidation is to make themodel useful in the sense that the model addressesthe right problem,providesaccurateinformationaboutthesystembeingmodeled,andto makes themodelactuallyused.
3.6.1 Comparing results with real working sites
A goodway to testthemodel is to compareresults with some realworking sites.To do thisit was asked to two private enterprises(SAMBUGARO and DALLE AVE from Gallio andAsiagomunicipalities) which werethe latestoperations andwhich systemswere used. Totheir answers wereaddedalsosomeobservations taken duringa previousstudy conductedon cable cranesystemson the samearea(TOMASINI 1996). Sevenworking sites wereconsidered,threeusing tractor and winch, one using forwarder, two using mobile cablecranesand oneparticular siteweresledge yarderwasused in parallel with forwarder, bothownedby thesameenterprise. Theworking areawasgeoreferencedand usedasa mask toevaluateFOpPresultsusing the summary statistic tools in ArcGIS. Classified cells weresummarizedpereach systemand comparedto the realused skidding system.FOpPresultswereso evaluatedaspercentageof right or wrong estimation (error). It should be pointedout that inside eachforeststandFOpPresult haveto be interpretedby theforesterthatusesthis modelandprobablyhe will chosethe skidding method by choosing the onewith themajority of cellsinsidethatstand.Figure3.6.1.ashowsFOpP resultson tractor with winch working sites. On the left andonthe right foreststandthe majorityof cellswould suggest theuseof theforwarder,but whenthe operationswere done this machinewas not available. Inside thesetwo stands,theforwarder is better than tractor because of quite high values of steepslope and terrainroughness.The standshowedin thecenterwason a very good terraincondition (gentle andsmooth)andcuttingamountwasnot so intense,so the tractor is thebest. Thecompetitionbetweentractorandforwarderis quite strong now on the Asiagoforests becausethere aretwo machines,sotheevaluation of themodel could beconsideredquite good. Neverthelesstheerror is high (only 79 “tractor” cellson319 total cellsof thetreeareas),figure3.6.1.b.
Insidethe studyarea wasfound only onesite where extraction operationswereperformedwith theforwarder(it wasalsopossible to bepresentat thattime). Whenthe soil is not wet,the machine caneasily drive loaded(downhill direction) on steepslopesup to 38%. Duringthe loading phasea skilled operatormay be able to reachfelled treeseven on steeperterrainsusingtricks with the boom.This is evenmoreeasyif the chainsawoperatorfellstreestowardtheright directionsknowingtheneedsof themachine.This meansthatusingaterrain Digital Elevation Model with a 25 m definition, some cells, wherethe slopeis toohigh andthemodelsuggestfor example theuseof cablesystems,would bealso reachableby theforwarder. This is thecaseof figure3.6.1.cwherealmostall cells lying on thestandborders(the browns) would be skidded with forwarder.Greencells wil l be also easilyreachedastheviolets(but only in this case) becausetheforwarder in usehad a winchwith20 m wire rope (so comparable as a cable-forwarder– figure 3.6.1.c). The estimation of
142
forwarderworking areas is quitegood: the error is only 19%,but could be lessconsideringvalid cells alsothosewith tractoror cable-forwarder(13,6%- figure3.6.1.d).
Figure 3.6.1.c: comparing FOpPresultson two working sites whereskidding operationswereperformedwith forwarder.
FOpP results and reality on working sites with forwarder
On those standwherethe terrainparametersaretoo badfor theground skidding operationsthe FOpPresultssuggesttheuseof cablesystems.Thenonly two parametersinfluencethechoice betweena mobile tower yarderanda sledgeyarder: the distancefrom forest roadand the yield amount.Wherethe yield is very low is would bepreferabletheuseof tower
143
yarderbecausemounting and dismounting time andcosts arelower thanthose of a sledgeyarderline setting. The examples on figure 3.6.1.e show two stand well servedby forestroadwherethe useof cable systemsis well estimatedwith a 32.4% error (figure 3.6.1.f).The stand on the left sidemay have someproblemsof setting the linesdue to a terracedterrainand anaverage slopenear thelimit of function for gravity systems.
Figure3.6.1.e: comparingFOpPresultson two workingsiteswhereskiddingoperationswereperformedwith cable cranes(mobile tower).
FOpP results and reality on working sites with cable systems
One working site wasparticular because two forest standswerecut at the sametime andbecausetwo systemswere usedin parallel: a sledgeyarderand a forwarder. The cablesystem wasusedon the steepestareawhile the forwarderextracted wood from the easiestones (see pictures on figure 3.6.1.g). The model suggested thesetwo systemsbecauseinside this areathe road network is insufficient, therewas only an old skidtrail created
Onegood way to testthe model wasto checkresults comparing themwith anothermodelbuilt with more of less the samepurpose. This had been possible thank to a strongcollaboration betweenthe University of Padova(Dept. TeSAF) and the University ofLjubljana(Dept.of Forestry).KRČ (1999and 2006)developeda SDSSmodel (called hereIDRISI model, becauseit runson IDRISI geographical software) to evaluatethe suitabilit y and costs of using differentsystemsor machinesfor cuttingand skidding operations.Theselectionof skidding systems(technology)andskidding direction is derivedby model,which makethe determinationof optimal skidding system andskidding direction (uphill,downhill). Wood skidding mapwas determined by procedure of Multi-Criteria Evaluation(MCE) of influential factors summarizedto Multi -Criteria Evaluation method (EASTMAN
1995). By the MCE method the optimal skidding model wasdetermined.The first stepofskidding model determination was procedure for selection of influential factors and theirimportance. The criteria for influential factor selection were relatedto significant terrain,standsand opennessconditions of forest compartment. The weight of every influentialfactorhadto bedeterminedon the baseof importanceratio amongtheselectedfactors. Theweight was derived by pairwise comparison method(SAATY 1980). For every skiddingmodel its suitability valueshowing suitabilit y gradeon concrete ground plot, representedby raster grid cell was calculated. The suitability value is related to terrain and standconditions expressed by selectedinfluential factors (terrain slope, skidding distance,rockiness,soil bearing capacity). The procedurefor suitability value calculation wassummarizedto weighted linear combination of standardizedvaluesof influential factors.The standardizedvalues were derived by positive correlation between influential factorvalue and its suitability for each skidding model separately. For instancesteep terrainslopeshave high standardized valuefor cable craneskidding modeland low standardizedvalue for tractor skidding model. The last step of skidding model determination was thecomparison of suitability indexeson every ground plot expressed by rastergrid cell. Thesuitability index comparisonwas enabled through using of pairwise comparisonmethodwhich distributes the determination of skidding model on the altogether influence ofselectedinfluential factors.Skidding method with some additional data (skidding distances, skidding direction) wasusedas input data into computerprogram,which hadbeendevelopedfor forestoperationcost calculation (FireFox software, similar to Access). Basic unit is forest compartmentwith specific set of influential factors, derived from forest inventory (Slovenian ForestService data).The programcalculatespotential cutting and skidding cost using standardtimes(KOŠIR 2003)multiplied by systemhourly cost.Therearealso separated proceduresdeveloped for determinationof standard times for each specific operational condition(meanthreevolume,skiddingdistance,terrainconditionsetc.)andsystemhourly cost(KRČ
and KOŠIR 2005).
146
3.6.2.1 Greece
We testedthe modelsfirst on an areain Greece. The area(Valia Kyrna) is placed in theforestcomplexof Smolicaat rangemountain of Pindos– in Northern Greece.Theforest ismainly composedby Pinusnigra, known in Greeklanguageas“Robola”, and it is a uniquebiotopebecause manyrare speciesare living there(brown bears,wolves, lynx, etc.). Theroadnetwork is old, but every yeartheoffice of forestry improvesthenetworkin order tobe accessiblenot only for logging;but also for multi-use purposesandrecreational reasons(STERGIADOU 2007). In Greecethe forestryis ecologically andlesseconomically orientedand themain reasonis that the forestlandbelongsmainly to theState(STERGIADOU 2006).Input datawerevery roughandinformation about soils andforest management needed tobe implementedbefore running the models. Results map ( figure 3.6.2.1.aand 3.6.2.1.b)were comparedshowingthat IDRISI model is strictly connectedto the forest stand area,while ArcMap FOpP model considersthe entire area.Both modelsconsiderthe skiddingdirection,buton theFOpPfinal result mapthis is not showed.
Figure3.6.2.1.a:FOpPmodel resultsmap
147
Figure3.6.2.1.b:IDRISI modelresultsmap
Results were also comparedon forest stand basis to check how the shareof differentsystems changebetweenmodels. On the IDRISI model (figure 3.6.2.1.c) the share(%) ofsystems variesvery lit tle andseems that only the selection of manual skidding methodiscorrelated to the incrementof yield (R2=0.96). Inside the ArcMap model, the intensity ofcuttings influencesthe choice of the skidding system so, it would be expected thatincreasing the yield, the shareof skidding systemsshouldvary and the most productivesystemshouldincrease.Resultson figure 3.6.2.1.d have no statistic approval, but thesmalltower cranesincrease(R2=0.59) while sledge yarders (low hourly productivity) slowlydecrease. Thedifferenceon thenon reachable forest is significant andit dependon theroaddensity and on systems technical limits set before running the model. Here seemsto bemoreexacttheFOpPmodel defining a technical, environmentally andeconomicallimit upto 900m (sledgeyarders).Forestareassitedfarer from roadswould require thebuilding ofnew roads, but only if their function hasproduction purposes (that is not the case of thisGreekforest).
Figure3.6.2.1.d: shareof systems asfromArcMapoutput
3.6.2.2 Slovenia
After the first attempt to validate the model on the Greek area, the FOpP model wasmodified becauseanerrorwasfound on a processcalculation. Someproblemswere relatedto the use of ArcMap tools which may incur on errorsif working with floating numbers(double precision after commas). More over, the calculation with floating values takeslongertime andit was checkedall themodel algorithm to make thecalculation faster. Af terthesechanges,the model have beenagain comparedwith the IDRISI model on a hugeproductive forestarea(ab. 1450 km2), characterizedby steepterrains and low yield forestcoppices (figure5.3.2.a).Heretherunning time tookabout 45 minutes.Study arealies over the borderbetweenSloveniaandItaly (figure 5.3.2.a): it includesthemountain community of Torre, Natisoneand Collio and four Slovenian municipalities(Tolmin, Kobarid,Kanaland Brda) raising a total of 143047ha.About 70%(98340ha) ofthe areais coveredby forestswhich aremainly broadleaftrees(beech,oak, ash, hornbeam,maple). Only 10% of forest area is coniferous plantation. On Slovenian side, forestrydatabases (1087compartments) androad shape-files wereavailable andreadyto be used.On Italian sideonly data comingfrompublic assessedforestswereavailable: for theprivateareas, information from CorineLand CoverandUseand forest typologies were joined toderive estimation of stocksand allowable cutting volumes.The input datapreparingis atimeconsumingwork (severaldays)which is neededto run themodelwithout errors.Running modelson thesamearea wasvery useful: the forest andterraincharacteristicsarechanging betweenItaly andSlovenia,so eventhe model results wereexpectedto change.This is clear on table 3.6.2.2.awhere FOpP results are comparedaccording to the twocountry areas:on the Italian side theuseof tractorandthe un-reachable foresthavelowervalues than in Slovenia,the use of small mobile cable systems decreaseof 50%. Thisvariationis dueto two main reasons:
149
• thefirst is theterrainsteepnesswhich is veryhigh on theItalian side(soit’s good towork with cablesystems)
• secondis the road network. In Slovenia thereare 23.1 m/ha as averageof truckroads, in Italy the averageroad density reach 20.5 m/ha. This means loweraccessibility to forest. Nevertheless,the un-reachableforest in Slovenia reached24% becausethereare big forest areaswithout accessroads. The road density ismoreregular in Italy and soareconsequently roaddistances.
IDRISI modelhada problem that will becorrectedin the futurebecause what is farer than1000 m it is consideredto beskiddedby tractor even if thereare no roads (seealsofigure3.6.2.2.a). In Slovenia is alsostill actualthemanualskidding systemon very steepterrains(by the useof gravity force). Comparing the shareof cablesystemsandoff-roadsystems,the results of bothmodels are similar: in Italy off-roadsystemsandcablehavea proportionof 0.61(29%/46%),in Slovenia theproportion is 0.66 (37%/56%).
Table 3.6.2.2.a: Comparingmodelsoutputcell by cell (only forestarea)ITALY
(ArcMap40mGRID cell)SLOVENIA
(ArcMap 40mGRID cell)SLOVENIA
(IDRISI 25mGRID cell)system cells(for.) % system cells(for.) % system cells
Costs of skiddingoperations arehighly influencedby theyield density insidestandsandbysystems productivities.Thechoiceof systemsinsidea forestshould alsobedonetrying tooptimizetheoperations reducing all costs.Comparingcost calculation resultsof the two models, thereare some differencesdue todifferent ways of estimatinghourly costs. Machinecostsin Slovenia areprobablydifferentthan thosein Italy, that is why averagecostsper stand may bequite different. Eachmodeluseditsown productivity functionsand costs (table3.6.2.2.b).
150
Figure 3.6.2.2.a:Forest standn. 26607 hasno accessroads. The nearest road is on thesouthdirection.ArcMap model suggesttheuseof sledgeyarder(brown color) up to 900m; IDRISI suggesttheuseof tractor even if slope is quite steep(greencolor). Skiddingcostsconsequentlyincreasebecausetractor haslow productivities and longerskiddingtimesthan a cablesystemin suchasituation.
As shownin figure3.6.2.2.b, average skidding costshavedifferent valueson sameforeststands.Therearealsosomevery high values (figure 3.6.2.2.c) that could not beexplained(ArcMap modelhasno more than45 €/m3 as averageextractioncosts,that is feasible evenon worst working situation, considering cutting costs and wood price), while values= 0correspond on those stands which are not expected to be harvested during the forestassessmentalplan period. The share of systemsandcost calculation assumptions influencethe result averagecosts: the FOpPmodel estimation is 1.6 €/m3 cheaperthan the IDRISIsolution.
151
Figure 3.6.2.2.b:model resultson stand n. 27192. The terrain has an uniform hillsidefrom north to southwherethereis a forestroad(the red line). Steepslopeis morethan35%. The FOpPsolution suggestthe useof cablecranesup to 900 m from road, whileIDRISI suggestthemanual skidding up to 200 m andthencable systemsup to 500m. Ifcuttings will be plannednearthe road, IDRISI solution might be acceptable, if not, theuseof sledgeyarderwill be theonly way to skid wood.Theuseof tractor on theuppersideof thestand(asIDRISI shows) isquite non-sense.
IDRISI average costsCut/skidding costs ARCMAPARCMAP average costs
23.4
21.8
Figure 3.6.2.2.c:graphcomparing IDRISI vs FOpPaveragecosts (€/m3) at forest standlevel onSlovenianside.
152
Costs differencesat foreststandlevel are quite betterlevelledwhenconsideringaveragesat“ road basin” level (the roadsiteswherewood is piled beforeits transportation to the mill,the cost includesalsocutting operations). IDRISI model giveson average0.8 €/m3 highercosts than ArcMap model (figure 3.6.2.2.d). Source points costs coming from modeloutputsare very similar andnearto reality. Comparing ArcMap results on differentstatesides, Italian operationsare6.3 € more expensive than Slovenian (figure 3.6.2.2.d) due todifferent shareof systemsasshowedon table 3.6.2.2.a.
Comparing total costs at Source points
0,00
10,00
20,00
30,00
40,00
50,00
60,00
70,00
45005000
55006000
65007000
75008000
85009000
950010000
10500
11000
Source point (ID n°)
To
tala
vera
ge
cost
(cu
t+sk
id)
€(/m
3)
ITA sources (ARCMAP) SLO sources (IDRISI) SLO sources (ARCMAP)
ITA average cost SLO av. cost (IDRISI) SLO av. cost (ARCMAP)
27.221.9
22.7
ITALY SLOVENIA
Figure 3.6.2.2.d:Graph comparing IDRISI vs FOpP averagecosts (€/m3) at road sidepiling places.
3.7. MODEL EVALUA TION
The objective of the model evaluation was to investigate how parameters influence theresults. Between all inputs, the extraction distance is the most important because itdetermines the feasible working areaof eachskidding systemandalso the productivities,and consequentlycosts,in the optimizationprocedure.Otherparametersastheproductivityformulas, the gradeabilityslopes or the maximum terrain roughness are thought to beconstantinside astudyareawhere fieldstudieshavebeenconductedon purpose.The effects of changingextraction distance were testedverifying the variation in thereachableareaof systems,the technicaland optimal share of systemsandthe variation ofaverageandtotal standskiddingcosts.Running the defining skidding systems part of the FOpP model, tractor, forwarder andtower cablesystemshavebeentestedchanging extraction distancefrom 100 to 600 meters
153
and considering equal the downhill and the uphill distance. The first part of the modeldeterminessystemsmapson thebasisof maximumslopesandsystemsgradeability,whilethe terrainroughnessis not takenin count (only on thenext optimizing systems and costs).Comparingthetotal surface of each system,themobile towercoversa largerareafollowedby the forwarderandthenby tractor.This depends probably on theslopesdistribution andon theroadnetworkwhich influencemuchmore the tractor thantheother two systems.Thedatacorrelation with a logarithmic trend is very high (figure 3.7.a) and it is interestingtonotice that at the sameextractiondistancethe downhill direction is easier than the uphilldirectionwhichcoversabout onethird of eachfeasiblesystemareas.
Theeffect of extractiondistancewastestedon thetechnical andoptimal output maps.Theevaluationon thetechnical mapwasperformedby modifying theextraction distance oftractor between50 and 500 m and considering fixed the other systemsdistance.Resultsshow that the tractor working area increaseswith the samelogarithmic trend than figure3.7.a but the sledgeyarder and the cable-forwarder systemsare not influencedby thisvariation(figure3.7.band3.7.d). The evaluation on the optimized systemmapwasperformedmodifying at the same timeforwarderand tower extractiondistances.Results (figure 3.7.c and 3.7.e) show that thetractoris substituted by forwarderif theextraction distanceis farer than200m. Themobiletower area increasesvery slowly becauseforwarder and sledgeyarderare cheaperwhenworking at longdistanceswith low cutting amount.Comparing figure 3.7.d and 3.7e it is clear that the technical evaluation shows a welldistributed shareof all systemsaccording to their technical limits while the optimizedoutputmapsuggests theuseof thecheapest systems.
154
Inflluence of distance on technical systems distribution
1
10
100
1000
10000
Tractor max skidding distance (m)
Fea
sib
lear
ea(h
a) tower
sledge
forwarder
cable-f
tractor
tower 2254,132250,882243,252238,812237,002237,00
sledge 579,13 579,13 579,13 579,13 579,13 579,13
forwarder 76,44 71,13 61,00 58,25 54,63 51,50
cable-f 13,88 13,88 13,88 13,88 13,88 13,88
tractor 13,69 22,25 40,00 47,19 52,63 55,75
50 100 200 300 400 500
Influence of distance on optimal systems distribution
1
10
100
1000
Forwarder and tower max distance (m)
Fea
sib
lear
ea(h
a)
cable-f
sledge
forwarder
tower
tractor
cable-f 73,94 58,00 31,44 24,63 24,63 24,63
sledge 122,81 105,00 74,81 60,38 57,81 56,50
forwarder 54,38 88,13 144,88 169,75 176,25 182,00
tower 17,88 17,94 18,56 18,56 18,94 19,38
tractor 2,19 2,19 2,19 0,00 0,00 0,00
50 100 200 300 350 400
Figure 3.7.b: effects of variation of tractorextraction distance on the technical outputmap
Figure 3.7.c: effects of variation offorwarder and tower extraction distanceontheoptimizedsystemsoutput map
Figure 3.7.d: the technical output mapobtained with 500 m tractor extractiondistance. Blue stands are consideredin thecostsevaluation
Figure 3.7.e: the optimized systemsoutputmap obtained with 200 m forwarder andtower extraction distance. Blue standsareconsidered in thecostsevaluation
The variationof average skidding cost per cubic meter andtotal skiddingcostsper foreststand was tested.Four stands were chosen becauseof their different shareof systems,distributionof slopesandallowedcuttingamount (between0,82 m3/cell, standn° 231,and2.25 m3/cell, stand230).Costswere summarizedper eachstandtesting thetractor distancebetween50 and500m for thetechnicalcostsandthe forwarderand tower systemsbetween50 and 400 m for the optimized costs (figure 3.7.f and 3.7.g). Resultsshow that thevariationof thetractor extraction distancehaslow impacton theaveragecosts basedon thetechnicalsystemsmap (figure 3.7.h). Also thesumof skidding costspereachforeststandisquite constant(figure 3.7.i). Correlationvalue is quite high so we could say that tractorextraction distancehasno influenceon technical unit costs. Stand229 haslower costs(2€/m3 less) dueto thelow averageslopeandthelargeuseof forwarder.
155
Figure 3.7.f: the unit costs based on thetechnicalsystemsmap
Figure 3.7.g: the unit costs basedon theoptimal systemsmap
Influence of distance on average costs
R2 = 0,89
R2 = 0,88
R2 = 0,86
R2 = 0,64
8
9
10
11
12
13
14
0 100 200 300 400 500 600
Tractor max distance (m)
€S
kid
din
g c
ost
s (
/m3 )
228
229
230
231
Foreststand
Influence of distance on average costs
R2 = 0,98
R2 = 0,95
R2 = 0,96
R2 = 0,94
8
9
10
11
12
13
0 100 200 300 400 500
Forwarder and tower max distance (m)
€S
kid
din
g c
ost
s (
/m3 )
228
229
230
231
Foreststand
Figure 3.7.h: variation of average skiddingcostsaccordingto tractor extraction distance
Figure 3.7.i: variation of averageskiddingcosts according to forwarder and towerextraction distance
Total forest stand skidding costs
R2 = 0,67
R2 = 0,89
R2 = 0,39
R2 = 0,76
2000
2500
3000
3500
4000
4500
5000
5500
6000
6500
0 100 200 300 400 500 60
Tractor max distance (m)
€S
kid
din
g c
ost
s (
/m3 )
Total forest stand skidding costs
R2 = 0,86
R2 = 0,80
R2 = 0,79
R2 = 0,90
2000
2500
3000
3500
4000
4500
5000
5500
6000
6500
0 100 200 300 400 500
Forwarder and tower max distance (m)
€S
kid
din
g c
ost
s (
/m3 )
228
229
230
231
Foreststand
Figure 3.7.l: variation of total skidding costsaccordingto tractorextractiondistance
Figure 3.7.m: variation of total skiddingcosts according to forwarder and towerextractiondistance
156
Total costs dependon the stand area, stands228/230 and229/231 havesimilar areas,butstand 229 has lower total skidding costsbecausewood can be easily skidded with theforwarderwhichhaslower costs thancable systems.The influenceof the extraction distanceon the optimized costsis more evident (figure3.7.i). Average costsdecreasefirst rapidly, then slowly (the logarithmic correlationhashigh statisticalvalue),influencedby theshareof forwarderandtoweryarderwhich arethecheapest systems. Costsdecreaseof about 2 €/m3 when extraction distanceis more than300 m. Total stand skidding costs vary at a different rate (figure 3.7.m) when theoptimizationdoesnot changethe shareof systemsinsidethestand:this happenswhentheaverageslopeis high or flat (stands228and 230), in fact cablesystemsor off-roadsystemswill be selectedas optimal skidding systemsevenif the extraction distanceparameterismodified. The results highlight how a goodsystemchoice, whenthe roadinfrastructure isnot adequate,coulddecreaseutilizationcostsandsoincreasethewood value.
157
4. RESULTS
The model output resultsare grid mapsand database tables. The skidding systems mapsoffer goodinformation to the foresterwho hasto makeassessmental plansandmayalso beusedto evaluatetheroadnetwork.
4.1.MODEL OUTPUTS
The ForestOperationsPlanning model provides severaloutput maps which by definitionare spatially referenced. These mapscanbeusedand interpretedby theforester who makesa planningto chosewhich skidding system would be the most convenientinside a welldefined area.This is the meaning of a Spatial Decision Support System,in this casetheFOpP model is a tool that allow to select the extraction systems. Here five skiddingmethodsareconsidered,three of themareground-basedand two arecable-based.Outputmaps providesomesolutionson a cell -by-cell basis,but asit is on thereal li fe, theyshouldbe appliedwith consciousness.It is clearthata forestenterprisecannot own all systems,sothe plannedcuttings insidea foreststandwill becut andskidded with only onesystem(ortwo). The forester hasto usethe outputsas a suggestion(a real “support”), but he willtake the final decision thatshouldbedonealsotakingcount of thelocalenterprisesandoftheir skill andownedmachines.Another possibility for the planneris to definetheyield onan areawhich do not correspond to a single foreststand, for example on a smaller part oron several standstrying to conciliate both ecologicalan sylvicultural needswith technicallimits. Moreover,the output cost maps allow the forester to estimate the wood standingprice (called “macchiatico”) and could be usedfor dimensioning the yield by optimizingthe enterpriseincome. If the forester makes a good planning and cuttings provide aneconomicalgain,hemight besurethathiswork wil l besuccessful.Themodelhasno limit in thesizeof thearea,but therunning time is influencedby thecellsize. For exampletheevaluation of theGreekcase(§ 3.6.2.1)tookabout 20 minutesbut theDEM in use had70 m cell resolution. The running time for the Slovenian caseandfor theAsiagoforest tookabout 45-50 minutes:thefirst area (§ 3.6.2.2) was1450km2 with a 40 mcell sizewhile theAsiagoforestwasabout 50km2 with a25m cell size(figure4.1.a).
The tractorwith winch is theskiddingsystem which hasthe strongesttechnicallimits andfor this reason its working areais smallerif comparedto that of theother systems. Outputmaps show that the downhill skidding direction is preferredwhen the terrain is smooth,plain and highly stable. On figure 4.1.b (Asiago area),roadsare sited on valleys so thedownhill direction is mostly prevailing. On the Friuli-VeneziaGiulia study arearoadsaresited both on the valley bottom and on the mountains ridge and shouldersso the uphillskidding directionis more spread.On figure4.1.c it is also possible to notice insidetheredrectangle thedifferentskidding distancebetweentheuphill andthedownhill direction.The forwarderhasa higher mobility than the tractor due to its six or eight traction wheelsand the height from the ground which allow the machineto work evenon rough surfaces(roughnessclassn. 2). If theaverage slopeis not so high it caneasily work evenon steeperterrainsmovingon easypaths and usingthe boom:on figure 4.1.dthe forwardercoveranarea two timesbigger thanthe tractor areaon figure 4.1.c.. This is also evidentwhen the
159
maps are overlaid as on figure 4.1.e. Considering that forwarderhas a high productivity,three timesmorethantractor,and hourly costs areonly two timesmore,its useshouldbeincreased. Safetyof operators would beimprovedindeed.
Figure 4.1.b: the tractor map on theAsiagoforestarea
When helpedwith a rear winch included on the forwarder frame it becomea so calledcable-forwarder.Thetechnical limi t of themachine is thedistancefrom roadthat is limited
160
to the cable length. Having the slope litt le importance,the skidding area is similar to abuffer of theforestroads(figure 4.1.f). If we considerforwarderandcable-forwarderasanuniquemachinewe could skid wood from almost all the forest areawith slopeunder 70%,ason figure4.1.g.
The evaluation of skidding mapsfor cable cranesystemsconsiders, also on a cell-by-cellbasis, the averageslope betweeneachpoint and the nearestroad.Cable systemsrequire aminimum slopeto allow the systemworking. If the slope is too low, hereconsideredlessthan 15%, the carriagemay incur into two differentproblems, the first is that the gravityforcehasnot enoughpower to pushthe load down andthe second is that near the endofspansthe carriagecould not passthe jack or it could causethe falling of the rope from itssaddle.Output mapshavethreedifferentvalues,one is the skidding uphill area,which isrequireda two ropessystems(mostusedin Italy), the second value is the downhill area,where three ropes systemswork better, and a third value where the wood would bereachablebut theaverage slopeis lessthantheminimum (figure 4.1.h).Watching thesameresultson a 3D scene(figure 4.1.i) it is clear that some areasare too flat for the cablesystems andit is clearthatotherground systemswill work there.Oneexample on how theforesterhasto interpretresultsis shownon figure 4.1.i: in the centreof thefigure therearetwo parallel roadsand the skidding direction is for a half uphill and for the other halfdownhill. This result is due to a model running tool that calculatesthe shortestdistancefrom each grid point to the nearestroad(Path Distance Allocation). The distance betweenthe two roadsis more or less200 m, but any enterprise will neverskid half wood on onedirection and half on the other. Knowing that the two ropessystems are most spreadinItaly, theforesterwil l plan theuseof suchmobile tower craneskiddinguphill to thehighest
161
roadwereprobablyhe will needtoo plana goodplacewereinstalling thetower yarderandhaveenoughspaceto allow piling logs.
Figure 4.1.i: 3D sceneof mobile cablesystemsskiddingmap
More or lessthe sameevaluation is done for the bigger cable cranes systemswhich areusuallymountedona sledge.On figure4.1.j feasibleareasarewell linkedto forest roads.
Figure 4.1.j: 3D sceneof sledgeyarders, redareas are feasible (shadows identify ridges),yellows hasnot enoughsteepslope
Figure 4.1.k: sledgeyarder and toweryarder mapsoverlay
A better evaluationof working areascould be doneby using an hydrologicaltool calledwatershed which identify the samefalling rain direction on a mountain shoulder and ithelpstheforesterto seemountainedges. In fact thesledgeyarder systemmay work on long
162
distances but it cannot go up and down over mountainsasshownon figure 3.5.4.1.l.Thesledgeyarderminimum slopewassetto 20% andthemaximum distance up to 900 m. Byoverlaying the results with the tower yarder map (figure 4.1.k) the “no slope” areascoincide.Thereareonly someareaswhereoneof thetwo systemsis excluded:wheresteepslope is between 15 and20% canwork only the tower yarderandfarer than300 m whereonly the sledgeyardercanwork. Figure 4.1.k showsvery few areasthat arenot reachableby cablecranessotheroadnetwork could beconsideredasprettygood.
The secondpart of the FOpPmodelmakesfirst a selection of systemsby technical limitsand after the selectionis done by optimizing costs. On the technical selectionall systemsare shownin the output map becausethey are selected by an importancecriterion whichconsiderssystems on the basisof their presence on the areaand their importance.Theskidding systemsmapsareoverlaidin this order,fi rst tractor, thentower yarder,forwarder,sledgeyarderandcable-forwarder (figure 4.1.l). Theevaluation of costsby cell is basedonthe productivity and unit costsof systemsand the total amount of yield inside eachgridcell. Valuesmay reachveryhighvaluesinside thosestand with high amount of wood,asonfigure4.1.m.It is possible to observethat the evaluation of costs per cell is not so highlyinfluencedby thechoiceof systemsthanby thestandcuttingvolume.
Figure 4.1.l: the technical systems outputmap
Figure 4.1.m: the technical costsevaluation map
The systemoptimizationpart of the FOpP model usesan algorithm to evaluatesystemsproductivities according to the distance betweenthe extraction cell and the nearest forestroad. In fact skidding operations last longer if they are done far from road: the time formoving both the machine and the carriage increasewith distance. Productivities andconsequentlycosts increaseasshown on figure 4.1.n and4.1.o. In the case of the sledgeyarder, costs are classified into categoriesto highlight the cost gradientand it is also
163
possibleto noticehow thestand yield is influencing theresults (inside the light greenarea,the yield is plannedto be11m3/ha).
Theoptimalskiddingsystemsmap(figure 4.1.p) is obtained by overlaying all optimal costssystems map andselecting the onewhich has the lower cost. This map canbe comparedwith thetechnicalsystemmap(figure 4.1.l or figures3.5.4.2.dand3.5.4.2.h); what is clearis that thetractordisappearleaving place to moreproductive systemsasthe forwarder. Thechoice betweencablecranesystemsdependson the amount of wood inside stands:if theyield is low, the sledgeyarder is more convenient even better on large areasand bigdistances, if the yield is concentratedthe tower yarderis moreproductive andmay workfaster with lower unit costs.Total costs per cell (figure 4.1.q) decrease if comparedtofigure4.1.m,andinside the sameforeststandit is possible to seea sort of gradient wherecostsincreasewith thedistancefrom roads.Costs per cubic meterarehighly influencedby the choiceof skidding systems:on figure4.1.r costs arecalculatedstarting fromthe technicalcost mapwhile on figure4.1.scostsareobtained from the optimal costsmap.The results show that optimizedcostsarein generallower thantechnicalcosts,asonecouldexpect, but theoptimal systemmapis not nearthereality becauseit exclude the useof the tractor. The technicalmapgivesbetter support tothe forester who hasto takedecisions evenif sometimesforestenterprisesbuywood duringpublic auctionsandthe foresterhasnothing to do.
The FOpPmodelmay beusedby the foresteras a tool to identify areaswhereto cut treeswith high or low cost,so thathecouldestimate themarginal profit that is calculatedasthedifferencebetweenwood salespriceand operational cost. This consideration couldbedonefor the first yearsof planning anduseddefining cuttingsaccording to the current marketvalue of wood. In fact it would be convenient to cut and skid wood from placeswhereoperationsareexpensive while thewood valueis high. If cuttings aredoneon easyforestedareasand the wood value will decreasein the future, only expensive areas are left and
165
operations could not provide any income.The risk is that yield is not cut for economicalreasonsand theenvironmentalandecological aimsof planningarenotsatisfied.
4.2.ROADS
Theclassification of roads into threediff erentcategorieshelp the manager in planningthemaintenanceand the improvement of the existing road network. Only by a simpleoverlaying of forest standsand roadsinput fi le it is possible to evaluatea sort of roadpermeability to truck transport (figure 4.2.a). A good parameter which describes thispermeability is the road density that can be easily calculated dividing the sum of roadlengthsby thesumof forestedarea. Theobtainedvalue in m/hamay becomparedto otherareasor countries. On the Italian Alpine areathe road density variesfrom 15 to 27 m/ha,but in Austriaor Switzerlandthisvalueis near 40 m/ha.Theroaddensity should beadaptedto the forest functions (productive,protective or tourist) and to the meanterrainslope,infact skidding operations on flat terrains are easiestand off-road systemscan reachfarerdistances from road.On steepterrainsmaybe usedcablesystemsthat do not requirehighroaddensity,but theyrequireat least a good roaddistribution (parallel roads) andfrequentand large piling sites.Theseroad structuresare usually too small to let install both thetower yarderandusea tractoror pile logs for all the working site lasting time. Moreoverthey are insufficient for the use of truck-mounted processors (Gebirgsharvester) or forsetting biomassharvestingsiteswhich needplaceto park the chipping machineand thetrailerwhichstoresthematerial.
Figure 4.2.b: the forest accessibility and itsclassification. Areasin redarenot reachable.
The FOpPmodelresults highlight the areasthat arenot reachable by any of the selectedskidding system(figure 4.2.b). This mapis a goodstarting point for planningthe building
166
of new roads. A well planned roadshould beuseful for asmuchpossible forest standsandit should try to reachall theareaif it is a productive forest.Assaidbefore, theroad densityis a goodparameter that should help the foresterin drawinga road track. Using the GISsoftwareit is not easyto evaluatethis value becauseit refersto a specific areaand if thisarea is bigger,the obtainedvaluemay change(asshown in figure 4.2.c). A suggestiontoevaluateroaddensity is to considera group of foreststands, for example all standslyingonthe samevalley or on the samemountain shoulder, with the sameexposition or with thesame assessmentalneeds.Then the forester could comparethesegroups and highlightwhere new roads are needed(example on figure 4.2.d). Building and constructionparameterswill be set according to the geographyand geology (for examplethe averageslope, the width, the road section,ditchesor other rain catchments)andto the roadtransitdestination (truck, tractor or public transit) andfunctions(forestaccess, wildfire protectionor tourist).
Figure 4.2.c: the roaddensityvary accordingto the sizeof the areaconsidered.On theleft only oneforesttypologyis consideredwith 29.7 m/ha;on the right side a biggerareaisconsideredhaving33.3 m/ha.
The cuttingamountand the estimated costsmay be used for a roadnetwork analysis.It ispossibleto quantify how muchwood wil l be skidded to eachroadsection in the next tenyears of forestassessmentby creatinga sort of roadcatchmentsareas(similar to theideaofhydraulic basins). The total amountof wood is summedandcan be showedas on figure4.2.ewherethesymbolthicknessis increasing togetherwith theamount of wood.This is animportant informationbecausethe forester will havean ideaof how muchspacefor pilingwood will be required and might estimatethe future road transit. Heavy truck trafficcausesthe road surfaceerosion together with rain so, making this analysis,it will bepossible to classify roads by importanceand have a rough estimation of maintenanceneeds and costs (KRČ 2006).
167
Figure 4.2.d: anexampleon how grouping foreststandandcalculatingroaddensitymaybe helpful to highlight areaswhich needmoreroads. Inside greenandyellow areastheroaddensity is 31.9 and 32.1 m/hawhile inside red areas,which are productive forestwith very high stockand plannedyield, the value is only 18 m/ha. Planning new roadsinsidethis areashouldbedone.
Figure4.2.e:thewoodandcosts allocation to forestroadsections
Figure4.2.eshowsalsotheaverageskidding costsas labelsof eachroadsection.This valuein strictly connectedto the shape and distribution of road network and can be used toevaluatetheeffectof a new plannedroad.Moreoverit is a developing ideato usetheFOpP
168
model resultsto evaluateand give an objective evaluation of eachnew roadproject insidethe “Feltrina” Mountain Community in Venetoregion. Theideais to give someparametersthat haveto be improved by eachnew project asfor examplethe increaseof roaddensity,provide accessto severalstands and/or properties and to analyzehow skidding costs areinfluenced by introducing a new road.This is possible running the model two times, thefirst beforeandthesecondafter theintroduction of thenewroad.Result maps of costswillchange showing probably decreasingcosts (figure 4.2.f and 4.2.g). The decreasingofskiddingcostsmeansthat thestandingwoodvaluewill increase(if themarket sellingvalueis fixed) andit will bepossibleto estimate the total gain that canbesubtractedby theroadbuilding costs or usedby theRegion asparameterto judgetheprojectandprovide funds.
Table 4.2.a: influence of building anew road: comparingskidding costsand estimation of total gain (woodvalueincrement)Standn°
Figure 4.2.g: the evaluation of skidding costs (labels)and standing wood value afterbuilding a newforestroad (inside thecircle).
169
5. DISCUSSIONS
5.1.ECOLOGICAL AND FORESTHARVESTING PLANNING
The forest assessment is required in Italy for all the public properties and it isrecommendedinside all other private and associatedproperties. The aim of planninghastwo faces, thefirst is to guaranteea sustainable and environmentally sound management offorests,the secondis to allow the owner to have an economical income by cutting andselling wood. Forestshave several functions, but until now only the productivefunctionprovided someinterestingmoney. The other functions are now gaining more and moreimportancebut theyarenot well paid(it is also quite diffi cult to estimate their value)asforexample the function of carbon sink, the tourist (including hunting and harvestingsmallfruits) and maintainingbiodiversityfunctions.By Europeanlaw, someforestsareimportantfor thehabitatandthespecies(mostly vegetablesand birds)which areliving inside.Othersensitive forestsare those locatedon wet areasor near the water catchmentsfor humanpurposes.Planning should take count of all functions and provide “instructions” for theusersto maintainforestsalways at thesamelevel without provokingdamagesor decreasingof value (HEINIM ANN 1994). The FOpP model is a helpful tool to help the forester inevaluatingthe accessibil ity of forestandmake easierthe definition of the forest function.Themodel canbeusedalsoto decide if a foreststandhasto becut or if it hasnot enoughwood stock to make operationseconomical. Money are the main factor to make theplanning operative.Insideproductiveforests, theplannedyield should bewell quantified tomakehappy both the owner who sells the wood andthe forestenterprisewhich cut it andsell it to sawmills. Each stepof thesellingchain add somevalueto the material, in thecaseof the enterprisetheincomeis strictly connectedto the operationalcosts.Themodelresultsmaps may help the forester estimatingthe averageskidding costs insideeachforeststandand sodefiningthestanding valueof wood (by subtracting operationalcostsfrom thewoodmarket value).Insidestands with protection or tourist functions, cuttings areusuallydoneon small areasandsmall quantities, so theeconomic gain is usually negative. This kind ofmanagement is usuallyfundedby theRegionthroughthe forest servicesor should bedoneby inhabitantsfor their civil rights(a yearly amountof woodfor heating purposes).A simplemethodto determine the minimumsizeof plannedyield wasdefined(LUBELLO et
al. 2007). It is basedon a well know economicprocedure called break-even analysis(POLLI NI 1983) which identify the value where incomeand fixed costs are equal.In theforestrysector fixed costscanbe divided into two categories,the machine fixed costsandthe administrative costs(including taxes for buying wood and working site relatedcostslike translocation or mountingand dismounting). From the algebraicpoint of view, thecondition to determine thebreak-evenis:
The obtainedvalueis the minimum amount of wood that allow the enterprise to coverallfixed costs,but somemore money are needed to makecutting interesting. This is calledenterpriseincome(udi) andit is calculatedasa percentageof thewoodvalue at roadside.Theforesterhasto preparea table (table 5.1.a)of coststo determinetheminimumyield. Heneeds the standingwood value, the value at road side, machine’s unit costs (which areplannedto be used,considering for example the FOpP output maps)and an estimatedenterprise income. By subtracting all cost voices from the road side wood value, theresidualincomeis obtained(RUN) andtotal fixedcostsaredividedby it.
Table 5.1.a: exampleof costelementsandcalculation of theminimum yieldcosts unit formula
It is possibleto draw on a graphhow the minimum yield valueschangeby modifying theinput parameters. If the wood value at road side is fixed, the minimum yield increasetogetherwith thestanding woodvalue.If theenterpriseincomeis decreasing, thestandingvaluemay increase(figure 5.1.a) andvice versa.The forester mayuseestimated values orknown marketprices.This method is alsousefulfor theentrepreneurwho participateto anauctionbecause,on thebasisof theincomehewants to reach,he may knowwhichstanding
171
valuehasto offer. For example, paying a standingprice of 49 € and estimating a 15% of enterprisegain,on thebaseof figure 5.1.a, theminimum size of cutting should be182m3.If the cutting is alreadyfixedto 1000m3 and theentrepreneurwants anincomeof 35%,hisoffer shouldnotbemore than40€.By fixing the enterprise income, the minimum yield decreasewith the increasingofstandingandroadside value(figure 5.1.b). Fromthegraph it is possible to seethatbuyingstanding wood at 40 €/m3 and selling it at about70 €/m3, the minimum yield should be atleast 1000 m3. On the opposite,knowing that 500 m3 have beenboughtat 35 €/m3 theselling priceshouldbemorethan68€/m3.
0
500
1000
1500
2000
2500
25 30 35 40 45 50
€Standing wood value ( /m 3)
Min
imu
myi
eld
size
(m3 )
15%20%25%30%35%40%
€road side value: 80 /m3
INCOME
INCOME INCREASING
STANDING VALUE DECREASING
0
500
1000
1500
2000
2500
65 70 75 80 85 90
€Road side value ( /m3)
Min
imu
myi
eld
size
(m3 )
253035404550
enterprise income 25%
STANDINGVALUE
Figure 5.1.a:the variationof yield according tostandingvalueandenterpriseincome.
Figure 5.1.b: the variation of yieldaccording to road side and standingvalue.
Theminimum yield is influencedby themachine’s unit costs but alsoby theadministrativefixed costs. In particular the working site costs may have important variations whenconsidering a simple tractor or the translocation of huge machines like harvester andforwarder.These machines requirea special transport with specialtrucks which require adriving permission becauseof the outsizedimensions. Even themounting anddismountingoperations for a cable systemsmay take several days and all these costs should beconsidered.Moreover, when the working site is far from home, also the costsfor sleepingand eating of workersshould beconsidered.Table 5.1.b shows the yield calculation for different util ization systems: whereadministrativecosts arehigh, eventheyield is high becausemorewood is required to coverall fixed costs. It is possibleto notice that the yield amount increasewith the increasing ofthe mechanizationlevel. The chipper evaluation considers a low standing price becausesuch operations are done on first thinnings and are usually funded by the Region; theenterpriseincomeof 15%guarantees10€ income per eachtonproduced.
172
Table 5.1.b: yield calculation for differentutil ization systems.
€/t €/t % € €/t t Firewoodfrom coppicewith p-hdslides
25 11,74 25 1500 120 26
After generalplanning, and before starting the working site, it is important to make aprecise planning. This means to identify in which period of the year cuttings have to bedone to preventsoil and tree damages or animals disturb, but also designoperations inorder to highlight theneedof maintain forestroadsor re-opena skidtrail. Thereareseveralelementsthatshouldbeconsidered,for example:A) thetranslocation of machinesto theworking site andtheneedof space.A sledgeyarderwould needthehelpof a helicopterwhenthere areno roads or a tower crane would needabig siteto beinstalledandhaveenoughspacefor pilingwoodB) the time to reachthe working siteandthe time operatorsmayneed to reachthe cuttingareainsideforest(for example it wasmeasuredfor a sledgeyarder site,wherethemachinewas installed uphill and the skidding direction was downhill to the unique road, that theyarderoperator needed55 minutes walking to reachthe yardersited 400 m uphill). Thistime is anonproductive timeand mustbeconsideredestimating thesiteoperationduration.C) thepossibility of having rainydaysor respecttheworkersright of askingsomehours ordaysof resting.D) theoperatingsitethat couldberisky for steepslopeor instable ground.E) the definition of skiddingsystemandthe width of cablecorridor. For examplethe fulltree or the short wood systemmay be done according to the site characteristics. The FTextraction needa big site where piling and working wood (delimbing andbucking) by theuseof chainsawor processor.TheSWSis helpful whenthereis small placeat roadside orwhenworkingwith firewood. It wasdemonstrated(ZANONI 2007) on thesamecorridor thatskidding piecesof wood (2 m long) tied togetherinto 1 ton logs makesin average1.2tons/hour moreproductive the cable system(figure 5.1.c). Obviously this operation is timeconsuming andcutting may last some daysmore. It could be a goodsolution if the pilingsite is small or if at the sametime anothercrew is occupied in preparingthe corridor andmountingtheline.
173
Time for each carriage run
0
5
10
15
20
25
30
35
0 100 200 300 400 500 600 700Distance (m)
Tim
e(m
in)
Full tree
SWS
Figure 5.1.c: the time influence of full tree and SWSextractionsystemon the samecable line
Figure 5.1.d: a pictureofthecorridor
A projectof TrentoProvince studied costs linked to fi rewood extraction. Results showedthat times, productivitiesand costsare strictly connectedto the working site geography,neverthelessa list price was built making averagesof severalstudied cable cranes(table5.1.c). The voice “other costs” can be quite high if all points mentioned above are notfavorable;the skidding costsare lower if comparing private enterprises and the publicservice(forestservices have their own crew andmachines)due to lower interestratesandfixed costs. So the forest service may work on more difficul t terrain with lower costs,providing inhabitants of their firewood rights and preventing the abandonmentof forestsand thewood import from otherEuropeancountries.
The nature and real life in generalis too muchcomplicate to be well represented by anymodel, so even if the Forest Operation Planning model is quite intricate and considersdifferent parameters,it is not perfectandmightbeimprovedin thefuture.One of the most interestingthings that are being developing is the application of a newintegrated system called LIDAR which usesboth GPSpositioning and Laserscanner togatherterrain information (figure 5.2.a). The system is capable to catchseveralpoints onthe same verticalposition andsave their xyz values;the points densityis usually more than1 per squaremeter,but could be more,with the only limitation of the file size that canbehandledby GIS systems(the kriging geostatistical tool hassome problemsworking withfiles with morethanonemillion points) andfor its storageplacesize (the Trento provincefile is about 150Gigabites).Points maybedividedinto terrainandvegetation points(figure5.2.b) and interpolatedobtaining a very precise Digital Terrain Model (the precisioncanreach0.2-0.5 m, figure 5.2.c) or a sort of vegetation canopy (figure 5.2.d). This preciseDEM could be usedin the future running the model on small areas.The Lidar data couldprovidealso a moreprecise rasterof terrain roughnessand/orknowing theforesttypologiesand merginginformation with the Lidar canopy (which provide density andheight of trees)amorepreciserasterof stockand yield could beobtained.
The FOpPmodelworks on a cell-by-cell basis, but one lack of the input files wasthat allinformationwerereferredto the foreststand(figure 5.2.e). Standmaybe very big, severalhectaressized,andthe datacould be so quite rough. In the future the input datacould begatheredthrough ad hoc surveys or defining fixed small surveys areaswere terrainclassification and standing tree information could be collected. Using suchprecise inputrasters, the model shouldrun better and provide more precise results. Figure 5.2.f showshow the input fi les should be created.These information could be gatheredby the foresterwhen he makesthe forest planning and could be updatesevery ten years.The foresteralreadydo surveys on plot areasandwe think that making morepreciseobservationsandsaving this datashould not be so highly time consumingif compared to the quality ofinformationobtained.
Figure 5.2.c: comparing DEM with 10 m, 5 m, 1m and 0.5 m precision. Increasingprecisionit is possibleto seeclearlyforestroadsandmicro-scalegeography(TAROLLI andDALLA FONTANA 2007).
Figure 5.2.d:a 3D sceneof terrainandvegetation from Lidar data(TAROLLI and DALLA
FONTANA 2007,CAVALLI et al. 2007).
176
Figure 5.2.e: anexample of terrainroughness or stock information,onevaluepereachforeststand
Figure5.2.f: an exampleon how placing survey points(left) and interpolatedata for a precisestockraster fil e(on theright)
A more preciseevaluation of terraingradeability would include the soil moisture and theCone index measurement.The ConeIndex representthe soil bearingcapacityin kPaandwould bea very goodparameterto evaluatetheaccessibility of forestfor different off -roadsystems. Many referencesshow correlations betweenthe Cone Index and the maximumslope that machinescanclimb without slippage. These formulascould be included insidethemodelandcalculategradeability exactly without matricesor complex rules.The soil moisture is the watercontent of soil which influencesthe off-groundmovementand thesoil bearingcapacity. It is commonthatonwet soils thefrequentmachinespassagescreatemuddyconditions and consequent soil compaction with damagesthat can be seeneven after severalyears.A goodimplementation of themodel would add the possibility tochosethe periodof the year or a monthly evaluation of forestaccessibilit y. Dataasked tothe usercouldbeno more thantheaverage monthly rain frequency. This informationcouldbe referred to the soil typeswhich is known they havedifferent attitudeto maintainwateror not (gravelor well structured soils).Another importantaspectthatherewasnot consideredis thepresenceof streamsandrivers.In a future versionof the model they should be consideredas limi ting factors for the off-groundvehicles.In fact they are a physicalobstacle(if they arelarge enough) andcannotbe crossedby machines,moreovernear their edgesthe soil moisture is higher or on flatterrain it is frequentto find marshesor peat lands.A shapefileof river shouldbe askedtothe useras input fil e andthe modelcouldmakea buffer of it and assignto this areaa verylow gradeability. Then rivers could be used as barriers when the model run the pathdistanceallocation but this will limit alsothe cablesystemsandsomesolutions shouldbefoundto solvenewprogrammingproblems.
177
These are the main possible implementation of the model, but each of them require newinformation to the userand complicate the model functioning. A compromiseshould bedone,if we want the model is usedit should not be too muchcomplicate and require toomanyinputsbecausetheuserwil l notunderstandits functioningand will not founddata,onthe other sidethe model results wil l not be perfect,but shouldbe interpret andusedasanobjective support (this is the aim of Decision Support Models!) for taking operationaldecisions.The Model Builder was a good tool even for building complicate models because itsschematic window makes clear the model structure and when testing it is very easytounderstandwhere areerrors or which toolshavenot functionedproperly.After have testedthe model several times we think that it should be translated into a more stableprogramminglanguageastheVisual Basic for Applicationsthat inside the ArcGis softwareusesthe so call ArcObjects.The VBA language is not so difficult and allow to createamore interactive user window and outputsor reports with predefinedlegends (colors andlabels)which makeresultsmore clearandeasyto understandandapply.
5.3.PRACTICAL PLANNING APPLICATIONS/EXPERIENCES
Planning is importantwhen forest enterprises or land owner associations want to ask forpublic funds. The Rural Developing Plans providemoneyaccording to specificapprovedactions.Oneof theactionsis for examplethetechnical developmentandskill improvementof forestenterprises.Sonewmachineslike harvestersor forwardersor processorsand cablecranes are financed,but their number should be the result of a studied environmentalplanning andpolitic strategies.It should be take in countfor examplethe yearly availablecutting amountthat is necessaryfor the high level forest mechanization to get machinesproductive andthework economically feasible. Forestassociations (both of landownerorenterprises) may assure work continuity and more attention to safety and teachingofworkers.A careful regional planning should provide funds for a well defined number ofmachinesto make them work at higher level and correctly (for the operator safety),thiswouldbethebasisfor asocial andeconomicsustainabledevelopment.On thenexttwo paragraphs two typesof planning arepresented.The first caseis the estimation of the right numberof harvester that could be foundedbyregional politics. The GIS software is used here just to run simple algorithms on ageographicalarea defining a working basin for each machine, optimizing translocationdistances andtotal workingsitecosts.Thesecondis theappli cationof theFOpPmodelonasub-regionalscale. The modelis usedto estimatecuttingandskidding costs,then the wood amount is allocated to roadsideandtransportationcostto the nearestmill arecalculated.The study wasperformedto evaluatestrengthandweaknessof wood chainbetweenStateboundaries.
178
5.3.1. A simple regional-scale application
The Veneto region rural development plan for the next years(2007-2013) defines someactions to developthe forestwork (AA.VV. 2007). The axis n. 1 actions provide fundstoforestenterprisesto buy new technological machineswith the aim of innovate and exploitthe woodchain.It is clear thatnot all theenterprisesmay buy anharvester or a forwarder,becausetherewill not be enough woodto makethemwork properlyandprobably theywillstop with an evidentpublic money wasting. This is the reason for such a regionalscaleplanning.As input datawe usedthe registereddataof all cuttings inside theVeneto region(thanktothe DirezioneForesteed Economia Montanaof Venetoregion) during the years 2004and2005inside bothprivateandpubli c properties. All information havebeengeoreferencedforthe next calculationandanalysis(figure 5.3.1.a). In the year2005, 283246m3 havebeencut insidethe region,64%on privateassessedpropertiesand36%inside private properties.The average amount per working site is 184 m3 for public and 141 m3 for privateproperties,but the medianvalue is lessthan 40, that it meansthat inside more than halfworking sitesno more than40 m3 arecut.This isa very low valuethatcould not justify theuseof high technology machines,and thecostsof their translocation indeed.The present study did not take care of the harvesting head technical limits, like themaximum diameterof debarkingknives,but consideredonly the standslopeasparameterlimiting the machineoff -road movement. We usedthe slope limit at 35% as reported bymany authors (HEINIM ANN et al. 1998; STAMPFER 1999; SPINELLI and STAMPFER 2002).This is not the upper limit for the harvestermobility, but it is a value that should notinfluence its working productivity. With the spatial analyst tool in ArcGIS we createaslope map and we did a zonal statistics to quantify how much of a stand surfacecan bereachedby the machine. The relation betweenaveragestand slope and reachable area isshown on graph(figure 5.3.1.b)(EMER 2005). Theobtainedvalueswere multiplied by thecutting volumeto evaluate the“reachablewood”, calledhereMu.Speakingwith entrepreneurs (CIECH 2006; DECOL 2006) we defined that 400 m3 is theminimum woodamountwhich shouldbecut to coverall variable andtranslocationcostsofthe harvester (M400). We selectedthe working siteswith more than 400 m3 and then wedecidedthat at least2/3 of working siteswil l be cut with the traditional methods (smallenterprises),sowe randomlyreducedthenumberof possible working sitesaccording to theformula:
Mu = 1/3 * ΣM400 (1)After thisevaluationtheaverageamount of woodwas34054 m3, the14%of total cuttings.In the NorthernEurope, it is usually known that the economical yearly cut wood for anharvester would beat least9000-10000 m3. Thesamewould not bepossible in theAlpinemountainssowe definedtheupperlimit at 6000m3 peryear.
179
Figure 5.3.1.a: all cuttings insideVenetoregion in the 2004 and 2005years
With thehelpof GIS tools we started to analyse theworking sitesdistribution first thinkingto only onemachineworking and continuing increasing thenumberof machinesup to fiveinsideall theregion. For eachstepwe calculatedthesumof distancesbetweenthecentreoftheareaandall workingsiteswith theformula:
Da = Σ(2*Di* f) (2)
where Da = sumof distances(km)2*Di = distancebetweeneachworkingsite andthecentreof theareaf = 1.6, conversionfactor to transform straightline distances into real distances(sort of roadcurvy factor)
and alsothetotalamount of wood insideeacharea:
Ma = ΣMi400 (3)
where Ma = cutting woodsum(m3)Mi400 = workingsiteamountwith morethan400m3
Theworking areaswerelocatedtaking carethat thesum of woodamount would besimilarbetweenthem.Thesameprocedure wasdone considering the two yearstogetherandafterthis makinganaverage.Otherusefulinformation werecalculatedas:- thenumberof daysnecessaryto cut all thewood amount insideeacharea:
After theareas optimization, somecostswerecalculatedasthe:averagenetgain Gn (€/m3),theaveragenetgainperworking site(€) and theyearlygainpereacharea(€). Theaveragenetgain(Gn) is obtainedwith thefollowingformula:
Gn = V – (Cab + Ces + Cmc + Cop + Cp) (7)
where: V = averagewood marketvalueat roadside(about 80 €/m3)Cab = felling costs using the harvester, estimated17 €/m3 as calculatedwith theadaptedMIYATA (1980)andBRINKER et al. (2002)methods.Ces = skiddingcostsusingforwarder, estimated6 €/m3
where i = unit costsfor movingmachine with specialtransport truck.Thecosts varyfrom 1.3to 20€/km on thebasisof thedriving distances.
Cop = operatorsliving costs(€/m3). Thinking a daily cost (g) of about35 €, it iscalculated as:
Cop = g / (Ma / Gef) = (g*Gef) / Ma (9)
Cp = averagestandingwoodvalue,about 30€/m3
The average gain per working site (Gc, €) allows to verify if the working sitestranslocationscosts arehigherthanthetotal gain(theconvenience).Theusedformulais:
Gc = Gn· Rm (10)
Theyearlygain is calculatedconsidering if thenumberof necessaryworkingdays (Gef, seeformula n. 4) are more or lessthan the estimated machine working days,here200. Thenumberof workingsiteswill beconsequentlyreducedto adaptit to harvesterproductivity:
Ga = Gc*(c / (Gef / 200))= (Gc*c*200)/ Gef (11)
Results show thatthemaximum number of machineshould not exceedfive becausethereisnot enough cuttingwood. The yield distribution is spreadall over theregional mountainousarea,while thesiteamount is highly variableandinfluencethesizeof workingareas(figure5.3.1.c. On table5.3.1.a, results about cutting volumesareshown. The distribution andthewoodamount persite madequitedifficul t theoptimization of thedifferent areas.We think thattheoptimalnumberof machinesis four.
As final resultswe calculated total costsfor the four areashypothesis. Considering theaverageprice of wood about 80 euros, the net gain per cubic meter(Gc) is alwayshigherthan 24 euros, a 30% that we consider very good.The distribution of yield determine anegative year insidearea4, but the averagedistribution (years2004-2005) allow to fourmachinesaneconomically working. In fact, the averageworking site gain is between4000and 10000 euroswhile the average yearly gain is between47000 and180000 euros. Thismeansthat in theworstcasetheenterprisewill cover thevalueof a newmachinein 5 or 6
183
years, that become 3 or 4 if asking the regional funds. Considering that an harvester,accordingto its use,hasanaveragemachine life of about 4-6 years,andafter this period ithasstill a quite high salvagevalue, the number of four machinesseemsto be optimal toallow asustainabletechnology improvement.
Table 5.3.1.c:costsevaluationin thecaseof four working harvestersyear area Total costs Gc Gn Ga
5.3.2. An interregional approach: ITA-SLO cooperation
Theaim of theresearch was to investigate thedifferencebetween regionalandinterregionalwood chains.This was possibleby determining forest operation and wood transportingrough costsinside Italian and Slovenianstudy area(figure 5.3.2.a). FOpPmodel resultswereusedin order to identify common areaswherewood supply canbe sortedout at thesameeffectivecost from both Italian andSlovenianforest enterprises.After the evaluationof skiddingsystemsandtheir costs (figure 5.3.2.b),thevaluesandtheharvestable wood neededto be shifted (or allocated) to the nearestroad section for theevaluationof roadtransportation to mills.In order to generatewood sources along road network, from each forest road segment(public and forest) a road catchment area was created.Catchment areasrepresent areaswhereeach GRID cell of a continuous surfaceis allocatedto the sameroad segment: itconsiststhus in “moving harvestable wood amount” from eachGRID cell to the closestroad segmentby an Euclidean Allocation (ESRI 2007). Roadsegments presentedthus asum of harvestablewood amount (m3/10y) and its averageforest operations unit cost:cutting, skidding and administrationcost as calculated by S-DSS models. In order todistinguishtransportation from forest to public roadandtransportation alongpublic roadtoterminals(sawmill, heating plant, fibre board mill), a further allocation wasdoneonly forwoodallocatedalongforestroads.This secondproceduremovedwoodfrom forestroadstothenearest crossingpoint wherea forestroadcrosses public road(figure5.3.2.c).
184
Figure5.3.2.a: Study area liesoverthebordersbetween Italy andSlovenia
TransportinganalysisTransporting analysiswas basedon a networking methodology. Network is a systemthroughwhich distribution and transportationof a genericgood occurs.It canbemodelledas a one-dimensionalnon-planar graphor geometric network composedby features, wherenetworkconnectivity is based on geometric coincidence.Themainpurposeof this researchapproach was to evaluate wood transporting costs by a real road network distanceoptimization. The analysisis thus basedon the spatial distribution of wood sources andsinks (terminals)alongroadnetwork.Transporting analysisconsisted in two analysesaccording to the allocation procedureapplied. First calculation consistedon evaluating wood transporting from forest road toroad network crossing points by analysing results on distance allocation results.Consequentlya second calculation was sorted out on transporting wood from sources(crossing point between forest roads and public roads and allocation points along publicroad)to terminals(sinks) by network analysis.Accordingto GIS-basedresultsconcerning the allocated wood from forestroadsto publicroads, the straight line distancebetweenforest road catchments site and public roadcrossing point was as average 607 m for Slovenian areaand 561 m for Italian area(oneway). To define a close to real transportation distance,a coefficient basedon the ratebetweenaverageslopeof forestareaand maximumaverage slopeparameterfor forestroad(fixed in 12%) was considered(BERNETTI and FAGARAZZI 2003). Therefore averagetransportationdistanceof woodalongforestroadsto sourceswere:for Slovenianarea1.81km (oneway) andfor Italian area1.71km (oneway).
186
In order to evaluate forest road transporting to main road sources, cost of 0.90 €/km per cubic meter(two ways)wasconsideredin allocation analysis from forest to main road.Atthis stagewood transportation is doneby tractor and trailer and then from public roadsideto terminals by truck and trailer combination. Same costs were considered for bothcountries. In this study, transportation of 6 m lengthlogsby truck andtrailer wassupposed.The maximum payload considered was 40 t (20 t for truck and 20 t for trailer)corresponding to 54 m3 of timber (with a wood density of 930 kg/m3 - averagevalue fordifferent broadleaveswood at 50% of moisture content). According to some studies(SPINELLI et al. 2007; GRONALT and RAUCH 2007), a cost index of 0.25 €/km per cubic meter was considered. Distance between each source and sink was calculatedby anetworking analysis(GRIGOLATO et al. 2005).Thereforeeachsourcewascharacterizedbytransporting distanceoptimisedby the shortestway according to roadnetwork results. Foreachsource, thetotal amountof harvestablewood anditsaverage supply costwasset.
Woodflow analysis:definingscenariosTwo scenarios were defined in order to evaluate wood flow betweenItaly and Slovenia.The first scenario(SA) aims to consider costs andwood flows asconstrained at regionalscale: wood flow of both countrieswithin thecountry borders.Secondscenario(SB) aimsto showwood flow over countriesborders. In order to simplify theanalysis, two terminalswereconsidered:oneon Italian side and the otheron Slovenian side. In SB scenario woodcan indistinctly flow on bothterminals(supply points for wood). Thetwo sinks correspondto two mainwoodindustrialdistricts insidethestudyarea.Scenarios(SA and SB) presentresults concerningthe total cutting volume availablethatcould besupplied(m3) andits supply cost (€/m3).In theSB case study,woodflow cansupply both terminals.Total amount andaverage costsupplying wood to Italian or Slovenian terminal were calculated with excel spreadsheetcalculationsonmatricesobtainedby a roadnetworkingGISbasedanalysis.
Regionalscale (SA)Accordingto FOpPforestoperations results (harvestable amount and cost), allocationandtransportationcostswereaddedin order to define the total costof wood flow at regionalscale. A GIS-based network analysis defined the amount and supply cost of woodaccordingto the distancebetween the samewood sourcesandsinks. On table 5.3.2.a andfigure 5.3.2.d, resultsof regional scaleflow are reported for both terminals investigated.Results concern10 yearsscheduled forest planning and distanceclass is related to thesupplydistance(oneway).Transportation costincludestwo ways. Results at regional scaleareshowedonmap(figure5.3.2.e). Supplycosts areidentified at wood sourceslocation.
187
Table 5.3.2.a: constraintof woodflow at regional scale
Figure 5.3.2.d: supply cost in relation to distance(two way) from sinks (constrainedwoodflow at regionalscale)
ITA Distance Sources VolumeAccumulated
volumeForest
operation Transporting TOTAL
km n° m3 m3€/m3
€/m3€/m3
<10 58 175196 175196 26.60 4.9 31.5
10-20 85 372611 547807 27.16 6.8 34.0
20-30 61 237233 785040 26.73 9.4 36.1
30-40 72 231046 1 016086 28.40 11.9 40.3
40-50 45 233821 1 249907 26.78 14.3 41.1
50-60 19 180261 1 430168 28.10 16.6 44.7
> 60 1 55 974 1 486 142 32.96 18.5 51.5
m3€/m3 - €/m3
TOTAL 1 486142 AVERAGE 28.11 - 39.88
SLO Distance Sources VolumeAccumulated
volumeForest
operationTransporting TOTAL
km n° m3 m3€/m3
€/m3€/m3
10 39 67 951 67 951 27.81 4.8 32.6
10-20 40 48 016 115967 18.66 7.4 26.0
20-30 72 114311 230278 20.37 9.8 30.2
30-40 120 200878 431156 22.43 11.9 34.3
40-50 69 126163 557319 25.02 14.8 39.8
50-60 12 3 912 561231 24.42 16.2 40.6
>60 0 - 561231 - - -
m3€/m3 - €/m3
TOTAL 561 231 AVERAGE 22.32 - 33.92
25
30
35
40
45
50
55
< 10 10-20 20-30 30-40 40-50 50-60 > 60
km
€/m
3
wood flow: ITA
wood flow: SLO
188
Figure5.3.2.e: spatial distributionof woodsourcesandits supply cost (constrainedwoodflow at regionalscale)
Largescale(SB)Large scalewood flow analysissupposedthat terminals can be supplied from all sinks ofthearea,without considering borders.As it is shown on figure 5.3.2.ffor thespecific case study on inter-regionalsupplyanalysis,Italian terminal is morecost-efficient when it is supplied by wood source over 30 km. Onthe other side, Slovenian terminal is more cost-efficient when it is supplied from sourceswithin 30km.On figure 5.3.2.g, map showsan inter-regional supply area,where wood sources haveapproximatelya correspondingsupply costfor both terminals: the supply basin presentsanarea of 20000 ha, with an available cutting volume of 690000 m3/10y and a maximumdifferenceonsupplycostbetweenthetwo terminals of ± 2 €/m3.
189
Results overtheinter-regional supply basin evidencethatSlovenian terminal, evenif it hasa lower efficiency in long distancesupply over Italian area (figure 5.3.2.f), can haveadvantageby increasingits intereston Italian wood availability. Inside the inter-regionalbasin area,as it is reported on table 5.3.2.b, Slovenian sourcesgenerallyshow a highersupply cost but a lower forestoperation cost than Italian sources. Slovenianterminal canfind advantageof this situation expanding the supply area over Italian boundaries.Therefore,Slovenianterminal canpotentially takeadvantageincreasing supply amount of572000 m3/10y. On the other side, Italian terminal could potentially take advantage of118000m3/10y comingfrom Slovenianside. Transportation costhavean influencebetween24 and32% on total cost: this meansthat if we want to try reducing wood cost we havetointervene in cutting and skidding operations. One solution could be introducing newtechnology with higher productivit y or cutting more wood per unit areawhereforesthasprevailing productivefunction.
Figure5.3.2.f: supplycostin relation to distance(two way) from sinksfor wood flow atinter-regional scale
For this stageof development the resultsshowed that theapproachhasbeensuccessful: asit wasexpectedthescenariowhich includesregionsin bothcountriesshowedbetter results.Theprocedureis almost suitablefor practical use, wherespecificrecommendationsshouldbe presented to the stakeholders on both sidesof the state border. Models showedgoodflexibility andreadinessfor practicaluseevenif somegapsandpits havebeendiscovered(seefor example§ 3.7.2.2).
25
30
35
40
45
50
55
< 10 20-25 35-40 50-55 65-70 >80km
€/m
3
wood flow: SLO sink
wood flow: ITA sink
190
Figure5.3.2.g: supply basin resulting asinter-regional supply area by consideringmaximumdifferenceon supply costbetweenthetwo terminalsof ± 2 €/m3
Table 5.3.2.b: Source points located inside the interregionaleffective-cost area analysisaccordingto their locationanddestinationoverborders
DISTANCE COSTWOODFLOW
Forestoperations
Allocation +transport
Total
FROM TO average maximum minimum average average average
sources terminals km km km €/m3€/m3
€/m3 m3/10y
ITA ITA 22 46 10 27.67 8.72 36.38 572000
ITA SLO 27 68 10 27.67 9.94 37.61 572000
SLO SLO 31 48 12 23.42 11.13 34.55 118 000
SLO ITA 31 45 12 23.42 11.12 34.54 118 000
Furtherstudies shouldfollow the commonmarketdevelopmentof this region on onesideand peculiaritiesof eachcountry on the other side. In the future the study areashould belarger and should include greater numberof mills, platforms, harboursand power plantsalong the border betweenItaly andSlovenia. In this it would be possible to seehow theresultsvary with the sizeof area– it is thequestion of cutting volumeavailable,transportcostsandmarketopportunities.Morewood assortments should alsobe considered astheirdifferent valueson theside of sources(wherethey areproduced) andsinks (where theyareconsumedor processed). Largerareashould give better result of optimal scenarios.For thispurposethe sametechnological models for specific terrain and stand conditions on bothsidesof bordershouldbe chosen,andtypical machine andlabour configuration shouldbedefined for eachtechnology including long distance transport. Technologiescanbe same
191
with minor specific differences between countries. The same is true also with costcalculations, which differ in some degree, and daily performances, which should becalculatedfor chosenmachineson thebasis of futuretime studies.Theresults of this study showedin some cases(by forest compartmenton figure3.6.2.2.c)extreme differences,but closer analysisshowed that it is normal result under certaincombination of variables.It was already discussed(LUBELLO et al. 2007) thepossibility touse in minor extend a stochastic(randomisedwithin chosen range)variables(i.e. dailyperformances,skidding distances,tree size, assortment structure within stand type etc.)insteadof puredeterministic approach. On this way we could level different influencesonlargerscale.Thereis alwaysa challengeto validateandprovetheresults by observation (orquestionnaire)in thereal life, but this is for the timebeingadistantfuture goal.
192
6. CONCLUSIONS
TheForestOperationPlanning model wasthoughtasa helpful decision support tool for anintegrated forest and harvestingplanning. The integration of different aspectslike terrainevaluation, skidding systems and their technical limits, productivi ties and costs,assessmentalplansdata andforestroad network wassuccessful. Requiring only five inputfiles (we admit that they arenot alwaysso easyto fulfi ll!) the modelprovidepreciseoutputmaps which canbeusedandinterpretedfor different purposes.As showedinside this work,outputsmay behelpful both on small andon big scaleplanning andcan be integratedwithothersimpleapplications.Theuseof GISsoftwaresis stil l increasingandwe think thatalsothe numberof toolsandmodelswill increase.TheFOpPmodel herepresentedis surely notthe first andlast version, but it will slowly changein the future, implementing it with newfunctionsor newalgorithms,programminglanguage anduserwindows.Theintroductionofnew technologiesas Lidar and new forest planning proceduresas the data and surveysrequired,might allow more and more preciseevaluations.So we hope that in the futureforesters wil l usethe model during the planningphase: we tried to demonstrate that it ishelpful evaluating the cheapest and environmentally sound skidding system,calculatingand optimizing utilization costsand that is a good instrument to judge the road networkinsidea forest area.If all operatorsof theforestsectorsapply for improvingtheir “ring” of thewood chain,thewoodmight bethebestmaterialfor the future for anykind of use, from building housestoheatingand maybeproducingfuel… andit will beecologically andenvironmentally sound.
193
ACKNOWLEDGMENT
Thanks to the Regional forest and economy headoffice (Direzione Foreste ed EconomiaMontanadi Mestre(Venezia)) for providingDigital TerrainModel of VenetoRegion,othershapefilesandthedatabaseof all declaredcuttings(§ 5.3.1.).
Thanksto themountaincommunity of Asiago(Spettabile Reggenza7 Comuni) for giving acopy of the forestassessmental planwhichdata wereusedasa basis for buildingthemodel.
Thanks to the “Ufficio Forestee Fauna” of Trento for providing forestassessmental plansdatabaseand roads shapefile. Thanks also to forest workers and instructors for theircollaborationduringsurveysof cablecranelines.
Thanks to the Friuli -VeneziaGiulia forestService for providing forestassessmentaldata,roadshapefilesandotherprecious information.
Thanks to professor HansR. Heinimann for hospitality in LUE Departmentof ETH-Zurichand for his suggestionsandrevising of modelbuilding. Thanks to RiccardoDe Filippi forteachingtheuseof ArcGISand ModelBuilder.
Thanks to professors Anastasia Stergiadou (University of Tessalonica – Greece) and toJanezKrč (University of Ljubljana – Slovenia)for sharing dataandcomparingresults oncommonstudyareas.
Thanks to all forest enterpriseswho allowed surveys during their work and for theirpractical commentsand teachings.
Thanks to all my PhD colleagueswho gave mesupportand good suggestions, in particularStefanoGrigolato,LucaZuccoli -Bergomi andBeatriceEmer.
194
REFERENCES
AA.VV., 1961. Trafficability of soils. Soil Classification. Technical Memorandumn° 3-240, 16th supplement. U.S. Army Engineer Waterways Experiment Station,Vicksburg,Mississippi.
ANDERSON M.G., 1985. Forecastingthe trafficability of soils. In RichardsK.S., ArnettR.R., Ellis S. - Geomorphology and Soils. GeorgeAl len & Unwin LTD, London:397-416
ANONYMOUS, 1975. The forestry Commission system of terrain description andclassification. British Forestry Commission, Harvesting and marketing division,Edinburgh.
APAT, 2005.Agenziaper la Protezione dell’Ambiente e per i servizi Tecnici. Corine landCovermaps.http://www.clc2000.sinanet.apat.it/cartanetclc2000/clc2000/index.asp
ARONOFF S., 1993. Geographicinformation systems: a managementperspective. WDLPubblications, Ottawa,3° ed.:294pp.
AXELSSON S.Å., PONTÉN B., 1990. New ergonomic problems in mechanized loggingoperations.International Journalof Industrial Ergonomics, 5: 267–273.
AZZALI NI O., 2004. Il Consorzio Gestione Forestale (Co.Ge.For). Un’Associazione diimpreseaservizio dell’ambiente. Sherwood, 3 (n. 98):37-39.
BALDINI S., POLLINI C., 1998.Interactionbetweennetwork of services:forestry and woodharvesting systems.Proceedings of the seminar on environmentally sound forestroadsandwoodtransport, Sinaia,Romania,17-22 June,1996.FAO, Rome:337-341.
BALOCCO F., GUBETTI C., PEROTTO V., 1994.Pisteo peste?Ed.Pro Natura,Torino,50 pp.
195
BAKER W.L., YUNMING C., 1992. The r.le programsfor multiscale analysisof landscapestructureusingthe GRASSgeographical information system.LandscapeEcology 7:291–302.
BEKKER M.G., 1956.Theoryof land locomotion:the mechanicsof vehicle mobility. TheUniversity of MichiganPress.Ann Arbor.
BEKKER M.G., 1969.Introductionto terrain-vehiclesystems.University of MichiganPress,AnnArbor. 846pp.
BENGSTON D.N., FAN D.P., 1999.The public debateaboutroadson the National Forests:an analysisof thenewsmedia,1994-98. Journalof Forestry, 8: 4-10.
BERG S., 1992.Terrainclassificationsystemfor forestry work. ForestOperationsInstitute“Skogsarbeten”,Sweden.28 p.
BERNETTI I., FAGARAZZI C., 2003. BIOSIT: una metodologia GIS per lo sfruttamentoefficientee sostenibile della"risorsabiomassa"a fini energetici. Firenze:D.E.A.R.T,Dipartimentodi EconomiaAgrariaedelle RisorseTerritoriali.
BILL R., FRITSCH D., 1994. Grundlagen der Geo-Informationssysteme – Hardware,Software und Daten.Band 1,2, ed. Herbert WichmannVerlag GmbH, Heidelberg:415pp.
BOMBOSCH F., SOHNS D., NOLLA U R., KANZLER H., 2003.Are forest operationson steepterrain (averageof 70% slope inclination) with wheel mounted forwarderswithoutslippage possible? In Proceedings "Austro 2003: High Tech ForestOperations forMountainousTerrain", eds.Limbeck-Lili enau,Steinmüller and Stampfer.Schlaegl,Austria,October 5-9, 2003.
BONASSO R.P. 1989. Toward a naïve theory of trafficabili ty. In Antonisse H.J., BenoitJ.W., Silverman B.G., Proceedings of The Annual AI systems in governmentconference.March27-31,1989. Washington, D.C. IEEEComputerSociety Press.
BORTOLI P.L.. 2001. La viabilità per la valorizzazione delle aree protette e dellaselvicoltura naturalistica. In Atti del Convegnointernazionale U.N.I.F. “Viabilit àforestale: aspettiambientali, legislativi e tecnico-economici” LagoLaceno 2-3 ottobre1998(Av). Ed.A.G.R.A. s.r.l., Roma,101-128.
BORTOLI P.L., SOLARI V., 1996. Le gru a cavo forestali: la pianifi cazione, i costi, lasicurezza. In Le moderneteleferiche forestali. Manuale II, 65-78. RegioneautonomaFriuli -VeneziaGiulia, serviziodellaselvicoltura.
BOVIO G., 2001.La viabilità forestalee gli incendi. In Atti del Convegno internazionaleU.N.I.F. “Viabili tà forestale:aspettiambientali, legislativi e tecnico-economici” LagoLaceno2-3 ottobre1998(Av). Ed.A.G.R.A.s.r.l.,Roma:38-50.
BRIXIUS W.W., 1987.Tractionprediction equations for biasply tires.AmericanSocietyofAgriculturalEngineers,papern. 87-1622.
BUONGIORNO J., GILLESS J.K., 2003.Decision Methods for ForestResourceManagement.Academic Press, SanDiego,California, 439 pp.
BURGESS J.A., CUBBAGE F.W., 1989. Comparison of machine rate and cash flowapproaches for estimating forest harvesting equipment costs. Paper 89-7548.Presentedat the1989Meeting of theAmericanSociety of Agricultural Engineers. St.Joseph,MI: ASAE. 24 p.
BURROUGH P.A., 1986.Principlesof GeographicalInformation Systemsfor landresourcesassessment.Oxford: OxfordUniversityPress Inc.
CALVANI G., MARCHI E., PIEGAI F., TESI E., 1999.Funzioni,classificazione,caratteristichee pianificazionedellaviabilità forestaleper l’attività di antincendio boschivo. L’Ital iaForestalee Montana3: 109-125.
CALVO E., CAROVIGNO R., GUGLINI M., MOGAVERO F., 1998. Indirizzi e criteri dipianificazione e gestione multifunzionale dei sistemi forestali e naturali delfondovallevaltellinese.Geniorurale7/8.
CALVO E., 2004. Il ruolo dei sistemiverdi territoriali nei processi di sviluppo sostenibiledel territorio rurale. Alcuni casi applicativi nella Regione Lombardia. In attiConvegno Internazionale “Il sistema rurale: una sfida per la progettazione trasalvaguardia,sostenibilitàe governo delle trasformazioni”. Politecnico di Mi lano,13-14 ottobre2004.Milano.
CALVO E., BODOARDO W., GHIOTTI N., NORIS M., 2004.Pianodi indirizzo ForestaledellaProvinciadi Milano. Provincia di Milano, 152 pp.
CAMCOM 2006b. Progetto Legno- Relazione illustrativa anno 2005. Cameradi CommercioIndustriaArtigianatoe Agricolturadi Trento.
CAMCOM 2007a.Rapportosull ’economia della provincia di Udine. 5a giornata dell’Eco-nomia, 10 maggio 2007, Udine. Cameradi Commercio di Udine, Studi e ricerche.http://www.ud.camcom.it/studi/frame.htm
CARBONE F., 2007. Il costodel lavoro per l’impresaforestale.Alberi e Territorio IV (4-5):24-31.
CARLSSON B., SVENSSON A., TROEDDSSON H., 1969. Terrangtypsschemafor SvensktSkogsbruck.ForskningsstiftelsenSkogsarbeten,Redogorelsenr. 9, Stockholm, 12pp.
CARVER S.J., 1991. IntegratingMulti-Criteria Evaluation with GeographicalInformationSystems.InternationalJournal of Geographical Information Systems, 5 (3): 321-339.
CAVALLI R., 1997. Il trattore agricolo a 4 RM e il verricello nel concentramento enell’esboscodel legname.Sherwood21 (3): 31-39.
CAVALLI R., 2004.Le utilizzazioni forestali nell’I talia nord-orientale. L’Itali a Forestale eMontana,6: 453-465.
CAVALLI R., 2005.Valutazionedell’ impatto delleattivi tà forestali. In La gestioneforestaleper la conservazione degli habitat della rete Natura 2000. Accademia Italiana diScienze forestali. Non pubblicato.
CAVALLI R., ZUCCOLI BERGOMI L., 2005. Productivity and costs of a tractor-mountedprocessor in thinning operations under alpine conditions. In Bostjan K: FORMEC2005: scientific cooperation for forest technology improvement. Conferenceproceedings,Ljubljana,Slovenia26-28Semptember2005.
CAVALLI R., LUBELLO D., 2006. Firewood cable yarding on steep terrain in Alpineconditions. In proceedingsof FORMEC 2006, 39th International Symposium onForestryMechanization.24-28sept. 2006,Sofia,Bulgaria.
CAVALLI R., ZUCCOLI BERGOMI L., 2006. Funzionalitàdi un harvesterin ambientealpino.L’Italia Forestalee Montana61(3): 181-191.
CAVALLI R., ZUCCOLI BERGOMI L., STAMPFER K., WRATSCHKO B., 2006. Productivity,costsandecologicalimpactsof a cable-forwarder employedunder alpine conditions.In proceedings of FORMEC 2006, 39th International Symposium on ForestryMechanization. 24-28sept.2006, Sofia, Bulgaria.
CAVALLI M., TAROLLI P., MARCHI L., DALLA FONTANA G., 2007. The effectiveness ofairborneLiDA R datain therecognitionof channelbedmorphology. Eos Trans.AGU88 (52): Fall Meet.Suppl., Abstract H52E-07.
CECUTTI C., 2001. Impact environmental de lubrifiants d’origin vègétale utilisés dansl’exploitationforestière.Rapportfinal delaconvention AGRICE n. 0001013. 50 p.
ČERMAK J., NERUDA J., NADEZDINA N., ULRICH R., MARTINKOVA M., GEBAUER R.,POKORNY E., PRAX A., NADEZDIN V., HRUSKA J., GASPAREK J., CULEK I., 2006.Identification of tree root systemdamagecaused by heavy machinery using newmeasurementtechnology suitable for precision forestry. In AckermanP.A., LanginD.W., AntonidesM.C. (eds)2006. Precision Foretry in plantations, semi-natural andnatural forests. Proceedings of the International Precision Forestry Symposium.StellenboschUniversity, South Africa. 5-10 March 2006. Stellenbosch University.SouthAfrica.
CHIRICI G., MARCHI E., ROSSI V., SCOTTI R., 2003.Analisi e valorizzazione della viabilitàforestale tramite GIS: La foresta di Badia Prataglia (AR). L’Itali a Forestale eMontana,LVIII, 6: 460-481. Ed. Accademia di Scienzeforestali, Firenze.
CHUNG W., SESSIONS J., HEINIMANN H.R., 2001. Optimisation of cable harvestingequipment placement and road location using Digital Terrain Models. Paperpresented at theJoint FAO/ECE/ILOCommittee on ForestTechnology workshop onNew Trends in Wood Harvesting with Cable Systems for Sustainable ForestManagement in theMountains,18-24June2001,Ossiach,Austria.
CIANCIO O., NOCENTINI S., 1996.La gestioneforestaletra ecologia, economia edetica. In:CIANCIO O. “ Il boscoe l’uomo” . - Accademia ItalianaScienzeForestali,Firenze,225-238.
198
CICCARESE L., PETTENELLA D., SPEZZATI E., 2004.Le biomasselegnose. Un’indaginedellepotenzialità del settore forestale italiano nell’offerta di fonti di energia. APAT,Agenzia per la Protezionedell’Ambiente e per i Servizi Tecnici, Roma. Report30/2003:99pp.
CIECHA., 2006.Personalcommunication.
CIELO P., GOTTERO F., MORERA A., TERZUOLO P., 2003.La viabilità agro-silvopastorale:elementi di pianificazionee progettazione.IPLA – RegionePiemonte,106 pp.
CIELO P., GOTTERO F., 2004. Il piano della viabilità. Finalità, analisi ed elaborati.Sherwood10 (7): 33-38.
CIOTTI M., 2005.L’andamento nel lungoperiodo del prezzodel legname:un casodi studioin provincia di Belluno. Relatore Pettenella D. Dipartimento Territorio e SistemiAgro-Forestali, Facoltàdi Agraria,Universitàdi Padova,Legnaro.
CIVIDINI R., 1983.Elementidi tecnologiaforestale.Edagricole,Bologna.Pp. 162, 164-199,206-426.
COLPI C., PETTENELLA D., URBINATI C., 1999. Forestryin Italy. In: P. Pelkonen et al.,1999, “Forestry in changingsocieties in Europe – Part II: Country reports”. SilvaNetwork.
CORN P.S.,BURY R.B., 1989.Logging in westernOregon: responsesof headwaterhabitatsandstreamamphibians.ForestEcology andManagement,29:39-57.
COSTANZA R., WAINGER L., FOLKE C., MALER K., 1996. Modeling complex ecologicaleconomic systems:toward an evolutionary, dynamic understanding of peopleandnature.In EcosystemManagement: selected readings.Springer,New York. pp. 148-163.
CRAIG W.J., DAVID M.D., 1991. Progresson the Research Agenda:URISA '90. URISAJournal, vol. 3 (1): 90-96.
CROSS T, 1998.Machinerycost calculation methods.AE&RD n. 13. U.S. DepartmentofAgriculture, University of Tennessee,Institute of Agriculture, Knoxville, Tenn.http://economics.ag.utk.edu/pubs/
CROSSLAND M.D., PERKINS W.C., WYNNE B.E., 1995. Spatialdecision support systems: anoverview of technology and a testefficiency. DecisionSupportSystems, 14 (3); 219-235.
CULLINAM V.I., THOMAS J.M., 1992.A comparisonof quantitative methodsfor examininglandscapepatternandscale.LandscapeEcology 7:211–227.
DANTZIG G.B., WOLFE P., 1960.Decomposition principle for linear programs. OperationsResearch, vol. 8: 101-111.
DAVIS G., 1974. ManagementInformation Systems:Conceptual Foundations, Structure,andDevelopment.New York, ed. McGraw-Hill , Inc.
DECOL L., 2006.Personalcommunication.
DEL FAVERO R., BORTOLI P. L., SOLARI V., S.T.A.F. S.n.c.,VANONE G., MORO E., 2000.Direttive per i piani di gestionedelleproprietà forestali nella RegioneFriuli VeneziaGiulia. RegioneAutonomaFriuli VeneziaGiulia Udine,pp.256.
199
DEL FAVERO R. (a cura di), 2001. Biodiversità e indicatori nei tipi forestali del Veneto.RegionedelVeneto,GiuntaRegionale.
DEL FAVERO R., 2004. I boschi delle regioni alpine italiane: tipologia, funzionamento,selvicoltura.Padova,Ed.CLEUP,599pp.
EASTMAN J.R., JIN W., KYEM P.A.K., TOLEDANO J., 1995.RasterProcedures for Multi -Criteria / Multi -Objective Decisions. Photogrammetric Engineering & RemoteSensingvol. 61 (5): 539-547.
EBDON D., 1977.Statistics in Geography. A PracticalApproach. Blackwell, Oxford.
EDWARDS W, 2001. Estimating farm machinery costs. PM 710. U.S. DepartmentofAgriculture, Iowa State University of Science and Technology, Ames, Iowa.http://www.extension.iastate.edu/pubs/
EICHRODT A.W., 2003. Development of a spatial Trafficabilit y Evaluation System. Vdf,ETH Zürich.184pp.
EMER B., 2005. Simulation of harwarder conceptsunder Italian north-eastern Alpsconditions.Masterthesis,University of Padova,Dept. TeSAF.
EMER B., GRIGOLATO S.,LUBELLO D., CAVALLI R., 2007.A GIS-basedapproach on woodchips supply chain in North-easternItaly. In proceedings of the IEA workshop“Sustainable forestry systems for bioenergy: integration, innovation andinformation”. 29aug.-3 sept.Joensuu, Finland.
ENGELBART D.C., 1962. Augmenting Human Intellect: A Conceptual Framework. AirForce Office of Scientific Research, AFOSR-3233, URL www.bootstrap.org/-augdocs/friedewald030402/augmentinghumanintellect/ahi62index.html .
ESRI,2005.ArcGIS DesktopHelp.Release9.1, april 26,2005. http://webhelp.esri.com
FABBRI A.G., 1991.Spatialdataanalysisin raster-basedGIS: an introduction to geometriccharacterization. In: Belward A.S., ValenzuelaC.R. (ed.). Remote Sensing andGeographical Information Systems for Resource Management in DevelopingCountries. ECSC,EEC, EAEC, Brusselsand Luxembourg, pp.357–388.
FABIANO F., 2002. La pianificazione dei lavori forestali, criteri di scelta dei sistemid’esbosco.Sherwood81 (9): 35-38.
FAO, 1977. Planning forest roads and harvesting systems. Food and AgricultureOrganization of theUnitedNations,forestry department, Rome.
200
FAO, 1992. Cost control in forest harvesting and road construction. Forestry Paper99.FoodandAgricultureOrganization, Rome.106 pp.
FAO, 2007.Import / Export of ForestProducts- Tradeof ForestProducts for 2002. FAO,Rome.www.fao.org/forestry/site/22056/en/ita
FEDRA K., FEOLI E., 1998. GIS Technology and Spatial Analysis in Coastal ZoneManagement.EEZTechnology, 3: 171-179.
FEIERING R.B., 1986. LinearProgramming,An introduction to Quantitative ApplicationsintheSocial Sciences. 60
FEOLI E., ZUCCARELLO V., 1996.Spatialpatternof ecologicalprocess: theroleof similarityin GIS applicationsfor landscape analysis. In: Fisher M., Sholten H.J., Unwin D.(ed.) Spatial analytical perspectives on GIS, GIS DATA 4, Taylor and Francis,London,pp.175-185.
FERGUSON R.L., JONES C.H., 1969. A Computer Aided Decision System.ManagementScience15 (10): 550-562.
FOREST SERVICE, 2000. Code of Best Forest Practice. Ireland: planning the thinningoperation: 124-128.ForestService,Department of the MarineandNaturalResources,Dublin, Ireland.
FORMAN R.T.T., FRIEDMAN D.S., FITZHENRY D., (andothers),1997. Ecological effectsofroads: towardthreesummaryindicesandanoverviewfor North America.In: CantersK., Piepers A., Hendriks-Heersma D., eds. Proceedingsof the internationalconference: Habitat fragmentation, infrastructure and the role of ecologicalengineering.September17-21 1995, Maastricht – theHague,TheNetherlands.Delft,The Netherlands:Ministry of Transport, Public Works and WaterManagement: 40-54.
FORMAN R.T.T., HERSPERGERA.M., 1996. Road ecology and road density in differentlandscapes,with international planningand mitigation solutions. In Evink G., GarrettP., Berry J., eds. Proccedings of: Transportation and wildlife: reducing wildlif emortality andimproving wildlife passageways across transportation corridors.FloridaDep of Transportation/Federal Highway Administration transportation-relatedwildlife mortalityseminar.April 3 – may2, 1996,Orlando,FL: 1-23.
FURNISS M.J., LOVE M.A., FLANAGAN S.A., 1997. Diversion potential at road-streamcrossings. Water/Road Interaction Technology Service 9777-1814-SDTDC. SanDimas,CA: USDA ForestService,TechnologyandDevelopmentProgram, 12pp.
GANDASECA S., ACAR H., YOSHIMURA T., 2001.Occupational safety and healthof forestworkers of cableharvestingin Turkey. Paperpresentedat the Joint FAO/ECE/ILOCommittee on Forest Technology workshop on New Trends in Wood Harvestingwith Cable Systemsfor SustainableForestManagementin the Mountains,18-24 June2001,Ossiach,Austria.
GARDNER R.H., O’NEIL R.V., 1991. Pattern,process,andpredict-ability: theuseof neutralmodels for landscapeanalysis.In: Turner M.G., GardnerR.H. (ed.). QuantitativeMethodsin LandscapeEcology. Springer-Verlag,NewYork, pp. 289–307.
201
GELLRICH M., BAUR P., ZIMMERMANN N. E., 2006. Natural forest regrowth as a proxyvariable for agricultural land abandonment in the Swiss mountains: a spatialstatistical model basedon geophysical and socio-economic variables.Journal ofEnvironmental modelling & assessment, Springerlink onlinehttp://springerlink.metapress.com/ content/1573-2967/
GELLRICH M., ZIMMERMANN N. E., 2007. Investigating the regional-scale pattern ofagricultural land abandonmentin the Swiss mountains: a spatial statistical modellingapproach. Landscapeandurbanplanning79: 65-76.
GEOFFRION A.M., 1983. CanOR/MSEvolve FastEnough?Interfaces13: 10-25.GERRITY T.P. Jr., 1971. Design of Man-Machine Decision Systems:An Application to
GOLOB T.B., 1978. Current progress in researchon terrain properties. EnvironmentalCanadianForestService,ForestManagementInstitute,Ottawa,Ontario.FMR-X-110
GOODALL D.W., FEOLI E., 1988. Application of probabilistic methods in the analysisofphytosociologicaldata.Coenoses3: 1-12.
GOODCHILD M.F., DENSHAM P.J., 1990. Spatial Decision Support Systems:ScientificReport for the Specialist Meeting, technical Report 90-5, National Centre forGeographicInformationandAnalysis.
GORRY A., SCOTT MORTON M.S., 1971. A Framework for Information Systems. SloanManagementReview13 (1): 56-79.
GPA 2005. Dati dei Piani di Assestamento.Regionedel Veneto, Direzione ForesteedEconomia Montana.Cd-rom
GRAYSON R.B.,HAYDON S.R., JAYASURIYA M.D.A., FINLAY SON B.L., 1993.Waterqualityin mountain ash forests separating the impacts of roads from those of loggingoperations.Proceedings of an international symposium on forest hydrology. 22-26nov. 1993,Canberra,Australia. In Journalof Hydrology, 150 (2-4): 457-480.
GREULICH F.E., 1997. Optimal economic selection of road design standards for timberharvestingoperations– a corrected analytical model. ForestScience,43 (4): 589-594.
GRIGOLATO S., FIRTH J., HOCK B., NIELSEN P., BERND M., CAVALLI R., 2005.SupplyofLogging Residuesfor Energy Production a GIS-BasedStudy. A CaseStudyin NewZealand and in Italy. In proceedings of 14th European Biomass Conference&Exhibition. Biomassfor Energy, Industry and Climate Protection. Palais de congres:Paris,17–23October.
GRIGOLATO S., 2006. Logistica dell'approvvigionamento di residui delle utili zzazioniforestali a fini energeticiin ambiente alpino. PhD thesis, supervisoreprof. Cavalli R.,DipartimentoTeSAF,Universitàdi Padova.
GRIGOLATO S., LUBELLO D., 2006. Applicazione di un modello di pianificazione dellameccanizzazioneavanzatanella forestadi Pramosio. Presentation of the workshop:“Quali opportunitàper la meccanizzazioneforestaleavanzata in ambiente alpino”. 23giugno 2006,Centro Servizi per le Foreste e le Attivi tà Montane– Cesfam,Paluzza(UD).
GUBIANI M., 2004.Studio degli effetti idroerosividella viabilità minorein montagna.Tesidi dottorato,Universitàdegli studidi Padova,Facoltà di Agraria,dip. TeSAF.
HAARLAA R., ASSERSTAHL R., 1972.The internodic forest terrainclassification project in1969-1972.Helsinki, 66 pp.
HALEY P.W.,JURKAT M.P., BRADY P.M., 1979.NATO referencemobility model, EditionI, User guide, Volume I, Operational modules. Technical Report 12503. US Armytank-automotive research& developmentcommand.Warren MI, 174 pp.
HEINIMANN H.R., 1986. Seilkraneinsatzin den Schweizer Alpen: eine untersuchung überdie Geländeverhältnisse, die Erschliessung und den Einsatz verschiedenerSeilanlagen. Diss.ETH n° 7929, Zürich. 169pp.
HEINIMANN H.R., 1994. Conceptual design of a Spatial Decision Support System forHarvest Planning. In: Session J. et al., proceedings of InternationalNEFU/IUFRO/FAO/FEI Seminar on Forest Operations under MountainousConditions.July 24-27, 1994. Harbin, P.R of China. Dept. of Forest Engineering,OregonStateUniversity, Corvallis: 19-27.
HEINIMANN H.R., VISSER R.J.M., STAMPFER K., 1998. Harvester-cable yarder systemevaluation on slopes: a Central Europeanstudy in thinning operations. In COFEProceedings“Harvesting logistic: from woods to markets”, ed. Schiess P. andKrogstad F.: 41-46.Portland,OR, 20-23July.
HEINIMANN H.R., 1999.Ground-basedharvestingsystemsfor steepslopes. In Proceedingsof the International Mountain Logging and 10th Pacific Northwest SkylineSymposium,J. Sessionand W. Chung (eds.), Corvallis OR, March 28 – April 1,1999,p.1-19. Departmentof Forest Engineering. OregonState University. Corvallis,OR 97331.
HEINIMANN H.R., 2007.Forestoperations engineeringandmanagement– thewaysbehindand ahead of a scientific discipline. Croatian journal of forest engineering28 (1):107-121.
HELLRIGL B., 2005.Personalcommunication.
HEMM M., ZIESAK M., WARKOTSCHW., 2006.Simulatingharvestingproceduresto evaluatedifferent working systemsbased on discrete single-tree events. In AckermanP.A.,LänginD.W., AntonidesM.C., 2006. Precision Forestryin Plantations, semi-naturaland naturalforests. Proceedingsof the International Precision Forestry Symposium.StellenboschUniversity, South Africa. 5-10 march 2006. Stellenbosch University.SouthAfrica.
HEYWOOD V.H., WATSON R.T., 1995. Global biodiversity assessment. New York:CambridgeUniversityPress,1140pp.
HINRICHS L., 2006. Automatic generation of treatmentpathsfor mixed forest stands ofspruce(Picea abies) and beech(Fagus sylvatica). In AckermanP.A., LänginD.W.,AntonidesM.C., 2006. PrecisionForestry in Plantations, semi-natural and natural
203
forests. Proceedingsof theInternational PrecisionForestry Symposium. StellenboschUniversity, SouthAf rica. 5-10march2006. StellenboschUniversity. South Afri ca.
HIPPOLITI G. 2003. Note pratiche per la realizzazione della viabilità forestale. Ed.Compagniadelle Foreste, Arezzo, 96pp.
HIPPOLITI G., 2004.La gestione delle util izzazioni forestali. L’Italia Forestale e Montana,6: 415-420.
HIPPOLITI G., 2006.Taglio a rasosupiccolesuperfici. Sherwood 12 (7): 24-25.
HIPPOLITI G, MARINELLI A, UZIELLI L, PIEGAI F, 1980. La valorizzazionedelle risorseforestali italiane, Volume IV. Accademia Nazionale di Agricoltura, AccademiaEconomico Agraria dei Georgofili, Accademia Italianadi ScienzeForestali, Firenze.
HIPPOLITI G., MARCHI E., FABIANO F., 1997. Appunti di meccanizzazioneforestale. Ilpianodella viabilitàprincipale, cap.9.2. Studio editoriale fiorentino, Firenze.
HIPPOLITI G., PIEGAI F., 2000. Tecnichee sistemi di lavoro per la raccolta del legno.Compagniadelle Foreste, Arezzo.
HOLSAPPLE C., WHINSTON A., 1996. Decision Support Systems: A Knowledge-BasedApproach.Minneapolis/St.Paul,MN. Ed.WestPublishing.
HRADETZKY J., SCHOPFER W., 2001. Das Softwareprodukt Holzernte – EineEntscheidungshilfe fur dieHolzvermarktung.AFZ – Der Wald21: 1100-1101.
IENTILE F., 2003. Valutazione dell’impiego delle gru a cavo nella Comunità MontanaComelico-Sappada.Relatore Cavalli R., DipartimentoTerritorio e Sistemi Agro-Forestali,Facoltàdi Agraria,Universitàdi Padova,Legnaro.
IGNIZIO J.P., 1985. An algorithm for solving the linear goal-programmingproblem bysolving its dual.Journal of OperationalResearch Society,36: 507-515.
INFC, 2007.InventarioNazionaledelle Foreste e dei serbatoi forestali di Carbonio. CorpoForestaledelloStato.http://www.sian.it/inventarioforestale/jsp/home.jsp
ISOMÄKI A., KALLIO T., 1974. Consequences of injury causedby timber harvestingmachineson thegrowthand decayof spruce(Puunkorjuukneidenaiheuttamienvauri-oidenvaikutuskuusen lahoamiseenja kasvuun).Acta Forestalia Fennica136.24pp.
ISTAT, 2000. Censimento dell’agricoltura. Istituto Nazionale di Statistica.http://www.istat.it/dati/db_siti/
ISTAT, 2003a. Valoreaggiunto ai prezzi di base dell’agricoltura per regione- Produttivitàdel lavoro nel settore forestale. Istituto Nazionale di Statistica.http://www.istat.it/dati/catalogo/20051220_00/
ISTAT, 2003b. La misura dell’occupazione non regolare nelle stime di contabilitànazionale: un’analisi a livello nazionale e regionale. Anni 1992-2001. Roma.http://www.istat.it/Economia/index.htm
204
JOHNSEN K., SAMUELSON L., TESKEY R., MCNULTY S., FOX T., 2000.Processmodelsastools in forestryresearchandmanagement. Forestscience47 (1): 2-8.
KEEN P.G.W., SCOTT MORTON M.S., 1978.DecisionSupport Systems:An OrganizationalPerspective.Reading,MA: Addison-Wesley.
KEENAN P., 1995.UsingGIS asa DSSGenerator.Working paperMIS No. 95-9, GraduateSchool of Business, University College Dublin, Department of managementInformationSystems,Dublin: 9 S.
KELLOGG L.D., BETTINGER P., 1994. Thinning Productivity and Cost for a MechanizedCut-to-LengthSystemin the NorthwestPacificCoastRegion of theUSA. JournalofForestEngineering,5 (2): 43-54.
KELLOGG L.D., BETTINGER P.,EDWARDS R.M., 1996a.A comparisonof logging,planning,felling, and skyline yarding costs between clearcutting and five group-selectionharvestingmethods.WesternJournalof AppliedForestry, 11 (3): 90-96.
KELLOGG L.D., MILOTA G.V., MILLER M.Jr., 1996b.A comparison of skyline harvestingcosts for alternative commercial thinning prescriptions. Journal of ForestEngineering,7 (3): 7-23.
KIELLAND-LUND J., 1963. Vegetasjonstypenesbetydning for den praktiske skogskjøtsel.NorskSkogbruknr. 7/8, Oslo,5 pp.
KLEIN M., METHLIE L.B., 1995. Knowledge-based Decision Support Systems withApplicationsin Business.Chichester, UK. Ed. JohnWiley& Sons.
KOŠIR B., 2003. Some observations of Syncrofalke cable crane skidding in Slovenianconditions. XXX CIOSTA-CIGRV Congress, Turin, Managementand technologyapplicationsto improve agro-foodsystems,p. 55-63.
KRČ J., 1999.Modelni izračun vpliva ceste na povečanje vrednostidolosagodza.Zbornikgodzdarstvain lesarstva 59,Ljubljana.pp121-139.
KRČ J.,KOŠIR B., 2005.Stroškidelav različicah delovnihpogojev in izkoriščenostistrojevza sečnjo = Labour costs in diverse forest work conditions and utilization of woodharvesters.Zb. gozd.lesar., 2004 [i .e. 2005], št.75,str.105-120.
KRČ J., 2006.A model for evaluating forest road load by forest operations. In AckermanP.A., Langin D.W., Antonides M.C. (eds) 2006. Precision Foretry in plantations,semi-natural andnatural forests.Proceedings of the International Precision ForestrySymposium.Stellenbosch University, South Africa. 5-10 March 2006. StellenboschUniversity. SouthAf rica.
KRČ J., BOŠTIAN K., CAVALL I R., GRIGOLATO S., LUBELLO D., 2007.Different approacheson skidding operation and wood transport investigation: integrate two differentapproachesin onemodel.In Proceedingsof the Austro2007/FORMEC´07: “Meetingthe Needs of Tomorrows´ Forests– New Developments in Forest Engineering”,October7 – 11,2007,ViennaandHeiligenkreuz – Austria. In press
LAARIBI A., CHEVALLIER J.-J.,MARTEL J.-M., 1993.Méthodologie d’intégrationdesSIG etde l’analysemulticritère.Revuede géomatique,vol. 3 n. 4: 415-435.
LAMBERT M.B., HOWARD J.O., 1990. Cost and productivity of new technology forharvesting and in-woods processingsmall-diametertrees.ResearchpaperPNW-RP-430.USDA ForestService,PacificNorthwestResearchStation,37 pp.
LANFORD B.L., STOKES B.J., 1996. Comparison of two thinning systems. Part 2:productivityandcosts.ForestProductsJournal,46 (11/12): 47-53.
205
LA ROCCA P., 1996.Il regime giuridico dellestradecomunali e vicinali. Maggioli editore,Rimini, 533pp.
LAURENT A., PETIT S., MAEKER V., 1996. Routes forestières,environment et paysages.Forêt-Entreprise,110:58-61.
LEVINE P., POMEROL J-Ch., 1995. The role of the Decision Maker in DSSs andRepresentation Levels. In proceedings of the 28th annual Hawaii internationalconferenceonSystemScience. IEEE 1995.
LICKLI DER J.C.R.,1960.Man-computersymbiosis. IRE Transactions on HumanFactors inElectronics,vol. HFE-1: 4-11.
LIMBECK-LILIENAU B., 2003. Residualstand damagecausedby mechanized harvestingsystems. In proceedings of the Austro2003 “High tech forest operations formountainousterrain”.5-9 october2003, Schlaegl, Austria.
LITTLE J.D.C., 1970. Models and Managers: The Concept of a Decision Calculus.ManagementScience16 (8): 466-485.
LITTLE J.D.C.,1975. Brandaid, anOn-Line MarketingMix Model, Part2: Implementation,CalibrationandCaseStudy.OperationsResearch23 (4): 656-673.
LITTLE J.D.C., LODISH L.M., 1969. A Media Planning Calculus.Operations Research17(Jan.-Feb.): 1-35.
LÖFFLER H.J., 1979. Recordingand classificationof soil-conditions within the scope ofterrain classification. Proceedings of IUFRO symposium “Stand establishmenttechniquesandtechnology”. Not published.
LUBELLO D., CAVALLI R., 2006.Ambiti applicativi della Precision Forestry.Sherwood 12(8): 11-16
LUBELLO D., DEL FAVERO A., CAVALLI R., 2007. Un metodotecnico-economico comeausilio alla determinazionedellaripresa.L’It alia Forestalee Montana, on printing.
LUBELLO D., GRIGOLATO S.,KRČ J.,EMER B., CAVALLI R., BOŠTIAN K., 2007.Evaluatingcostson wood supplychain for supporting Slovenianand Italian forest cooperation.In proceedingsof the FERIC - 3rd Forest Engineering Conference,October1-4, 2007,MontTremblant– Canada.
LUBELLO D., RIZZI C., ZANONI M., 2007.Le impreseforestalivenetee trentinea confronto.Unpublisheddata.
LUCCHINI O., 2006.La Borsadel legno.LegnoServizi FVG. Personal communication
LÜTHY D., 1998.Entwicklung eines„Spatial Decision Support“-Systems (SDSS)für dieHolzernteplanung in steilen Geländeverhältnissen.Zurich, Eidgenössische Techn.Hochsch. (ETH). PhD dissn. 12618.
MACAL C.M., 2005.Modelverificationandvalidation. In proceedingsof the Workshopon“Threat Anticipation: social sciencemethodsand models”, April 7-9 2005, ChicagoIL. TheUniversity of ChicagoandArgonneNational Laboratory.
MALCZEWSKI J., 1999. GIS and Multicriteria Decision Analysis. John Wiley and Sons,NewYork.
MARCHI E., 1997. Le gru a cavo nel settore forestale, aspetti tecnici e classificazione.Sherwood,20 (2): 11-21.
MARCHI E., PIEGAI F., 2001. Sistemi di utilizzazioneforestale a basso impatto ambientale.L’Italia Forestalee Montana56 (6): 477-490.
MARCHI E., SPINELLI R., 1997. L’i mpatto ambientale delle strade forestali. L’ ItaliaForestalee Montana,LII (4): 221-239.
MARTELLO G., 2005.Progettostradadi collegamentopista“Portados”.Not published.MATTHEWS D.M., 1942. Cost control in the logging industry. New York: McGraw-Hill,
MCNEEL J.F., RUTHERFORD D., 1994.Modelling harvester-forwardersystem performancein aselectionharvest.Journal of ForestEngineering, 6 (1): 7-14.
MELLGREN P.G., 1980. Classification du terrain pour la foresteriedu Canada. InstitutCanadienderechercheengénie forestier(FERIC), 13pp.
MELLGREN P.G., 1980b.Terrain classification for Canadian forestry. Canadian Pulp andPaperAssociation,Montreal, Quebec,Canada.
MEYER T., STÜCKELBERGER J., HOLLENSTEIN K., ATTENBERGER M., HÄNGGLI T., 2001.Effor2: Holzerntekonzept für die Untersuchungsbetriebe im Kanton Schwyz. Swissfederal Institute of technology Zurich, ETH-Zurich D-Fowi ForstlichesIngenieurwesen,interne Berichtenr. 11.
MIYATA E.S., 1980. Determining fixed and operating costs of logging equipment.Gen.Tech.Rep.GTR NC-55, St. Paul,MN. US Departmentof Agriculture,NorthcentralForestExperimentStation, 16pp.
MUNDA G., 1995. Multi -criteria Evaluation in a Fuzzy Environment. Physica-Verlag,Heidelberg,pp.255.
MURPHY P., CASTONGUAY M., OGILVIE J.,CONNORST., ARP P.A., 2006.Forest operationsplanning basedom high resolution wet areasmapping: verifications. In AckermanP.A., Langin D.W., Antonides M.C. (eds) 2006. Precision Foretry in plantations,semi-natural andnatural forests.Proceedings of the International Precision ForestrySymposium.Stellenbosch University, South Africa. 5-10 March 2006. StellenboschUniversity. SouthAf rica.
NCGIA, 1992. A ResearchAgendaof The National Centerfor Geographic Information andAnalysis. TechnicalReport: 92-7.
OLSEN H.J.,WASTERLUND I., 1989.Terrainandvehicleresearchwith referenceto forestryat the Swedishuniversity of agriculture. The Swedish university of agriculturalsciences, Department of operational efficiency. Uppsatserochresultatn. 149, 60pp.
ORLÓCI L., 1978.Multivariateanalysis in vegetation research.2nd ed.Dr. W. JunkB. V.,TheHague, ix + 451p.
PAT - PROVINCIA AUTONOMA DI TRENTO, 1991. Progetto Legno – Studio per lavalorizzazionedellaproduzionelegnosa.Servizio forestee caccia,66 pp.
PAT – PROVINCIA AUTONOMA DI TRENTO, 2002.relazioneannualesull’attività del ServizioForeste.Attività svolta nel corso dell’anno 2001. Provincia Autonoma di Trento,Servizio Foreste,101pp.
PELLIZZARI L., 2002.Propostametodologica per la produzionedi cartografiadi supportoagli interventi AIB con l’impiego di un sistemaintegrato GPS/GIS. PhD thesis,University of Padua,Dept.TeSAF, Legnaro(PD).
PETTENELLA D, CUTOLO N, 1987. La valutazione dei costi di util izzo delle macchineforestali. Geniorurale, 50 (4), 51-58.
PETTENELLA D., FRANCESCATO V., ANTONINI E., 2004. La filiera del cippato in Italia.Domanda,offertae aspetti economici. LegnoEnergia,1: p. 18-23.
PETTENELLA D., KLÖHN S., BRUN F., CARBONE F., VENZI V., CESARO L., CICCARESE L.,2004. Economic integration of urban consumer’s demand and rural forestryproduction:Italy’s countryreport. COSTAction E30.
PETTENELLA D., TALUCCI G.R., PAOLUCCI M., 2004.La cooperazione forestalein Italia.Suppl.2, Sherwood106, pp.24.
PETTENELLA D., SECCO L., 2004. L’organizzazione economica delle imprese diutilizzazioneboschiva.L’ Italia Forestalee Montana,6: 533-546.
PETTENELLA D., 2007.Non-wood forestproductsandservices. In: NiskanenA., SleeB.,Ollonqvist P., Pettenella D., Bouriaud L., Ramesteiner E. (eds.), Entrepreneurship inthe forestry sector in Europe. University of Joensuu, Faculty of Forestry. SilvaCarelica, 52: 73-103.
PETTENELLA D., CICCARESEL., 2007.Come remunerare i gestori delle foresteper la CO2
fissata?Alberi eTerritorio, 4 (3): 36-42.
PICMAN D., PENTEK T., PORŠINSKY T., 2001.Relation betweenforest roadsand extractionmachines in sustainable forest management.Paper presented at the JointFAO/ECE/ILO Committeeon ForestTechnologyworkshopon New Trendsin WoodHarvesting with CableSystemsfor SustainableForest Management in theMountains,18-24June2001,Ossiach, Austria.
PIEGAI F., 1990. Produttività dell’esbosco con gru a cavo in confronto all’esbosco peravvallamentoed all’esboscoa strascicocon trattori. pp. 22-45. Moena, Italia, 24-25Settembre.
POLLINI C., 1983. Analisi e controllo della produttività e dei costi nelle operazionidiutilizzazioni forestali. Quaderni I.T.L. N° 4. S. Michele all’Adige, Trento: C.N.R.Istitutoperla tecnologiadel legno.
208
POSTIGLIONE A., TROIANI L., 2001. La legislazione sulla viabilità forestale.In Atti delConvegnointernazionaleU.N.I.F. “Viabi lità forestale:aspetti ambientali, legislativi etecnico-economici”Lago Laceno 2-3 ottobre 1998 (Av). Ed. A.G.R.A. s.r.l., Roma,54-72.
POWER D.J., 2007. A Brief History of DecisionSupport Systems. DSSResources.COM,http://DSSResources.COM/history/dsshistory.html version4.0,March10, 2007.
POZZATI A., 1979. La viabilità nella gestione pianificata del bosco. TerraTrentina, 1869-1879,IspettoratoRipartimentaledelle Forestedi Trento.
POZZO D., 2007. Formazione e aggiornamento per addetti forestali. 31.01.2007,http://www.inforesta.net
RICKARDS P.A., PASSMORE A.L., 1977. Planning for profit in livestock grazing systems.ProfessionalFarm Management Guidebook No. 7, Agricultural BusinessResearchInstitute,University of NewEngland, Armidale.
RIGGSJ.L., 1977.Engineeringeconomics.New York: McGraw-Hill. 617 pp.
RIGONI A., 2006. L’evoluzione dei prezzi di vendita del legnamegrezzo:un’analisi deirisultati delle aste nel Comune di Asiago. Relatore Pettenella D. DipartimentoTerritorio e Sistemi Agro-Forestali, Facoltà di Agraria, Università di Padova,Legnaro.
RIZZI C., 2007.Confrontodi sistemidi esbosco della legnada ardere di faggio. RelatoreCavalli R., Dipartimento Territorio e Sistemi Agro-Forestali, Facoltà di Agraria,Università di Padova,Legnaro.
ROSENTHAL R.E., 1985. Concepts, theory and techniques: Principles of multi-objectiveoptimization. DecisionSciences16 (2): 133-152.
ROWAN A.A., 1977. Terrain classification. ForestryCommission,Forestry Record 114.HerMajesty’s StationeryOffice (HMSO),Edinburgh.24pp.
209
RUMMER R., KLEPAC J., 2002.Mechanizedor hand operations:which is lessexpensive forsmall timber?In SmallDiameterTimber: ResourceManagement, Manufacturing, andMarkets proceedingsfrom conference held February 25-27, 2002 in Spokane,Washington. Compiled and edited by D.M. Baumgartner,L.R. Johnson, and E.J.DePuit.WashingtonStateUniversity Cooperative Extension. (Bulletin Office,WSU,PO Box 645912,Pullman,WA 99164-5912. MISC0509. 268 pp.
SAATY T.L., 1980. TheAnalytical HierarchyProcess. McGrawHill , New York.
SAMBUGARO G., 2006.Personalcommunication.
SAMSET I., 1971. Classificationof terrain and operational systems.Joint FAO/ECE/ILOCommittee on Forest Working Techniques and Training of Forest Workers,Symposium on forest operations in mountainousregions, 30 ago. – 11 sept. 1971,Krasnodar(USSR), TIM/EFC/WP.1/1., 22 pp.
SAMSET I., 1972. Cost calculation of forest machines (in Norwegian with Englishsummary). Tidsskrift for Skagbruk,Oslo,Norway, 80 (IV): 357-374.
SAMSET I. 1975. Theaccessibility of forestterrain andits influenceon forestconditions inNorway. Reports of The Norwegian Forest Research Institute n° 32.1,Ås-NLH,Norway:pp45-91.
SARTORI L, GALLETTO L, 1992. Costi di riparazione e manutenzione dei trattori nellaprovinciadi Padova.Rivistadi ingegneriaagraria,2: 81-89.
SCOTT MORTON M.S., 1967.Computer-Driven Visual Display Devices- Their Impact onthe ManagementDecision-Making Process. Doctoral Dissertation, HarvardBusinessSchool.
SCOTT MORTON M.S., 1971.Management DecisionSystems;Computer-basedsupport fordecision making. Boston, Division of Research, Graduate School of BusinessAdministration,HarvardUniversity.
SECCO L., BRUNORI A., 2005. La certificazione Fsc e Pefc in Italia, dati e prospettive.Alberi e Territorio2 (6): 31-35.
SEGEBADEN von G., STRØMNES R., WINER H.I., 1967.Proposalfor an internationalsystemof terrain classification. In proceedings of the XIV IUFRO world congress, Vol. III(section 31-32).
SHIBA M., ZIESAK M., LÖFFLER H., 1990.Der Einsatz moderner Informationstechnologiebei der forstlichenErschliessungsplanung.Forstarchiv 61 jg.: 16-21.
SILVERSIDES C.R., 1980. Innovative transportation in the 2000s. In Forest-to-Mi llchallengesof thefuture,WeyerhaeuserScienceSymposium, pp23-48.September15-17, Tacoma,Washington.Ed.By WeyerhaeuserCo.
SIMON H.A., 1947.AdministrativeBehavior.New York, NY, ed.Macmillan.
SIMON H. A., 1960.The new scienceof management decision. NewYork, ed. Harper&Row.
SMITH T.R., MENON S., STARR J.L., ESTIS J.E., 1987.Requirements and principlesfort heimplementation and constructionof large-scale geographic information systems.InternationalJournalof Geographic Information Systems,1: 13-31.
210
SOL H.G., 1983. Processesand tools for decision support: Inferences for futuredevelopments.In ProcessesandTools for Decision Support, 1-6, ed.Sol H.G., NorthHolland,Amsterdam,theNetherlands.
SOLARI V., 2005. RealizzazionestradaBosco Cavallo. Progetto definitivo, Comune diAmpezzo (Udine).
SPINELLI R.,2004.L’harvesterin Italia. L’Italia Forestalee Montana,6: 511-523.
SPINELLI R., STAMPFER K., 2002. Un harvesterper i primi diradamenti dei boschi inpendenza. Sherwood8 (2): 39-46.
SPRAGUER.H. Jr.,1980.A Framework for theDevelopmentof Decision Support Systems.ManagementInformationSystemsQuarterly,vol. 4 (4): 1-26.
SPRAGUE R.H. Jr., CARLSON E.D., 1982. Building Effective Decision Support Systems.EnglewoodCliffs, N.J,ed.Prentice-Hall, Inc..
SPRAGUE R.H. Jr., WATSON H.J., 1979. Bit by Bit: Toward Decision Support Systems.CaliforniaManagementReviewXXII (1): 60-68.
SPRAGUE R.H., WATSON H.J., 1986. Decision Support Systems:Putting Theory intoPractice.PrenticeHall, New Jersey.
SPRAGUE R.H. Jr., WATSON H.J., 1996.Decision support for management. Upper SaddleRiver, N.J.ed.PrenticeHall.
STAMPFER K., 1999.Influenceof terrainconditionsandthinning regimeson productivity ofa track-basedsteepslope harvester. In Proceedingsof the International MountainLogging and 10th Pacific Northwest Skyline Symposium, ed. J. Sessions and W.Chung. 78-87.Corvallis, OR,March28– April 1.
STAMPFER K., STEINMÜLLER T., 2004.Harvester undSeilgerät amSteilhang:Valmet911.1X3M und Syncrofalke.Eigenverlag des Instituts für Forsttechnik, Universität fürBodenkultur,Wien.25 S.
STAMPFER K., KANZIAN C., 2006.Currentstateand development possibili tiesof woodchipsupply chainin Austria. CroatianJournalof ForestEngineering27 (2): 135-145.
STENZEL G., WALBRIDGE T.A., PEARCE K., 1985.Logging and pulpwoodproduction. 2ndEd. New York: JohnWiley & Sons.358 pp.
STERGIADOU A., 2006.Environmentimpactassessment(E.I.A.) for theevaluation of forestroads in mountainousconditions (Casestudy: Valia Kalda). In Proceedingsof theInternational Conference of Sustainable Management and Development ofMounainousandIsland Areas,September29 – October 1, InselNaxos, Greece,V.II ,125 -129.
STERGIADOU A., LUBELLO D., CAVALLI R., KRČ J., 2007. Estimating forest harvestingoperationsto achieve sustainablerural development in Valia Kyrna (Greece).InProceedingsof the IUFRO EuropeanCongress“Forests and Forestry in the Contextof RuralDevelopment”.Warsaw,Poland,September6-7, 2007.
TAROLLI P.,DALLA FONTANA G., 2007.Potenzialitàdella tecnologiaLiDA R per l’analisi el’interpretazionedelle caratteristichedel sistema alveo-versante in area alpina.PresentazioneconvegnoAIIA, Milano, 27-28 marzo.
TAROLLI P.,DALLA FONTANA G., 2007.Analysis of the headwater basins’ morphology byhigh resolution LiDAR-derived DTM. Proceedings of the 5th InternationalSymposiumon Mobile MappingTechnology, Padova28-30 Maggio 2007.
TERLESK C.J., 1983. A proposedterrain classification for harvesting in New Zealand.Technical officer, Forest ResearchInstitute, Rotorua. New Zealand Journal ofForestry, pp43-57.
TOMASINI M., 1996.Analisi dell’operativitàdella gru a cavo a stazionemotrice mobile inalcunetipologie di utilizzazioneforestalesull’ Altopianodei Sette Comuni. RelatoreCavalli R., Dipartimento Territorio e Sistemi Agro-Forestali, Facoltà di Agraria,Università di Padova,Legnaro.
TOMLI NSON R.F., 1987.Currentand potential usesof geographical information systems–The North Americanexperience. International Journal of Geographical InformationSystems,vol. 1, n.3:203-218.
TREZSNIOWSKI A., 1990.Waldershliessung im GebirgeÖsterreichs. Forstarchiv, 61: 22-26.
TSAY T.B., 1979. An approach to terrain classification for forestry in Canada.IUFROsymposiumonstand establishmenttechniquesandtechnology, Moscow.
TUČEK J., 1994.Using the GIS environmentfor opening-up of forests, Proceedings of theInternational IUFRO, FAO, FEI seminaron forest operations under mountainousconditions,Harbin,China: 58-65.
TUČEK J., PACOLA E., 1999.Algorithms for skiddingdistancemodelling on a rasterdigitalterrain model.Journalof ForestEngineering,10 (1): 67-69.
TURBAN E., 1967.TheUseof MathematicalModels in Plant MaintenaceDecision Making.ManagementScience13 (6): 342-359.
TURNER M.G., 1989.Landscapeecology: the effect of pattern on process. Annual Reviewof EcologyandSystematics, 20: 171–197.
UNESCO, 1993. Environment and DevelopmentBRIEFS. United Nations Educational,Scientific andCultural Organization,Paris.
UNCEM, 2006.Tabella retribuzionioperaiforestali in vigoredall’1/08/2006 al 31/12/2006.http://www.uncem.it/gems/tabelle_forestali.pdf
URBAN G.L., 1967. SPRINTER: A Tool for New Products Decision Makers. IndustrialManagementReview, 8 (2): 43-54.
212
U.S. ARMY, 1961. Trafficability of soils. Soil classification. Supersedes TM 3-240, 16th
supplement.U.S.Army Engineer WaterwaysExperimentStation.Corps of engineers.Vicksburg,Mississippi.
VÄÄTÄINEN K., LIIRI H., RÖSER D., 2006. Cost-competitivenessof harwardersin CTL-logging conditions in Finland – a discrete-eventsimulation study at the contractorlevel. In AckermanP.A., Längin D.W., AntonidesM.C., 2006. Precision ForestryinPlantations, semi-natural and natural forests. Proceedingsof the InternationalPrecision ForestrySymposium.Stellenbosch University, South Africa. 5-10 march2006.StellenboschUniversity.South Africa.
VISSER R.J.M., STAMPFER K., 1998. Cable extraction of harvester-felled thinnings: anAustriancasestudy. Journalof ForestEngineering, 9 (1): 39-46.
VOOGD H., 1983. Multi -Criteria Evaluation for urban and regional planning. PION,London.
WIEST L,. 1998. A landowner’sGuide to Building ForestAccessRoads.U.S.D.A. ForestService, NorteasternAreaStateandPrivate Forestry,47pp. (electronic vers.)
WILLIA MS D., 1992.Forestmanagementdecision supportsystems:An overviewandsurveyof current initiatives. Cortex consultants. Cited by: Moore, T. 1993. Forestmanagement decision support systems (FMDSS) message archive. URL:www.spatial.ca/~tmoore/fmdss/1993/msg00033.html.
WOLYNSKY A., 2005.Sviluppi recentidell’assestamentoforestale in Italia settentrionale.SAFE-infoblatt Nr 19:6-7.
WONG J.Y.,1993.Theoryof ground vehicles(2nd ed.). JohnWiley & Sons,New York, 435pp.
WONG J.Y. 1994.Applications of a computeraidedmethod to parametricstudyof trackedvehicleswith rigid links. Procedural Instrumentsfor MechanicalEngineers,Part D,Journal of Automobile Engineering,208:251-257.
ZANONI M., 2007.Valutazione economicadei costidell’esboscodi legnadaarderecongrua cavoin provinciadi Trento.RelatoreCavalli R., Dipartimento Territorio e SistemiAgro-Forestali, Facoltàdi Agraria,Universitàdi Padova,Legnaro.
ZIESAK M., 2003. Avoiding soil damagescausedby forest machines. In Maria IwarsonWide & Berit Baryd (eds.): 2nd Forest Engineering Conference. SkogforskArbetsrapport,Nr. 536,Maj 2003,Uppsala.
213
ZUCCOLI BERGOMI L., 2006. Produttività e costi di cantieri di utilizzazione avanzata:harvester, forwarder,processor.Presentation of theworkshop:“Quali opportunitàperla meccanizzazione forestaleavanzatain ambiente alpino”. 23 giugno 2006, CentroServizi perle Forestee le Attività Montane– Cesfam,Paluzza(UD).


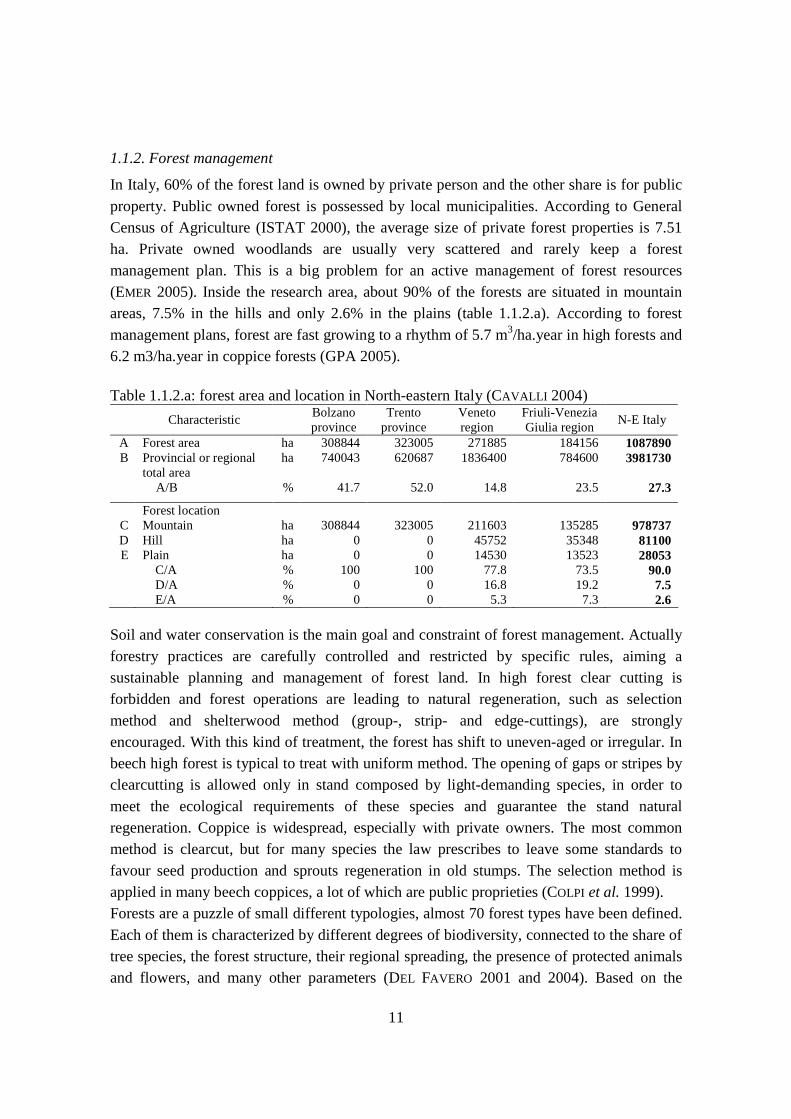
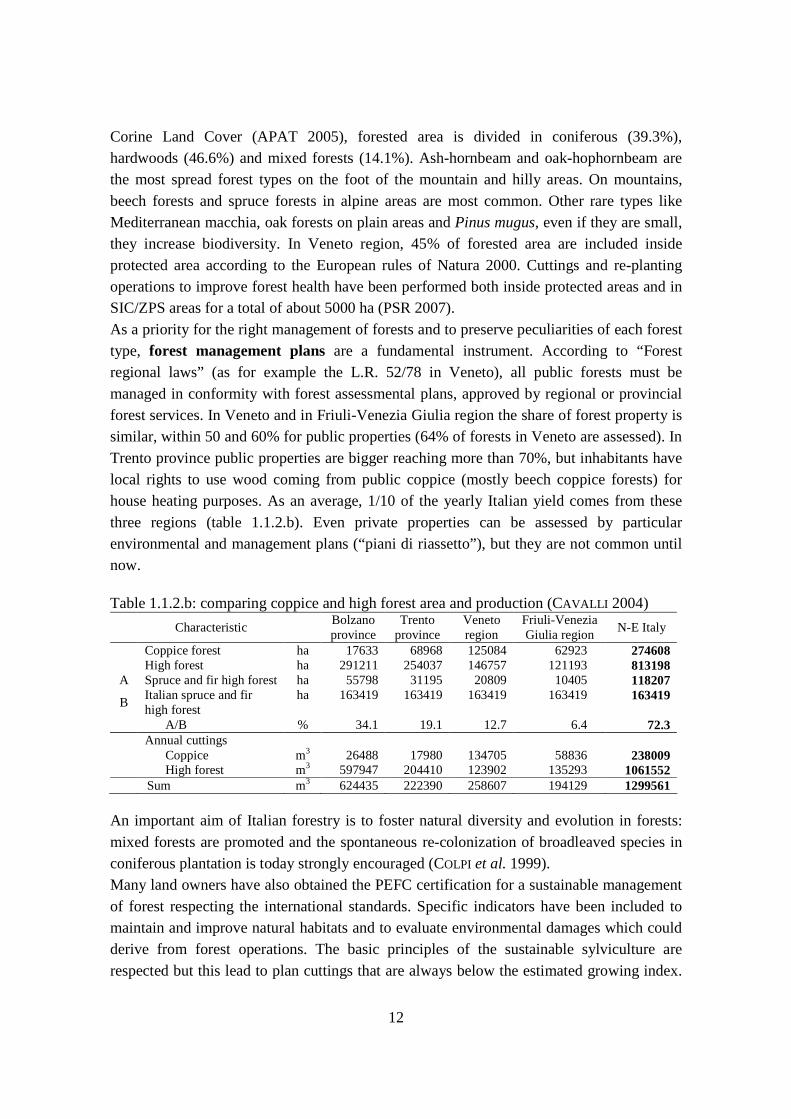
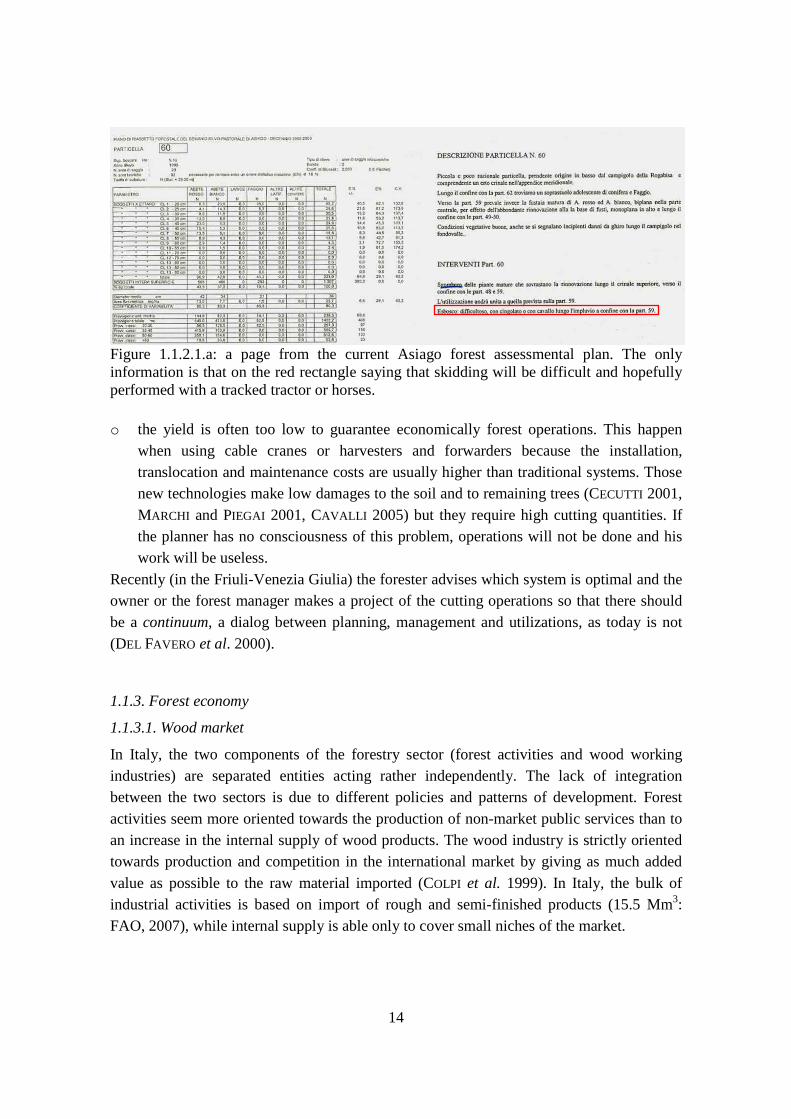

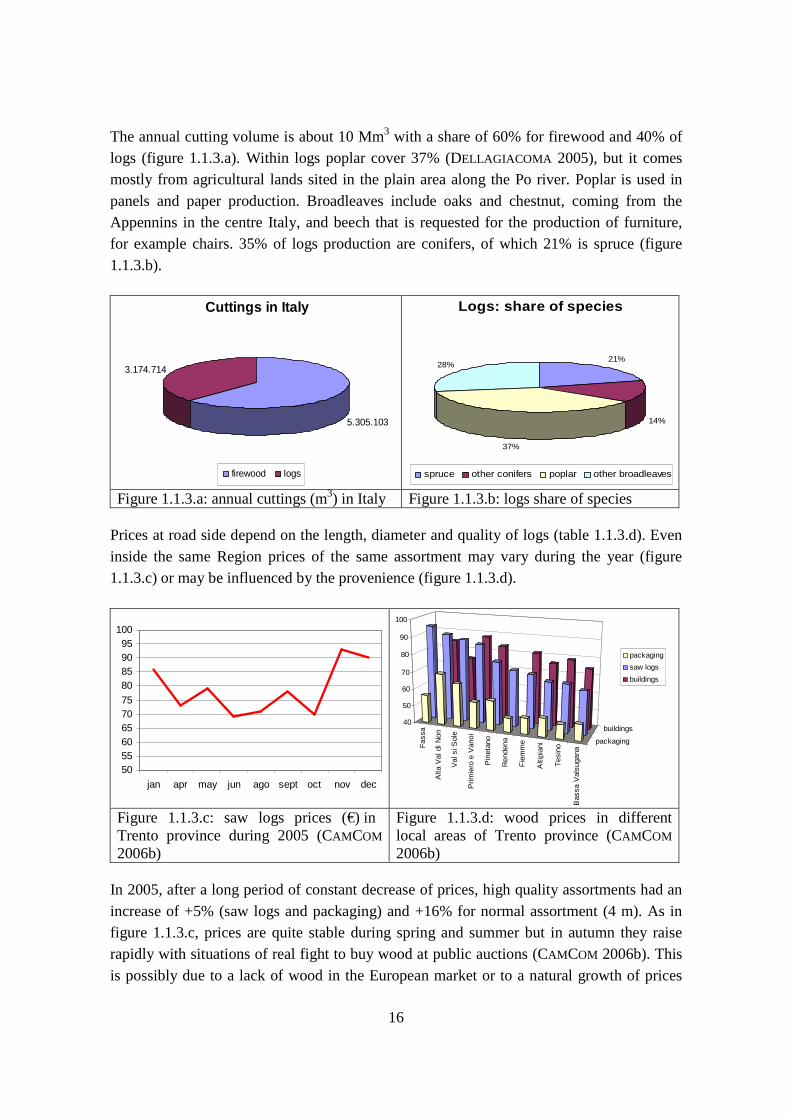
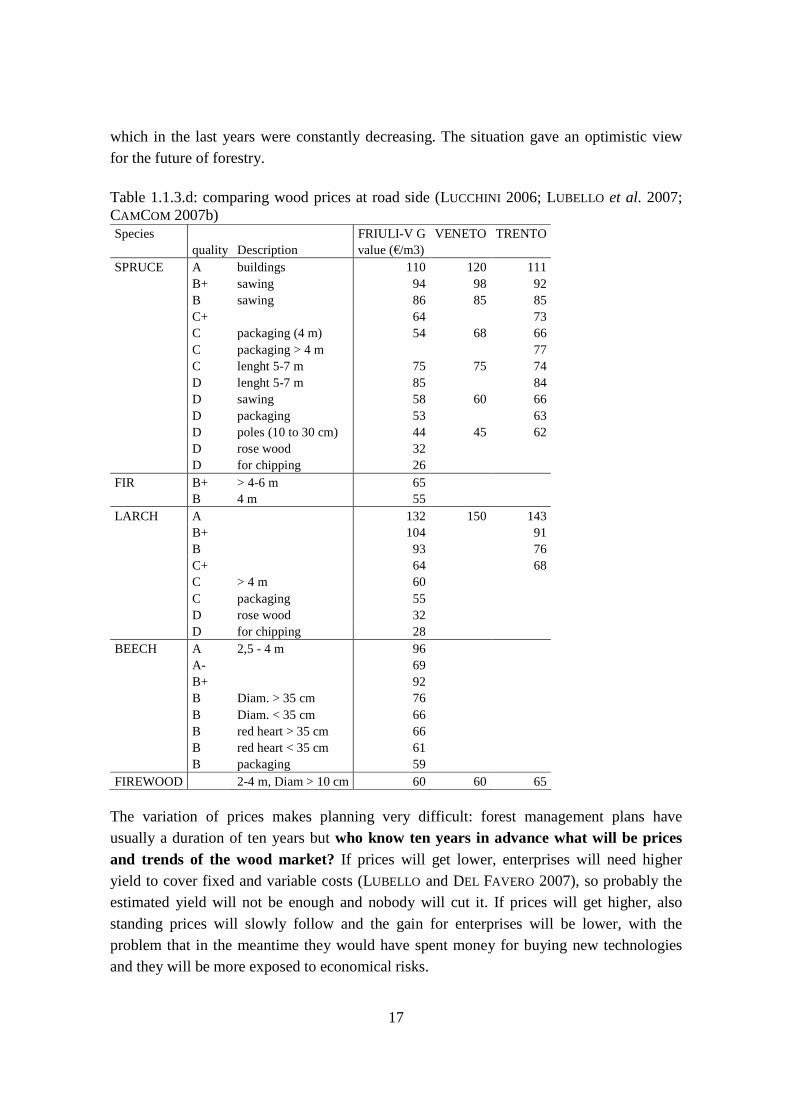

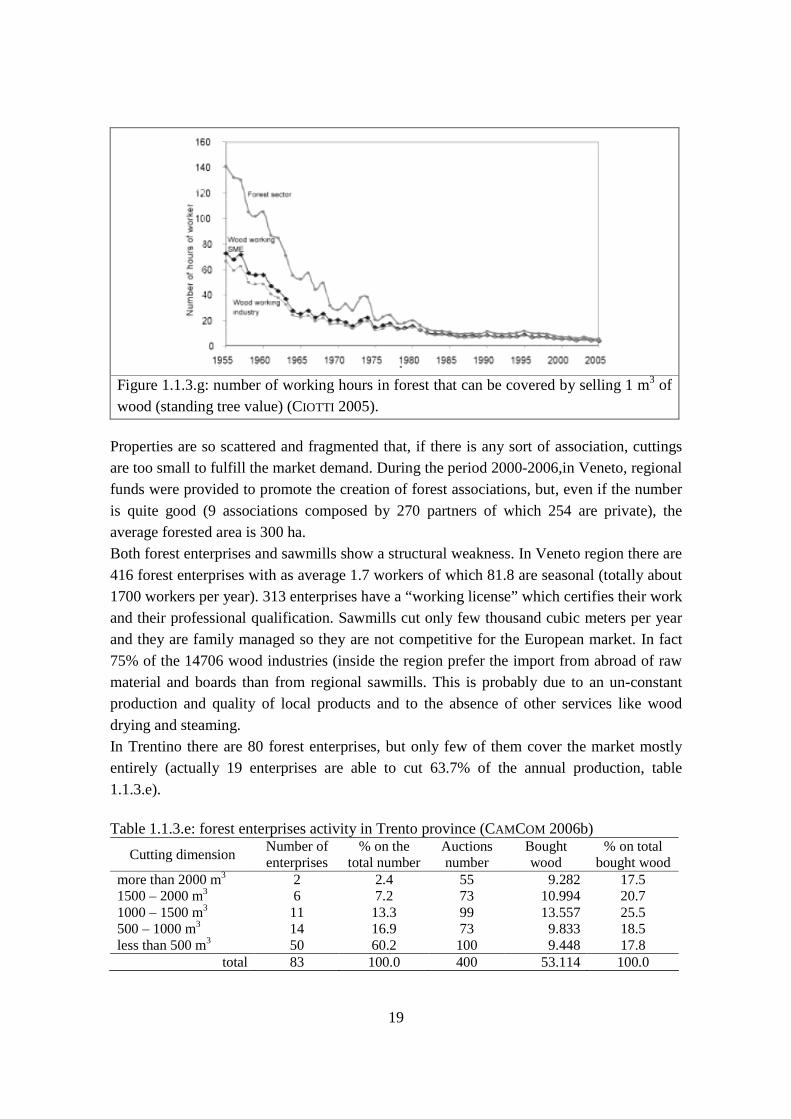
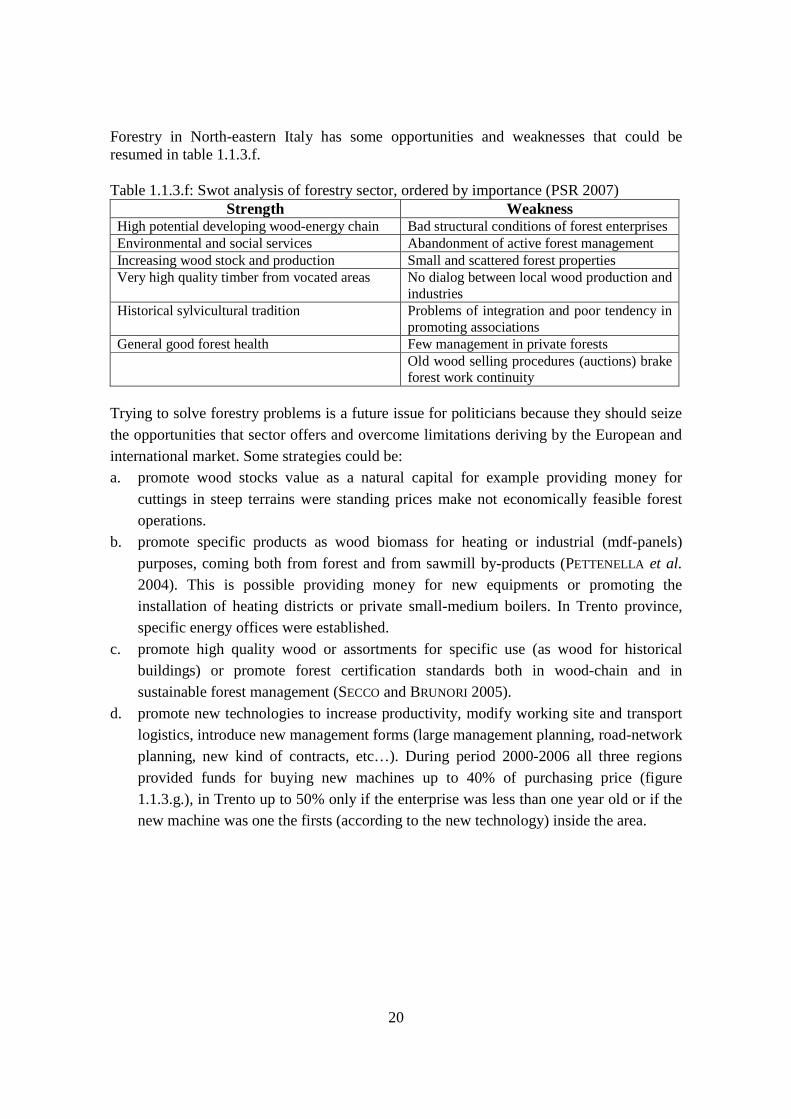

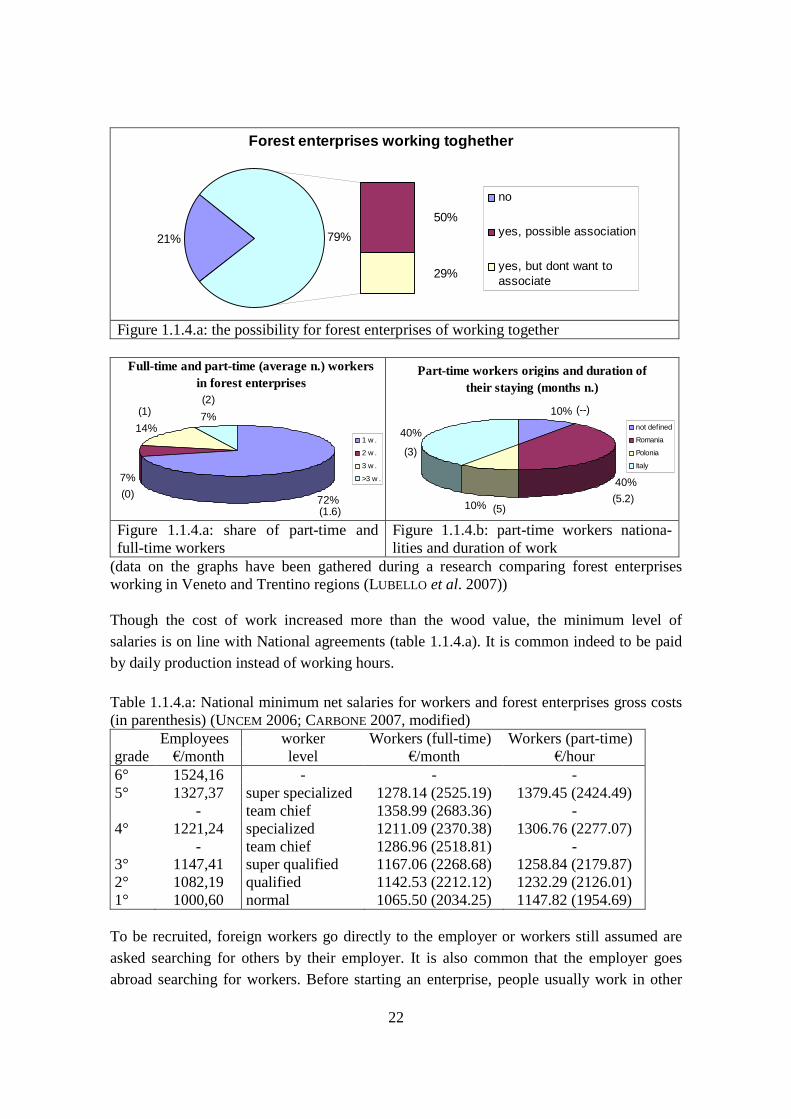
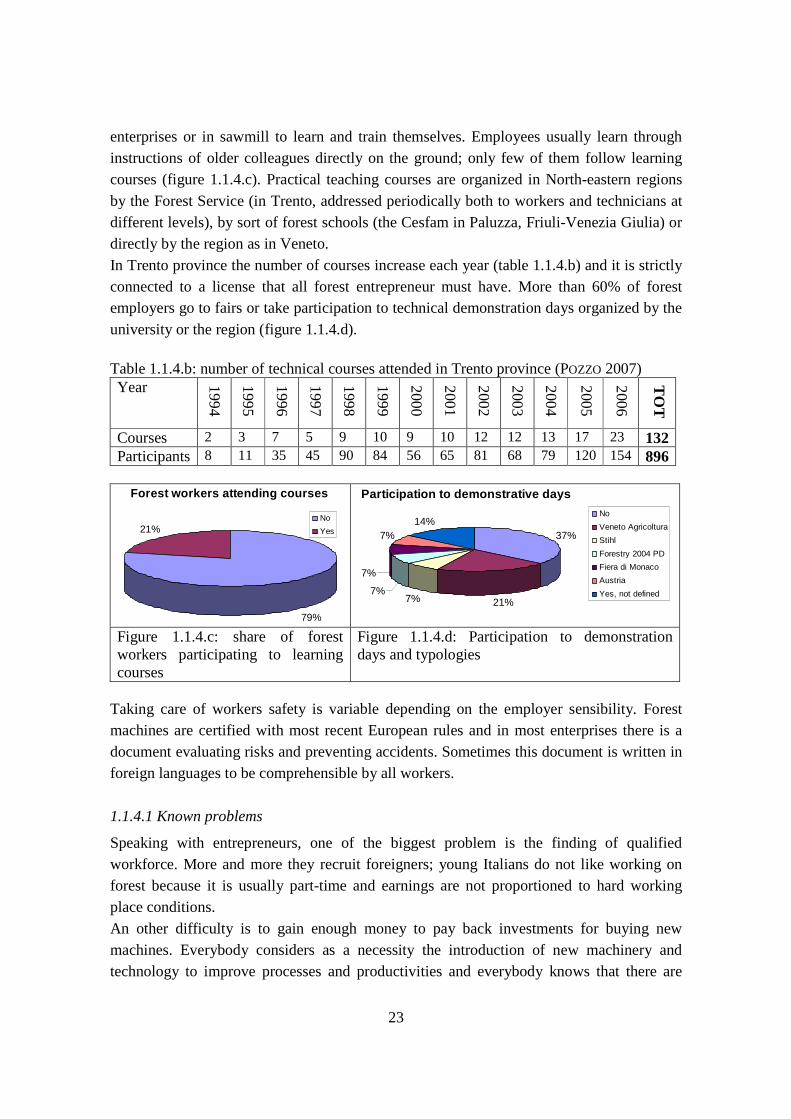


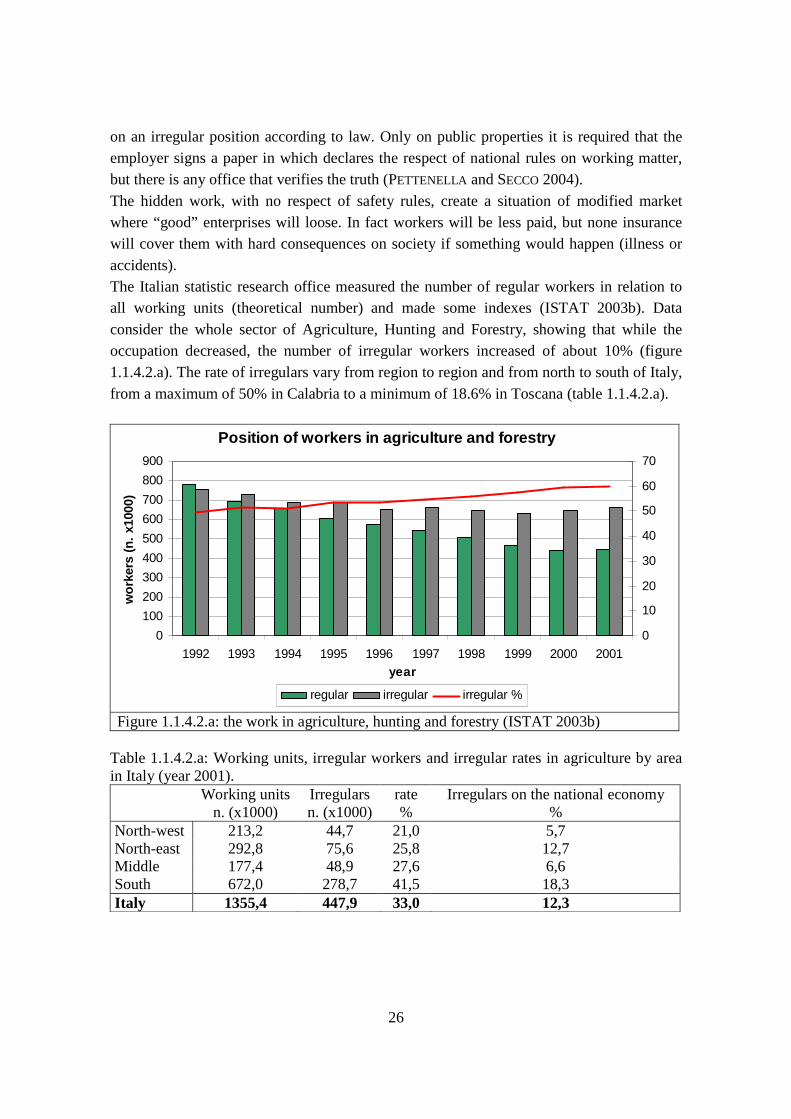
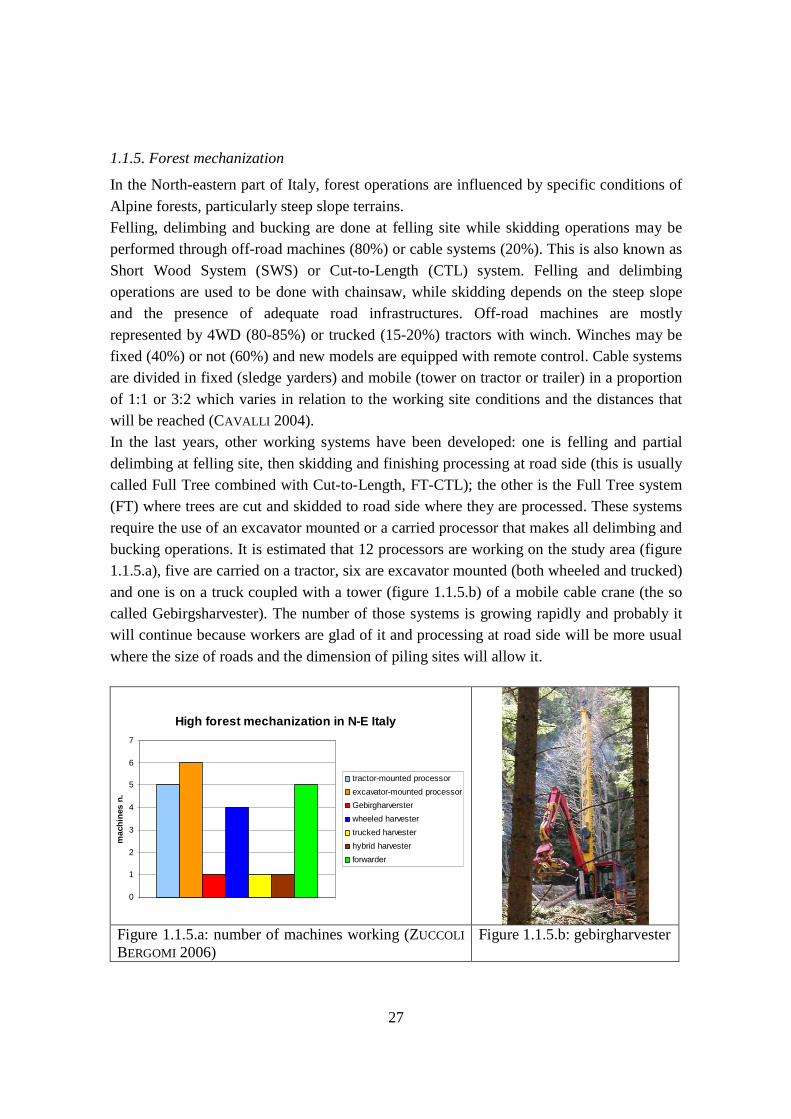
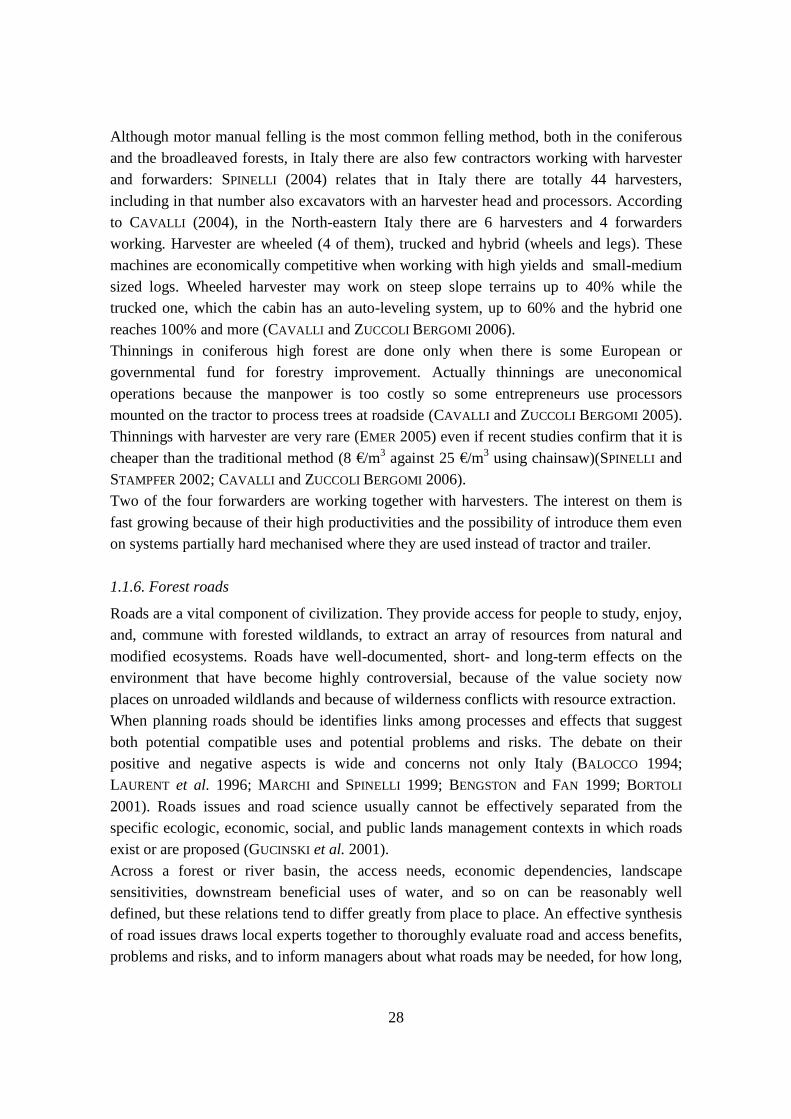


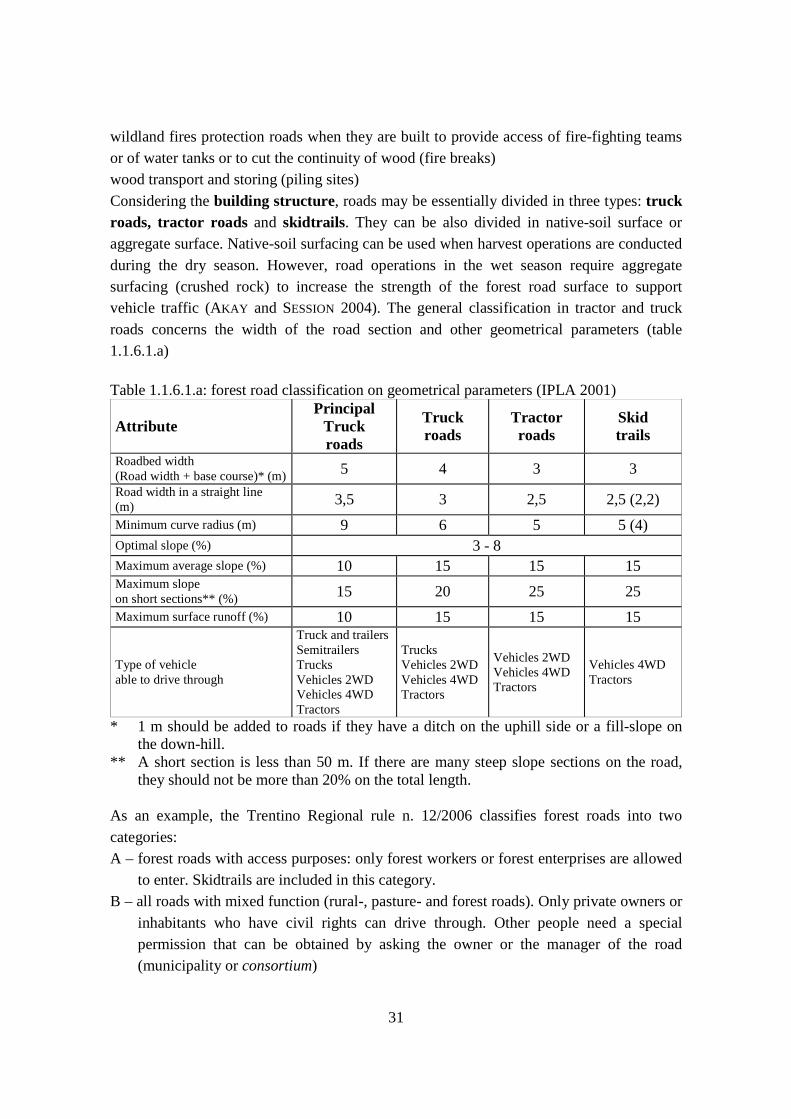
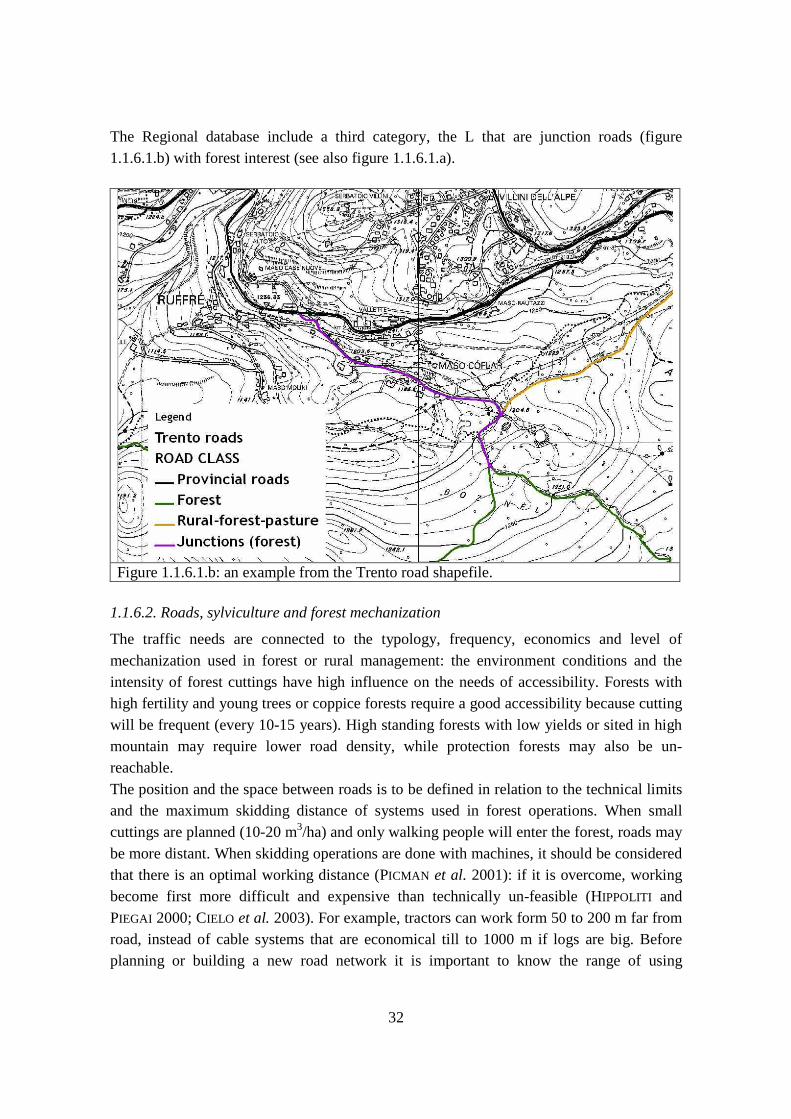
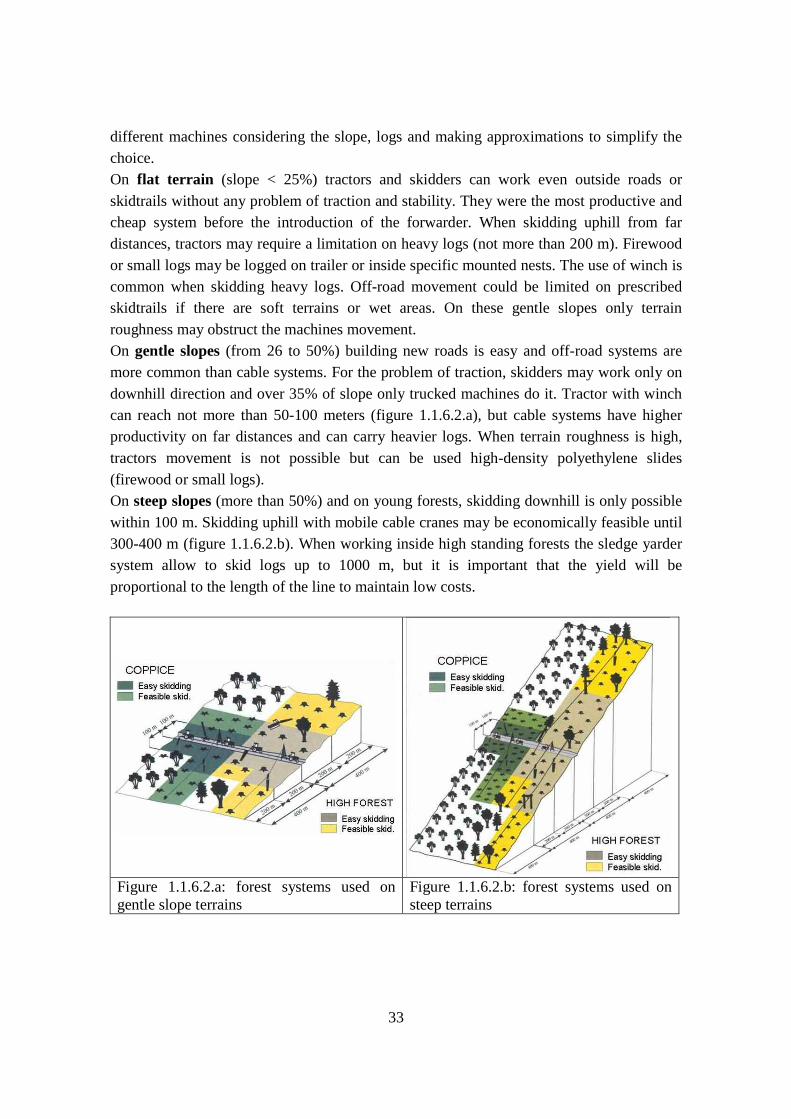
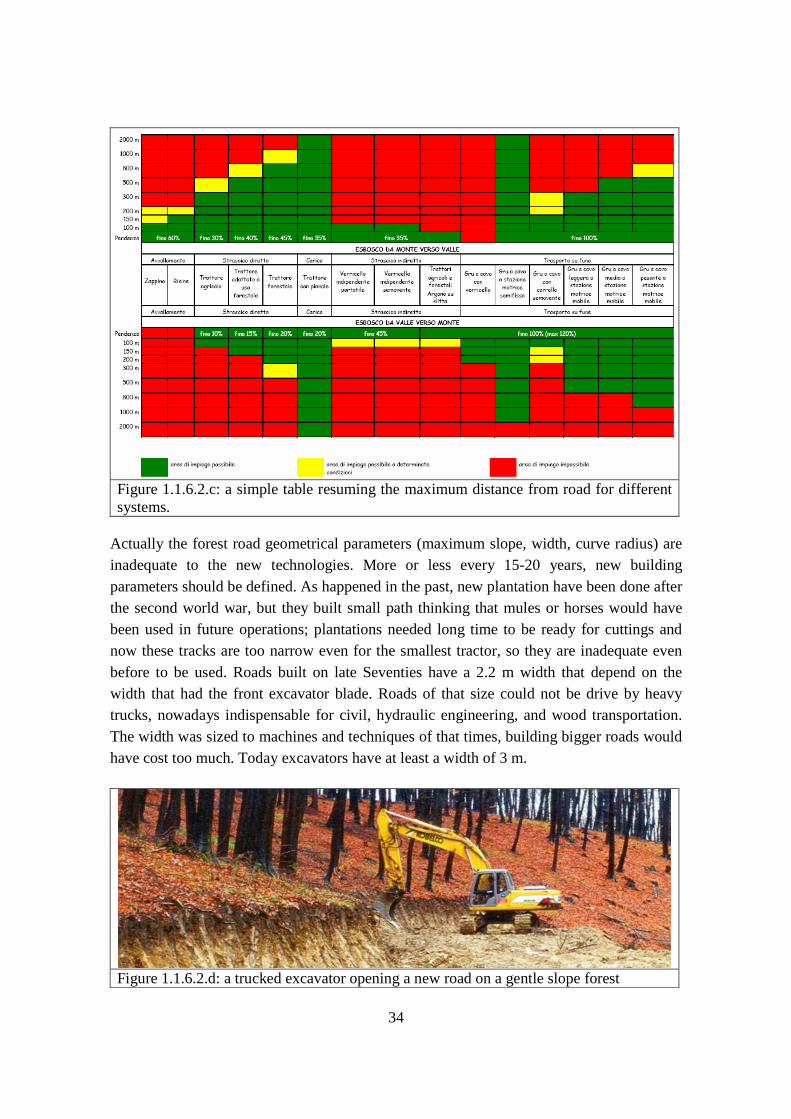
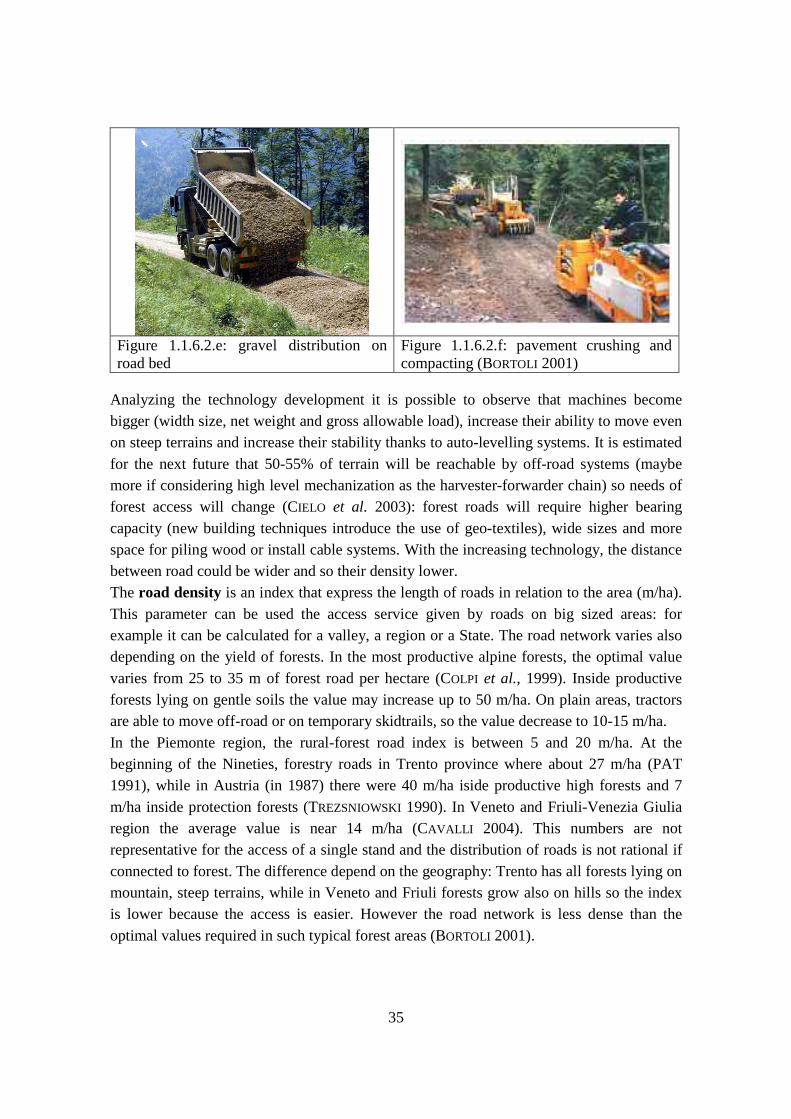

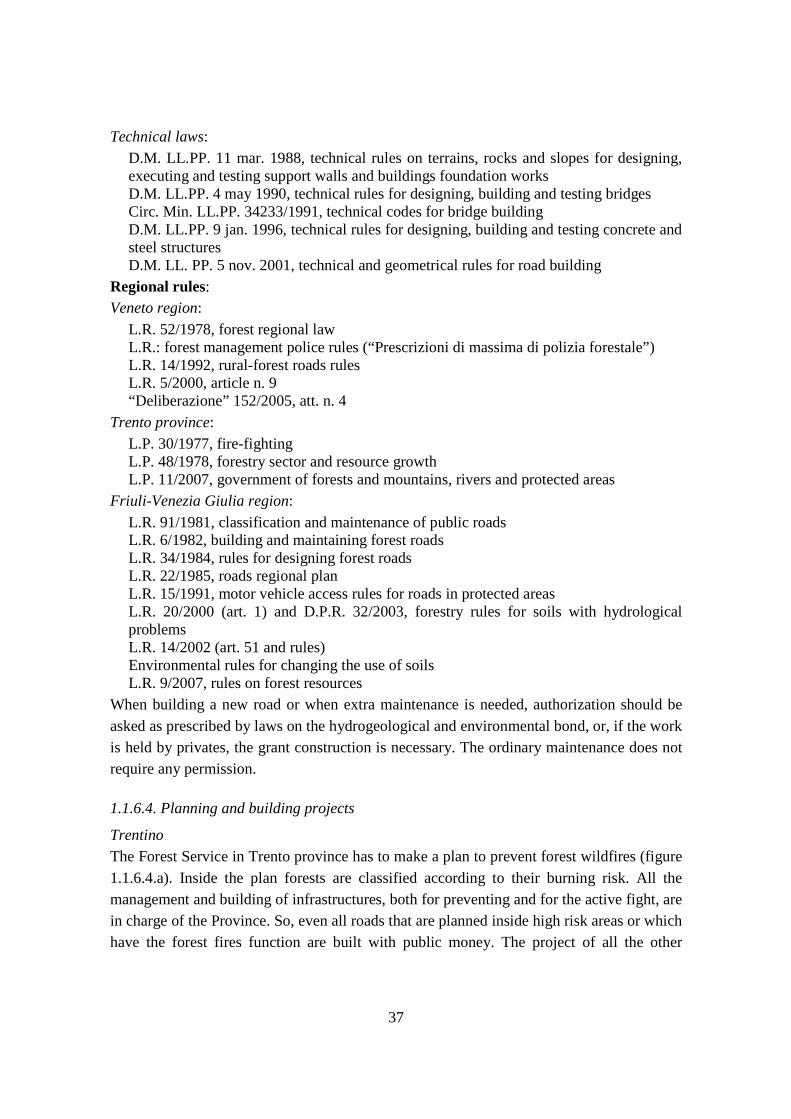

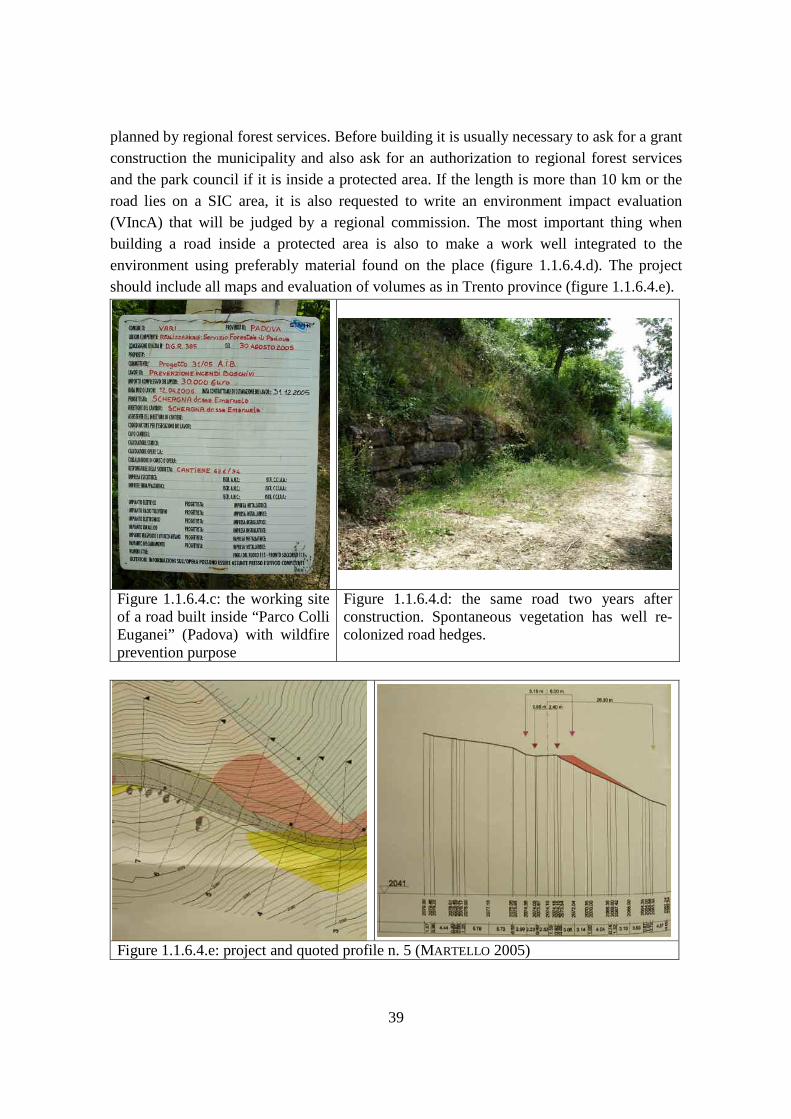
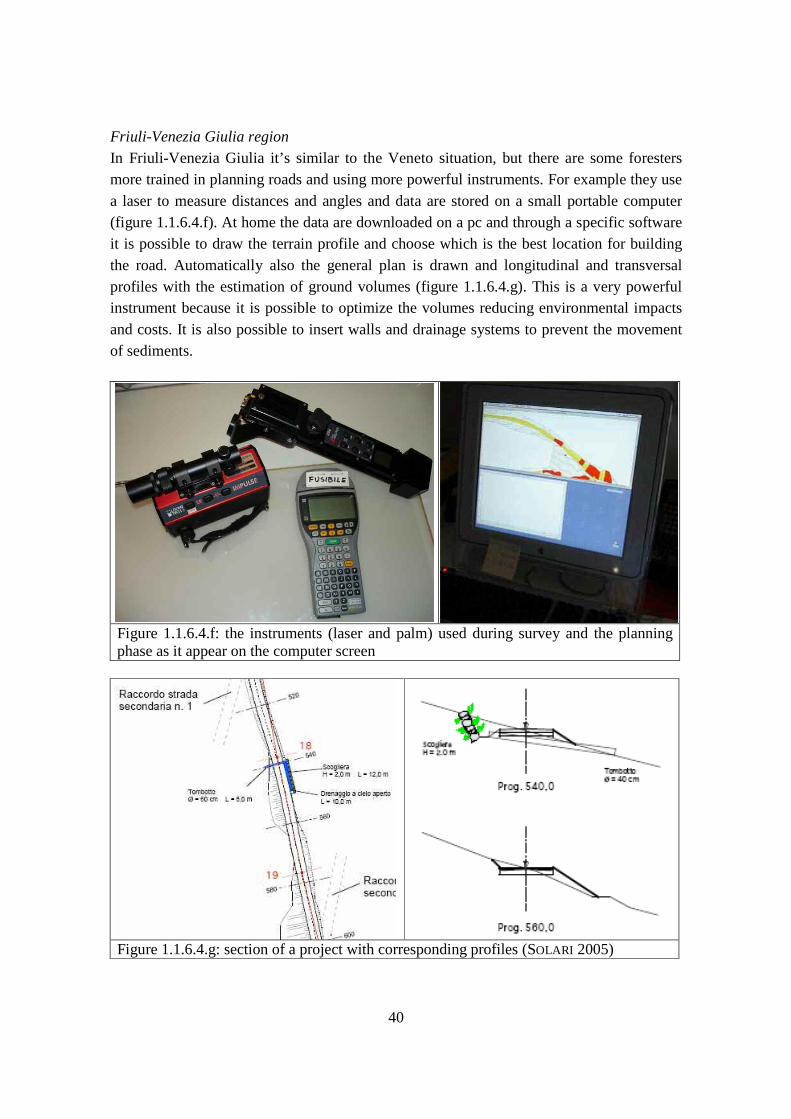


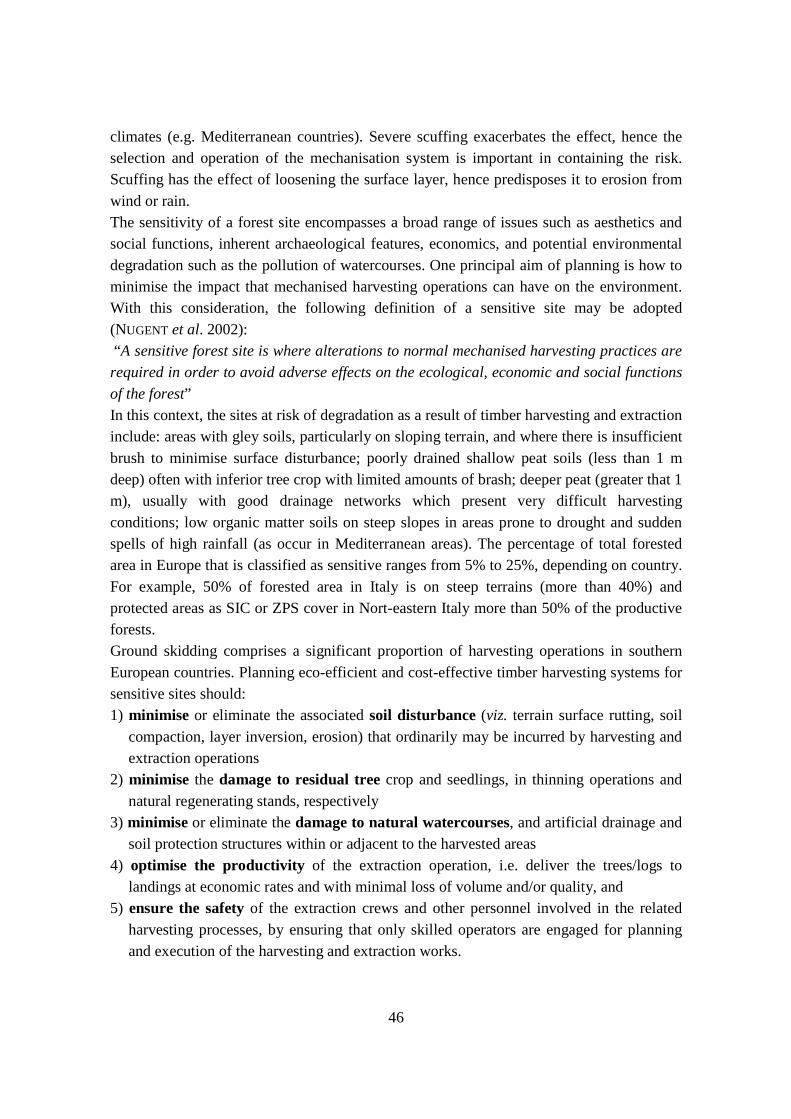
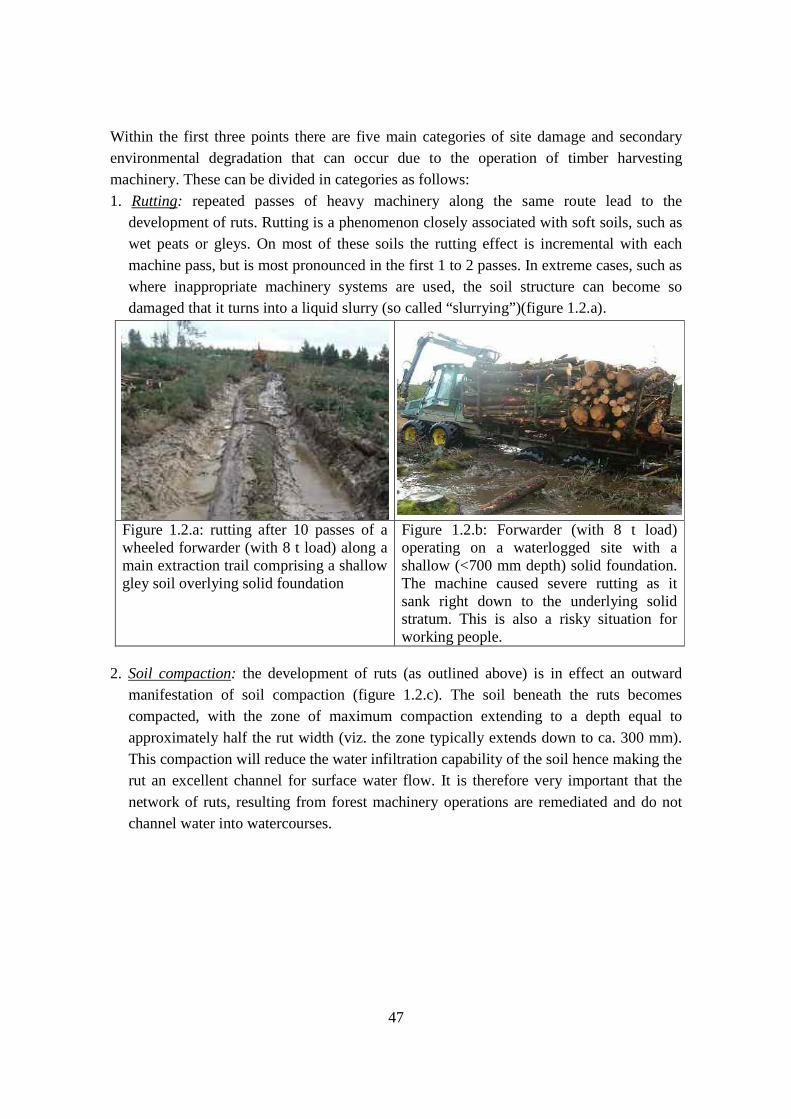
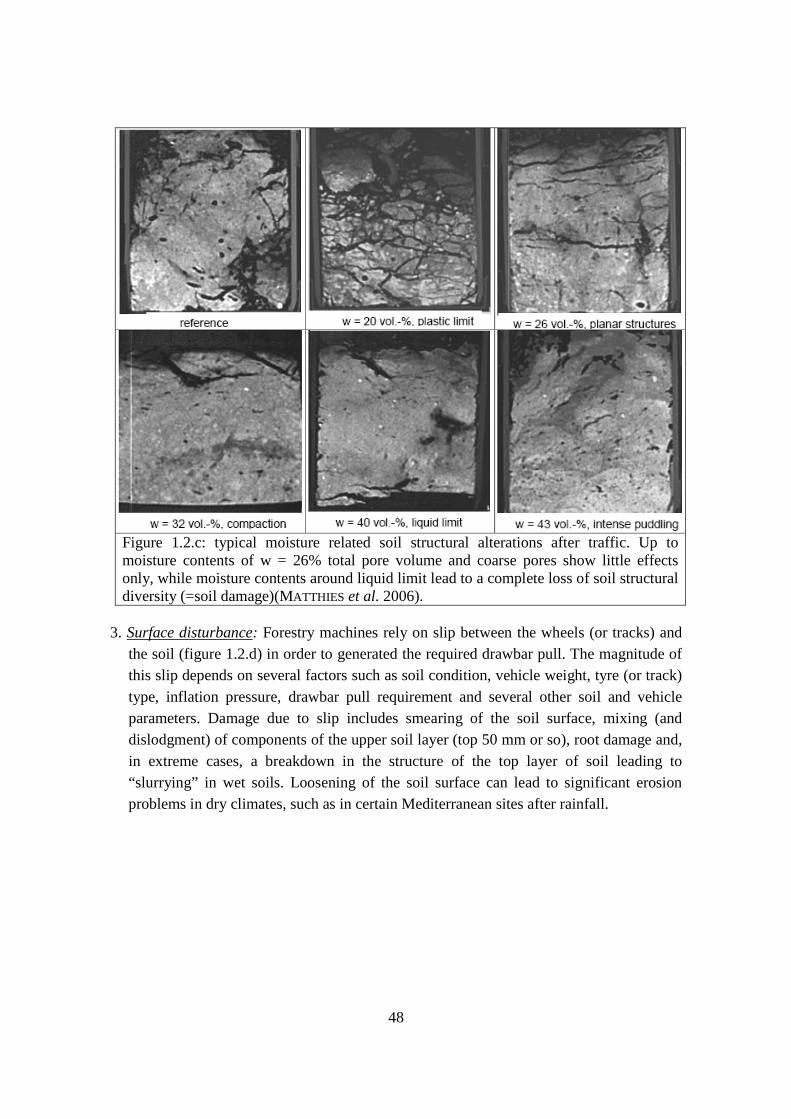


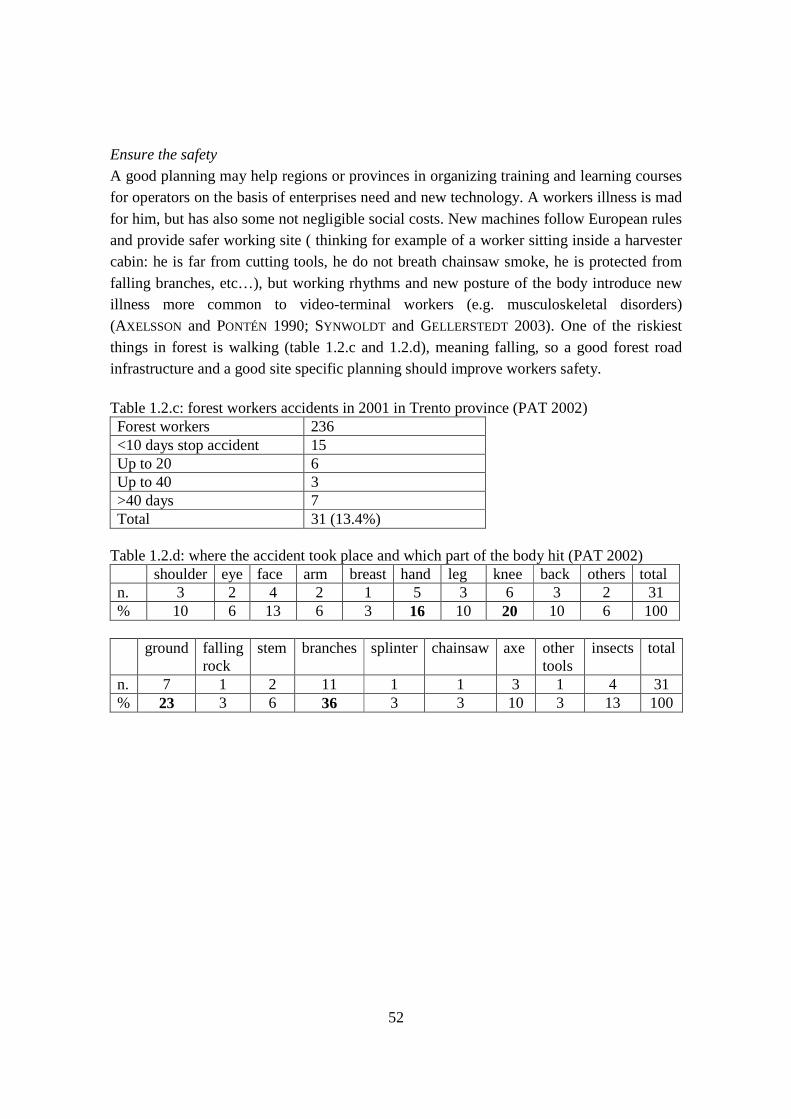


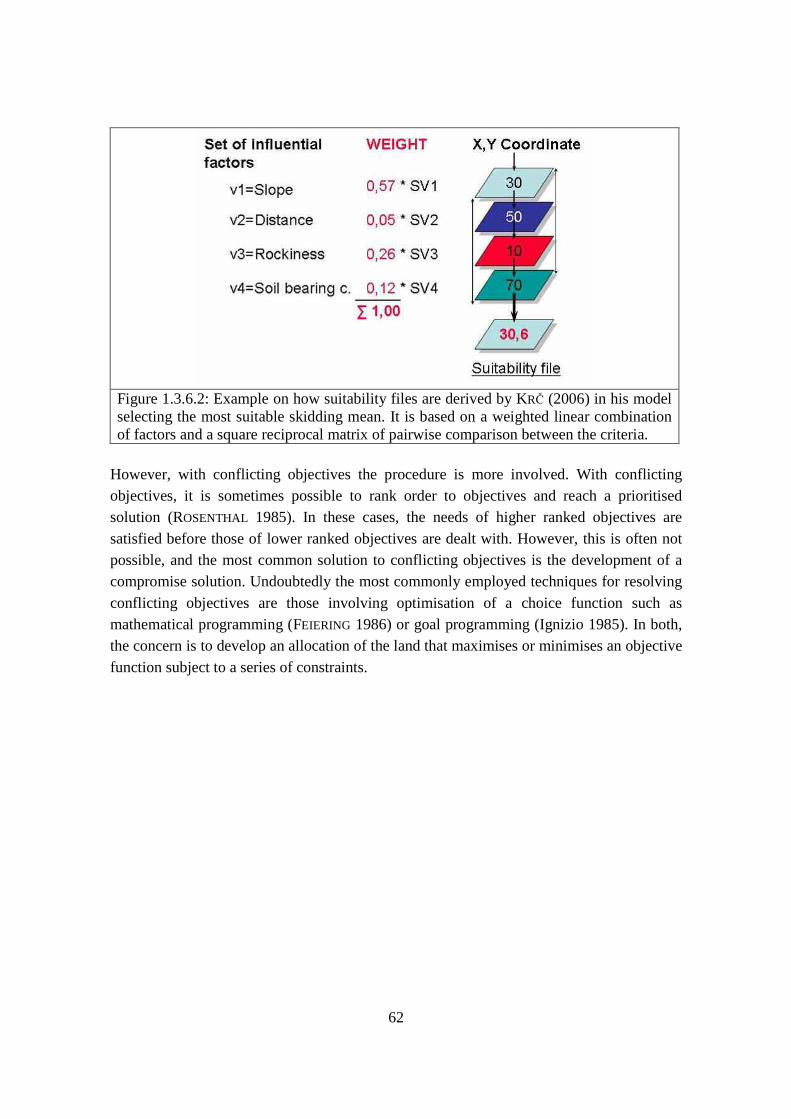
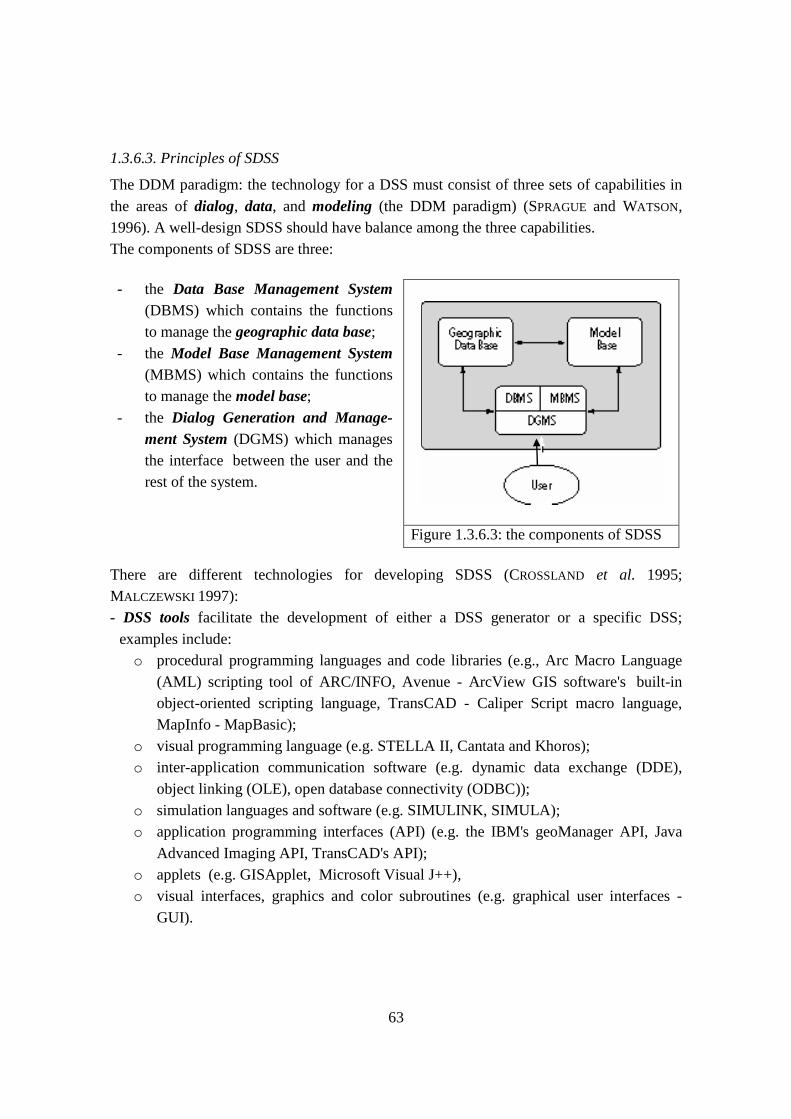


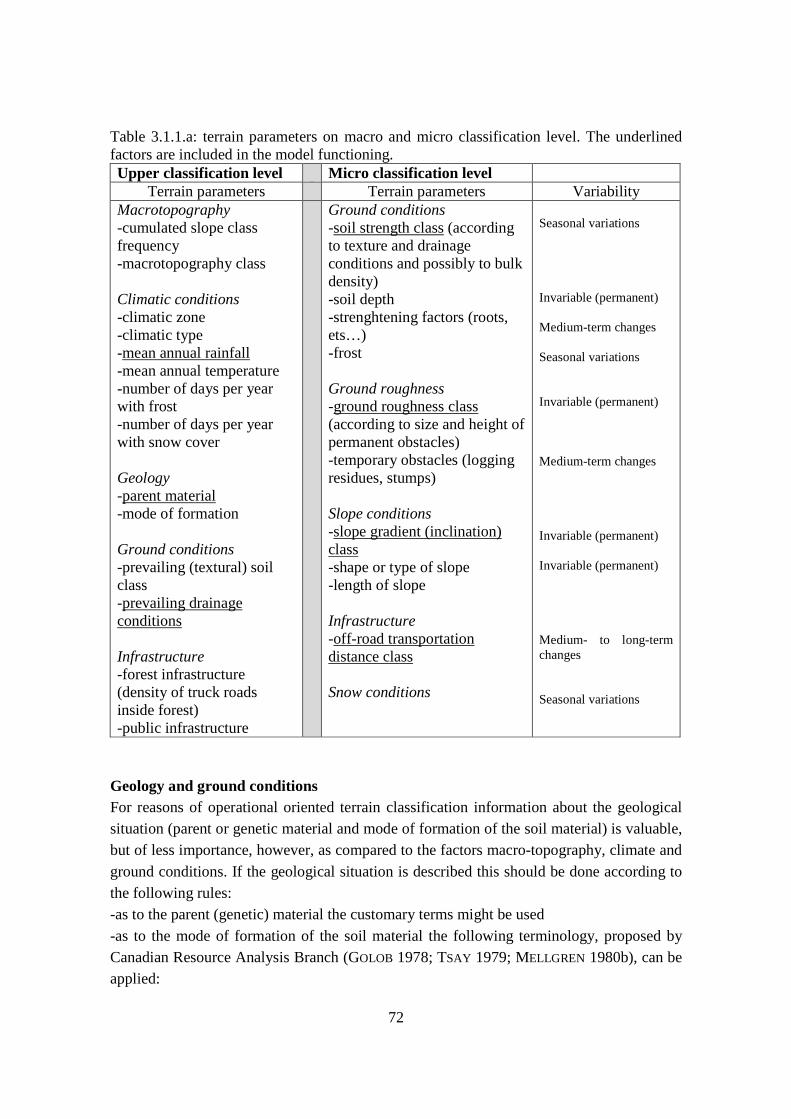

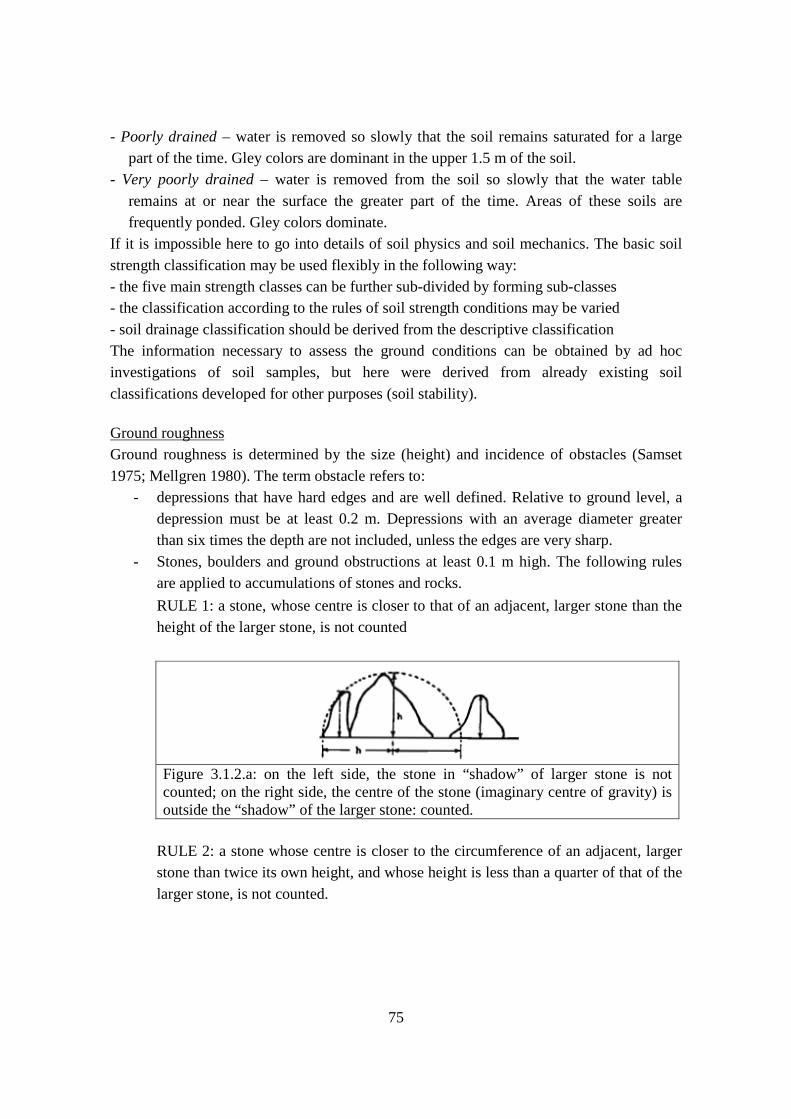

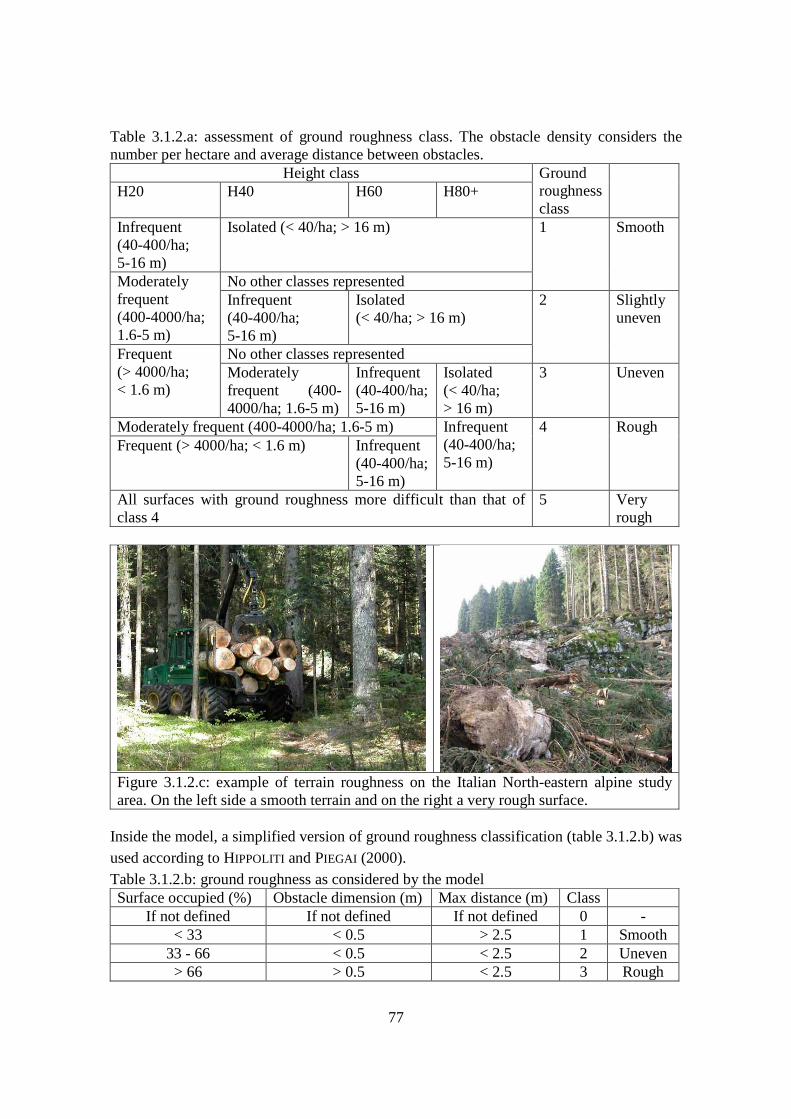
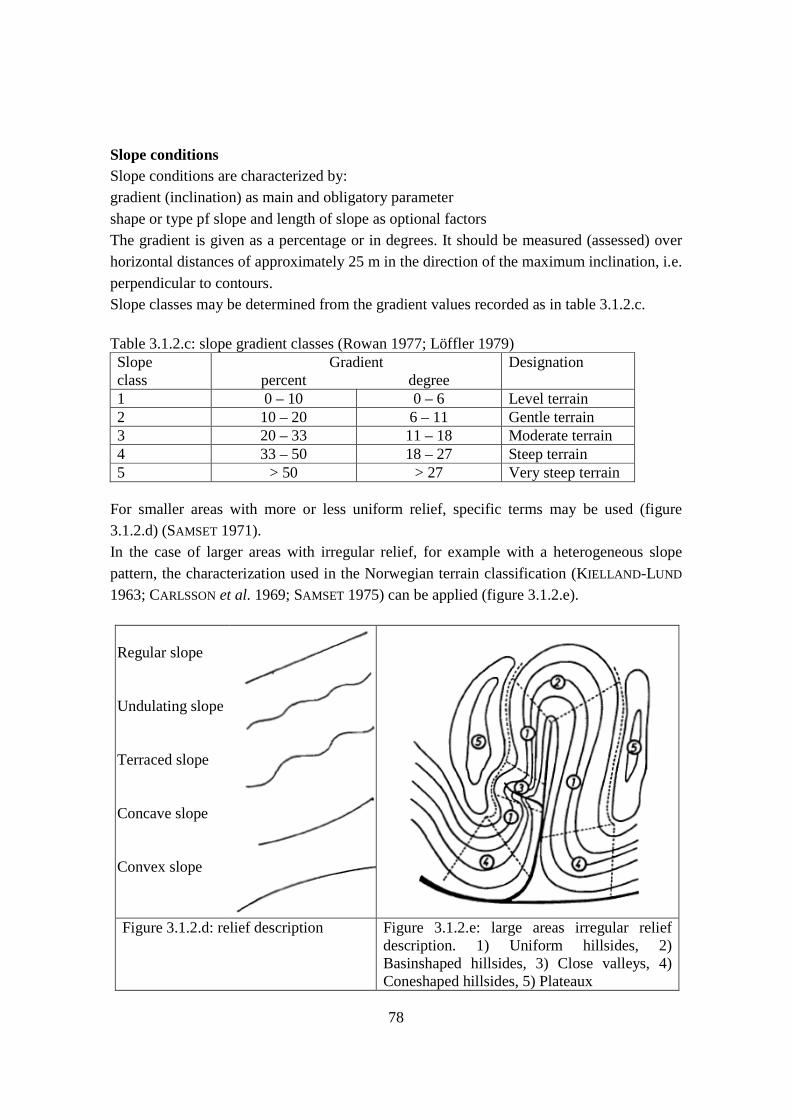
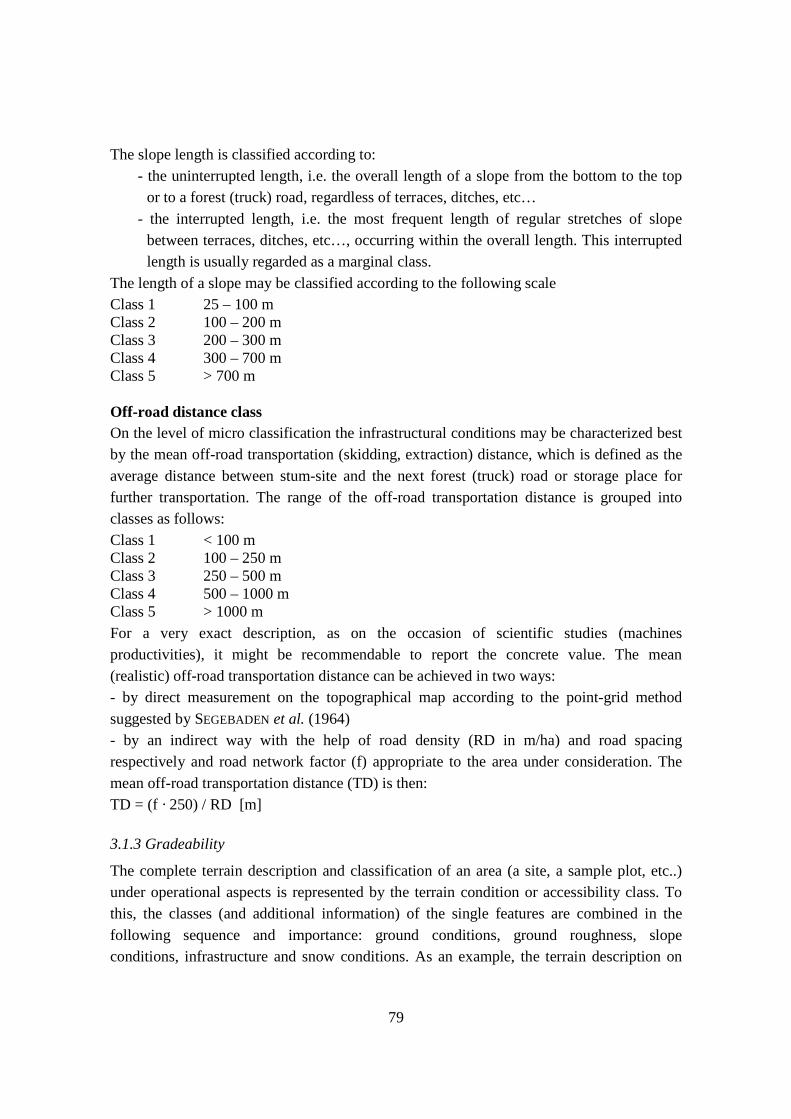
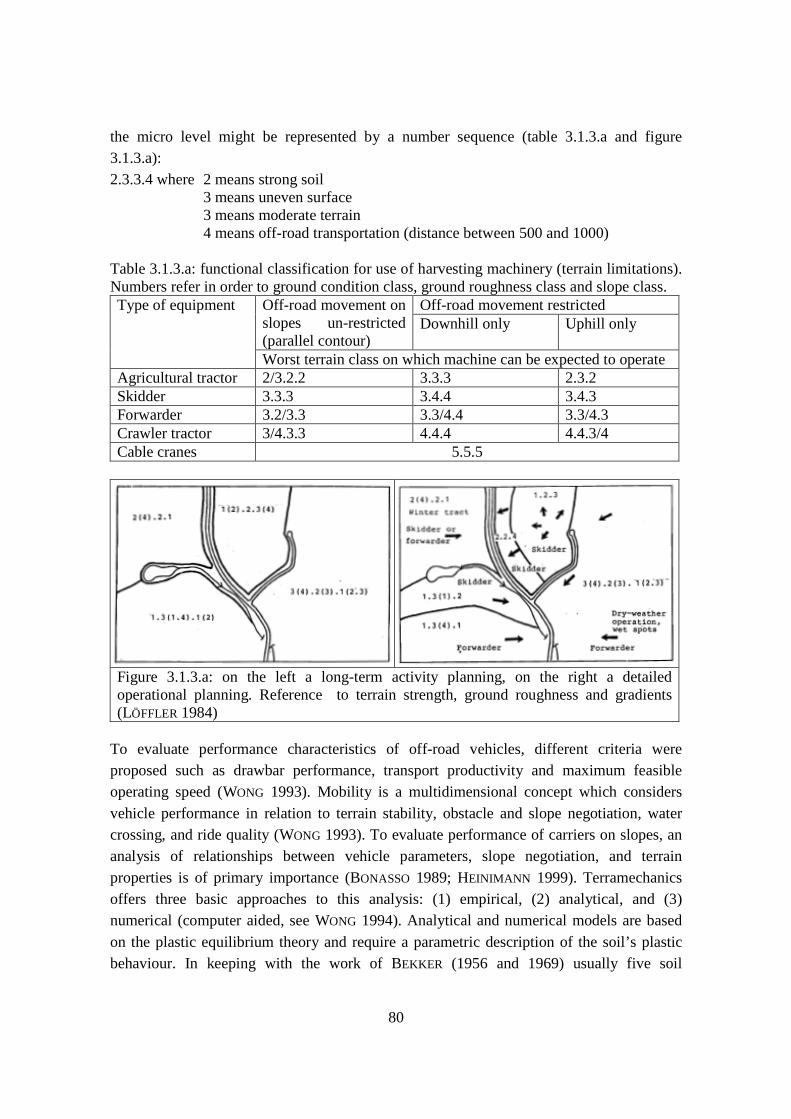
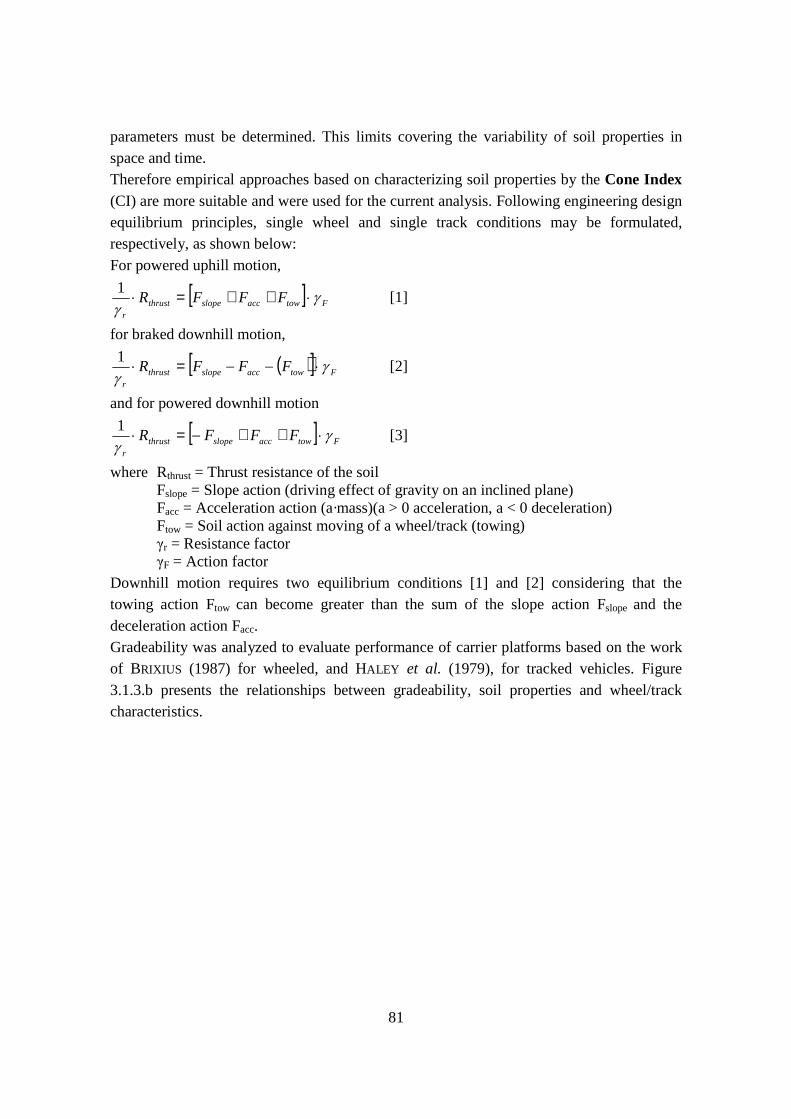
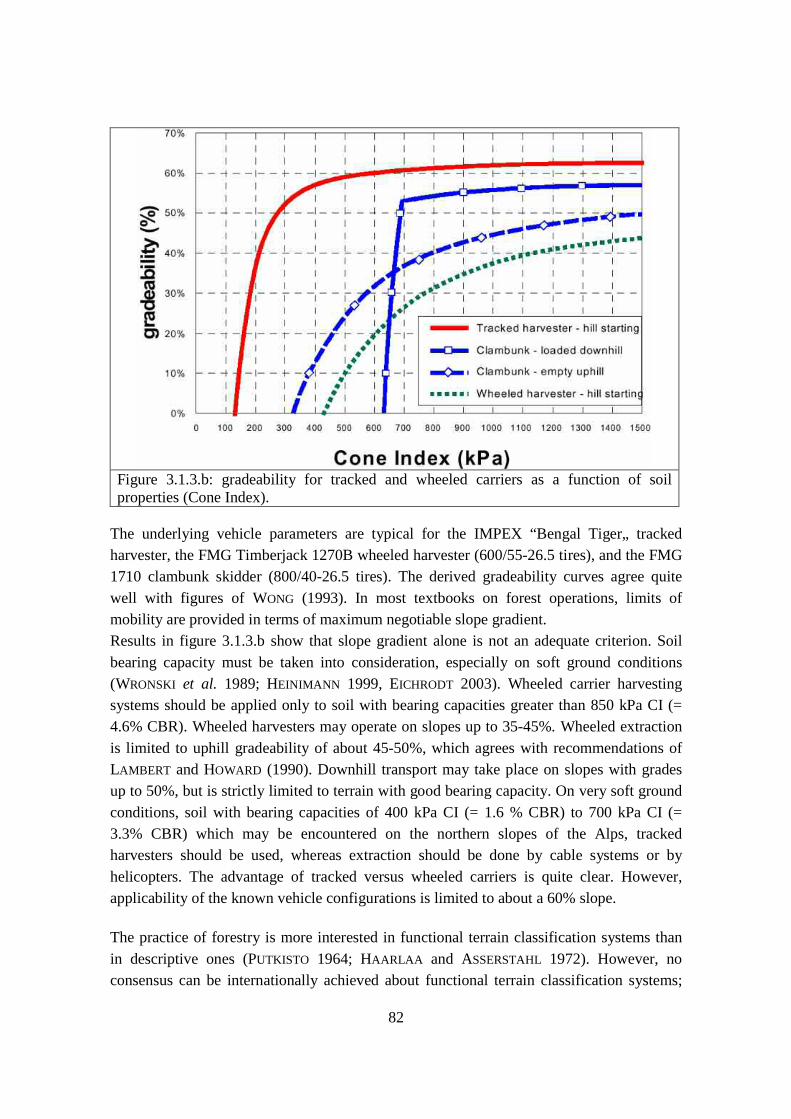
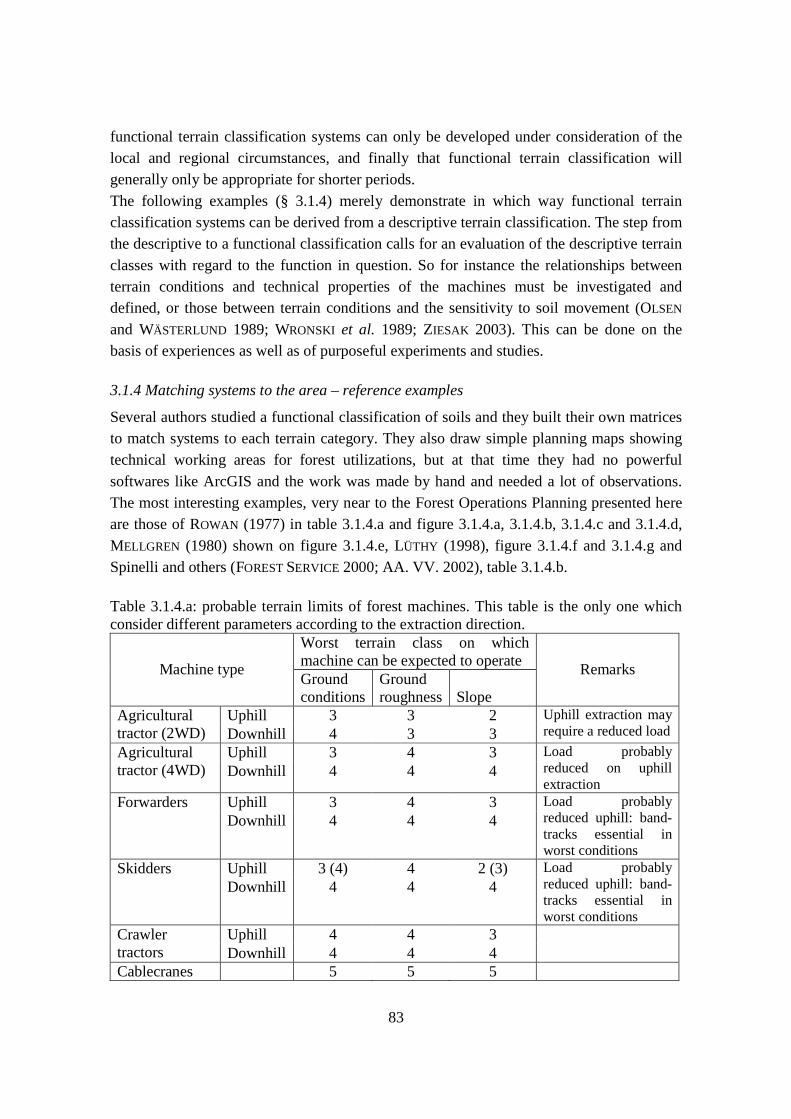
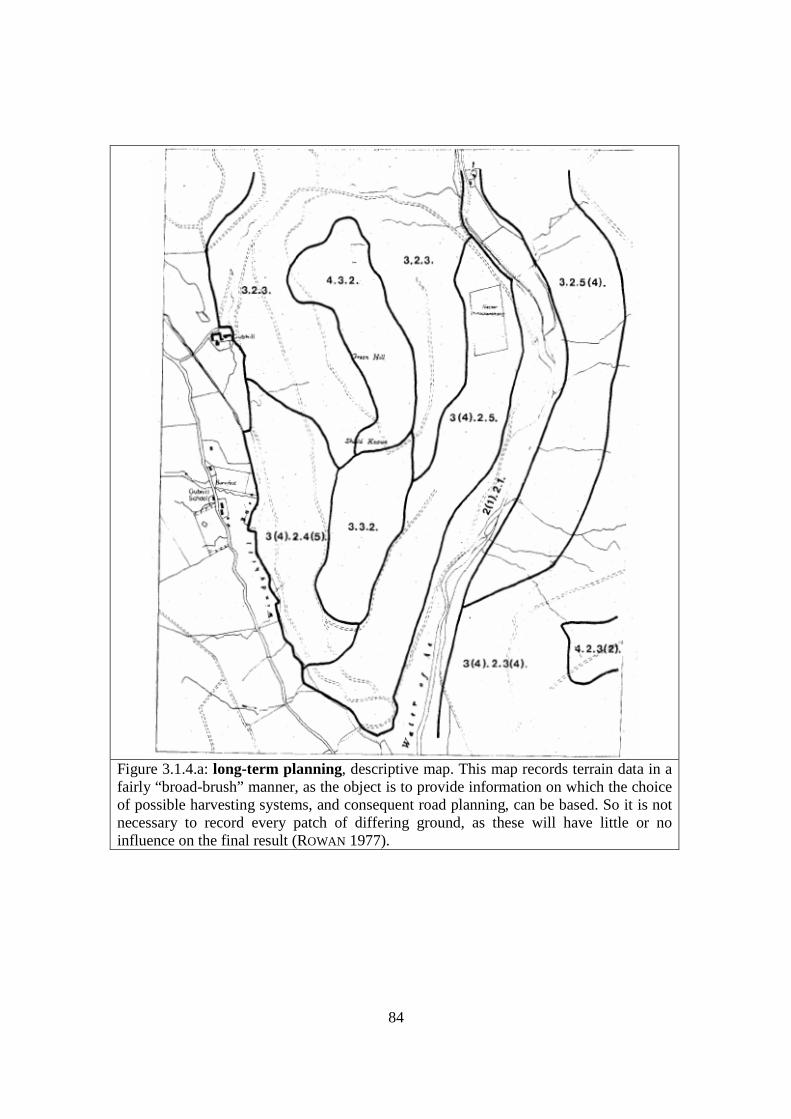
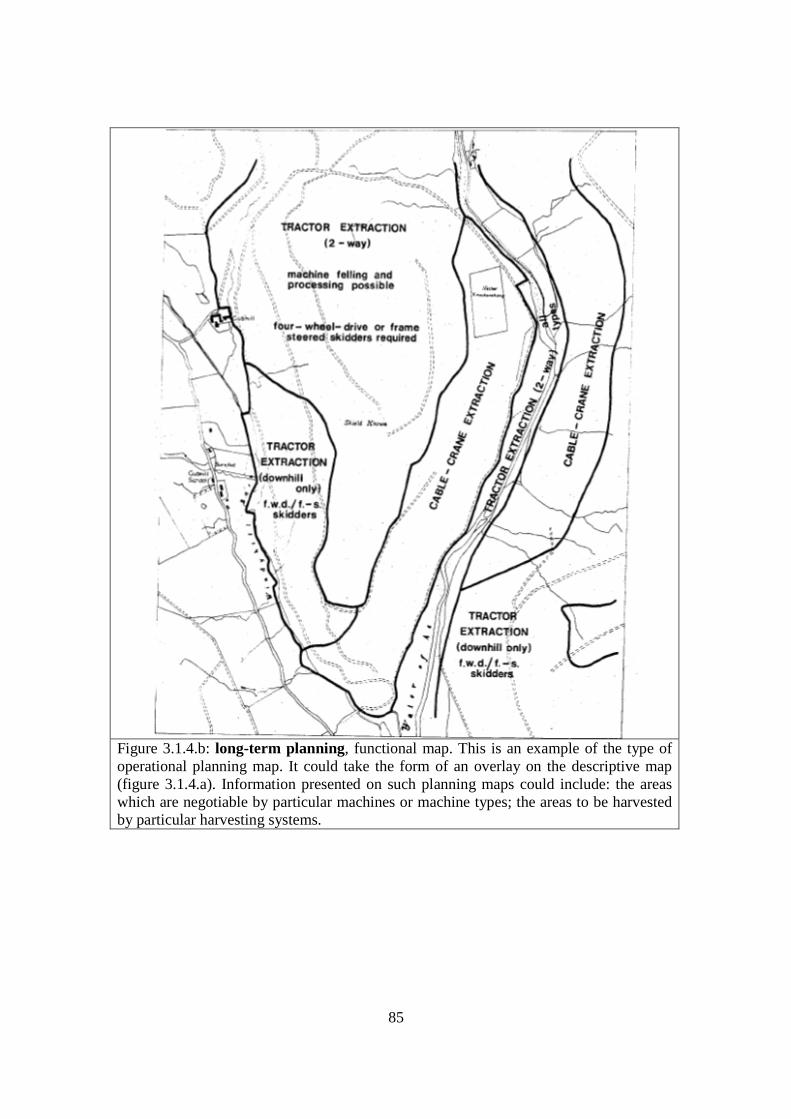
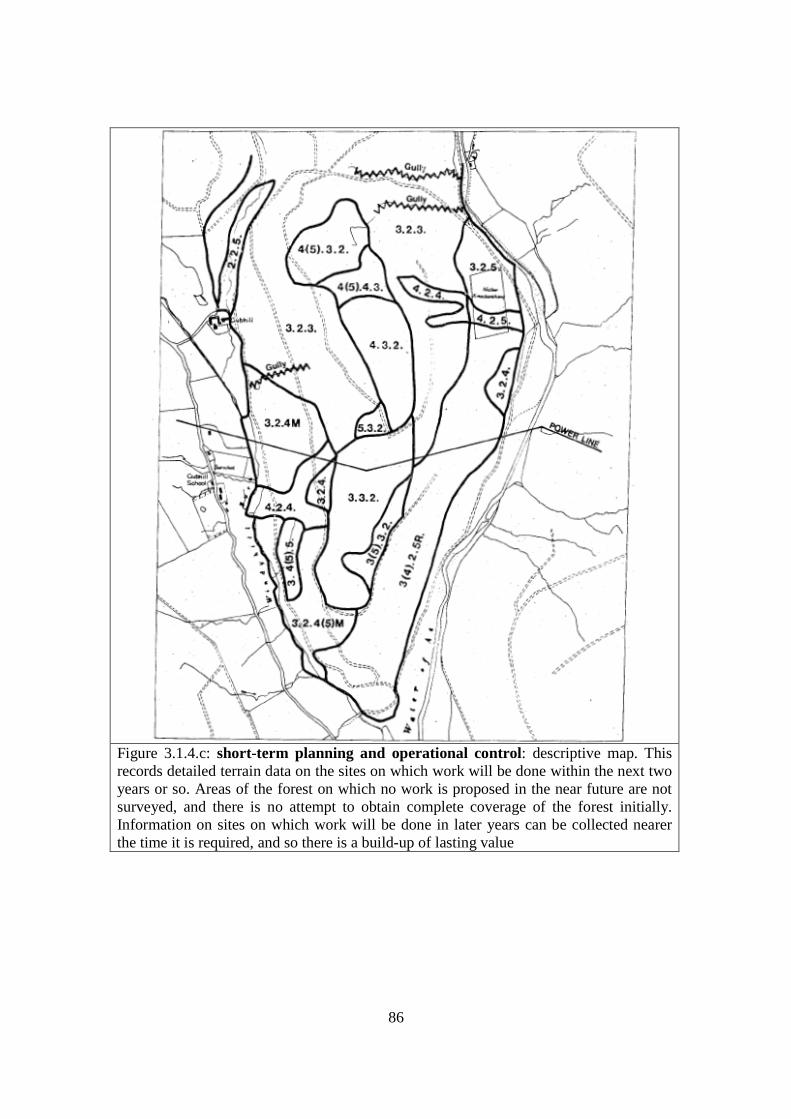
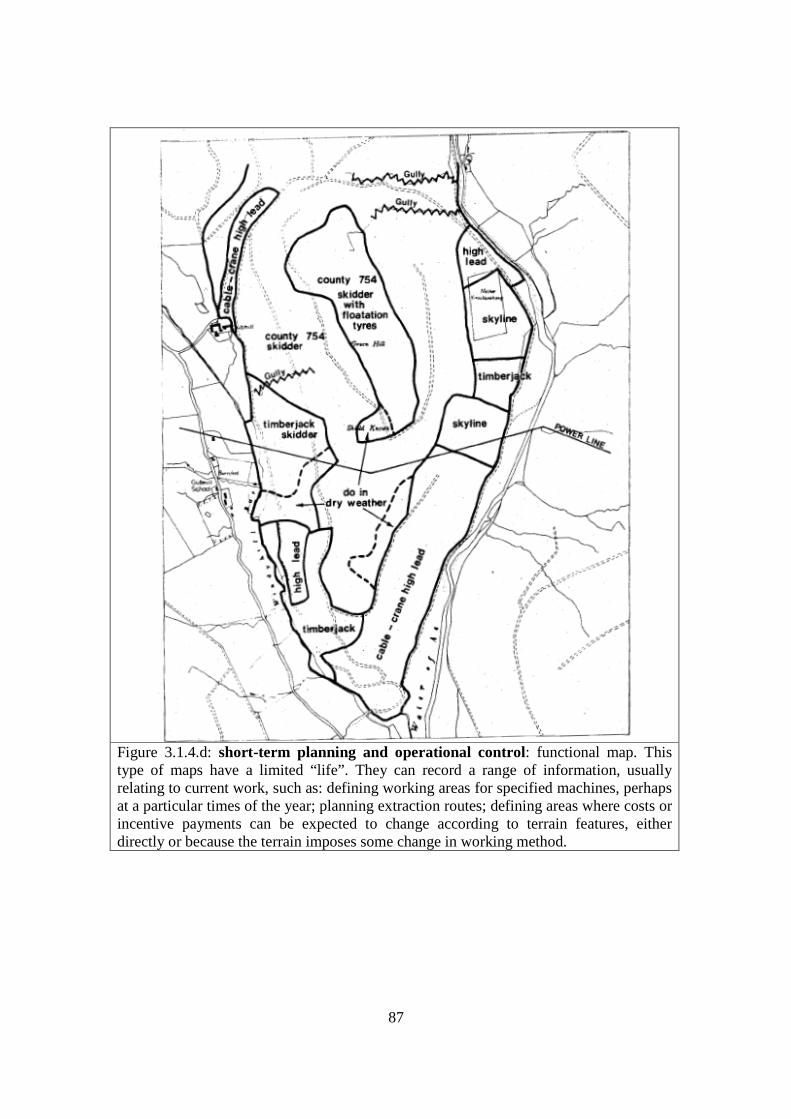

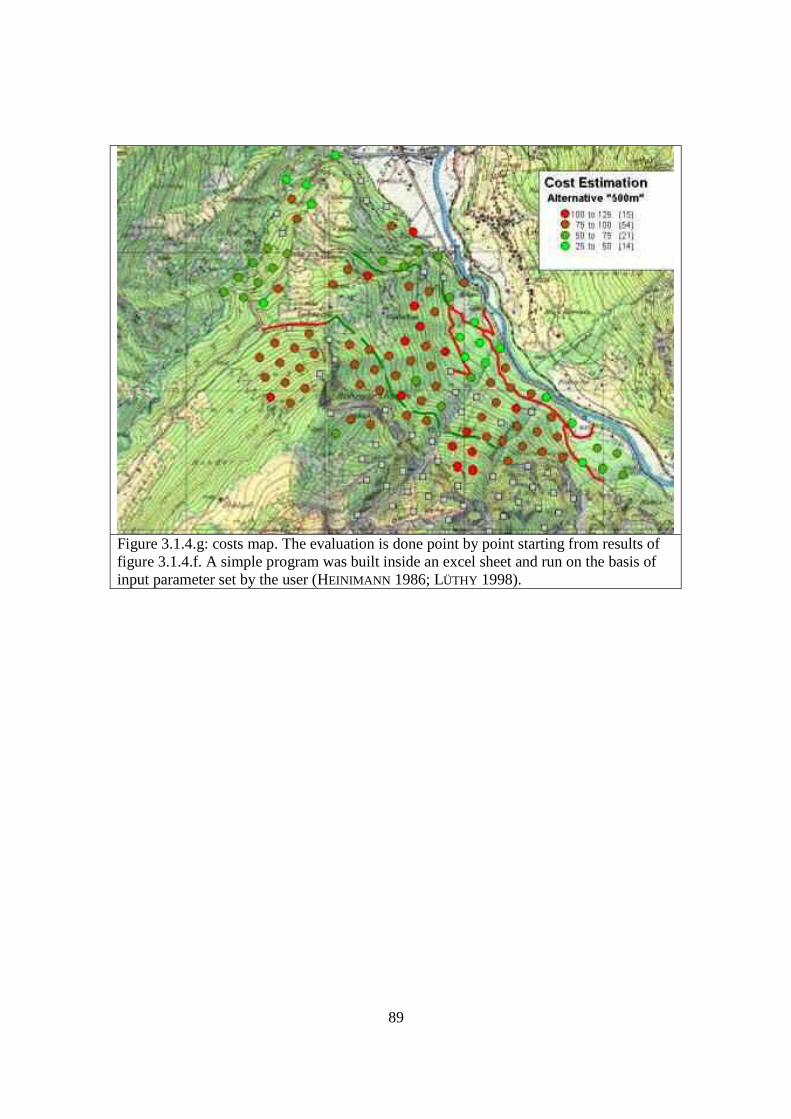
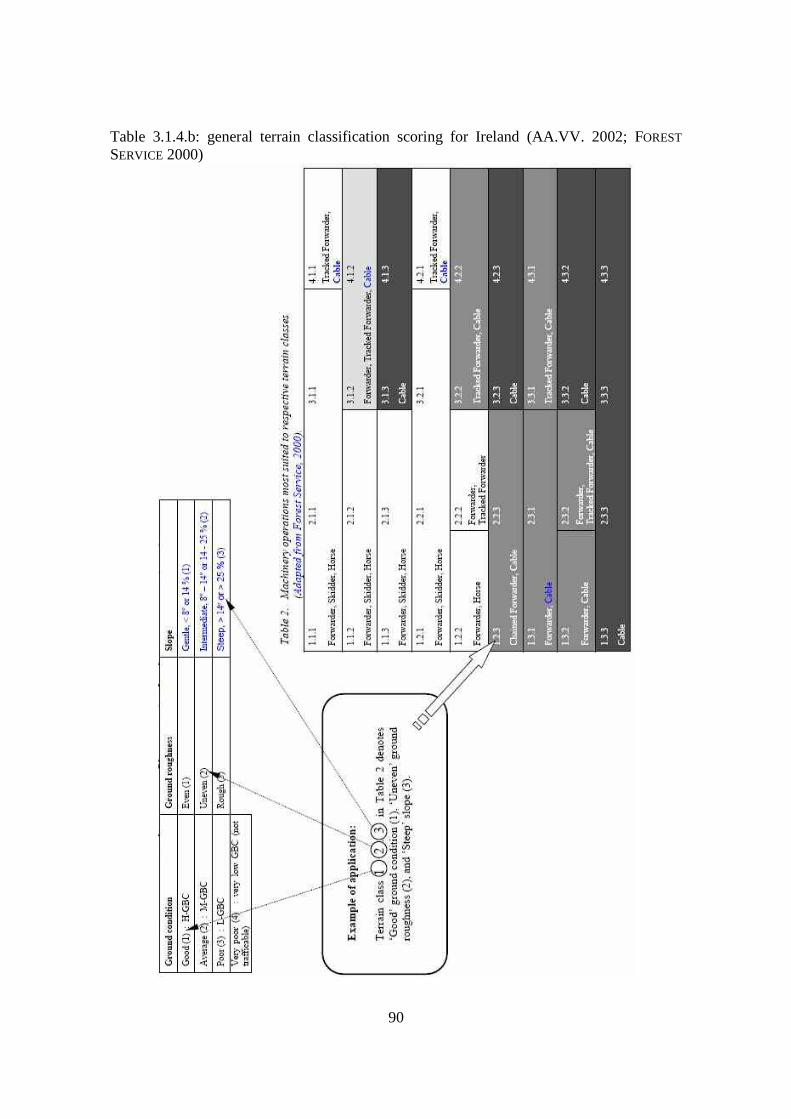


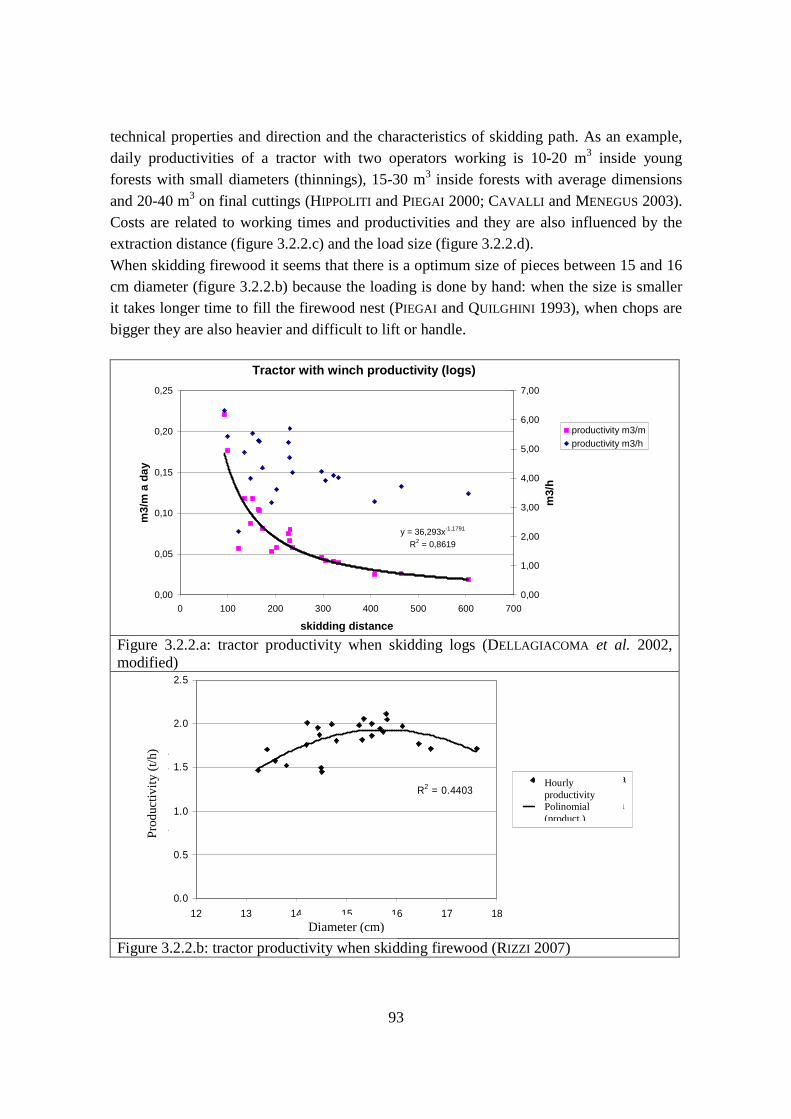


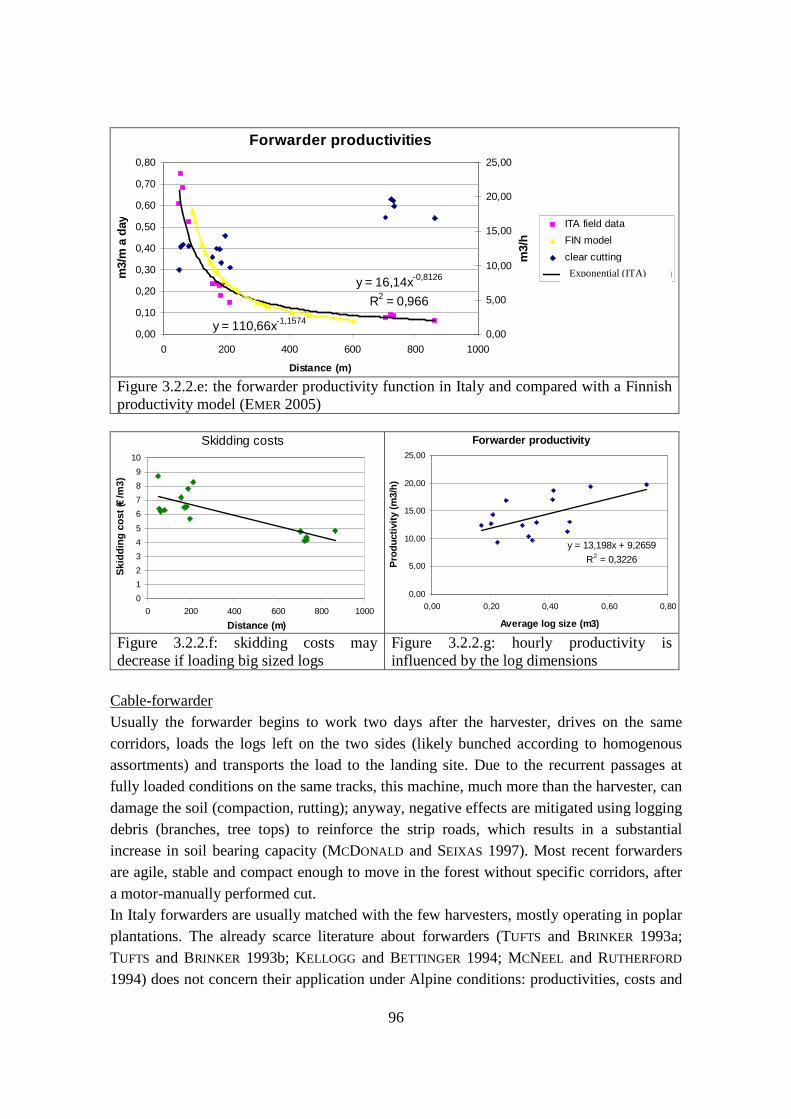

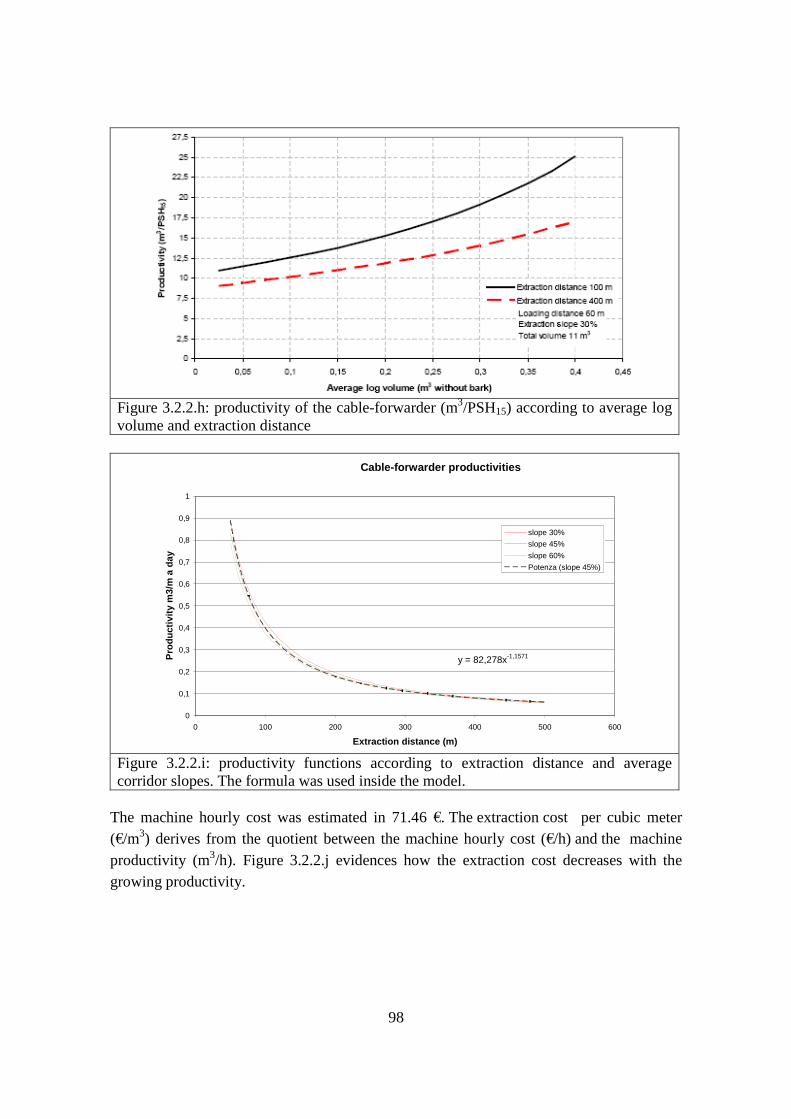


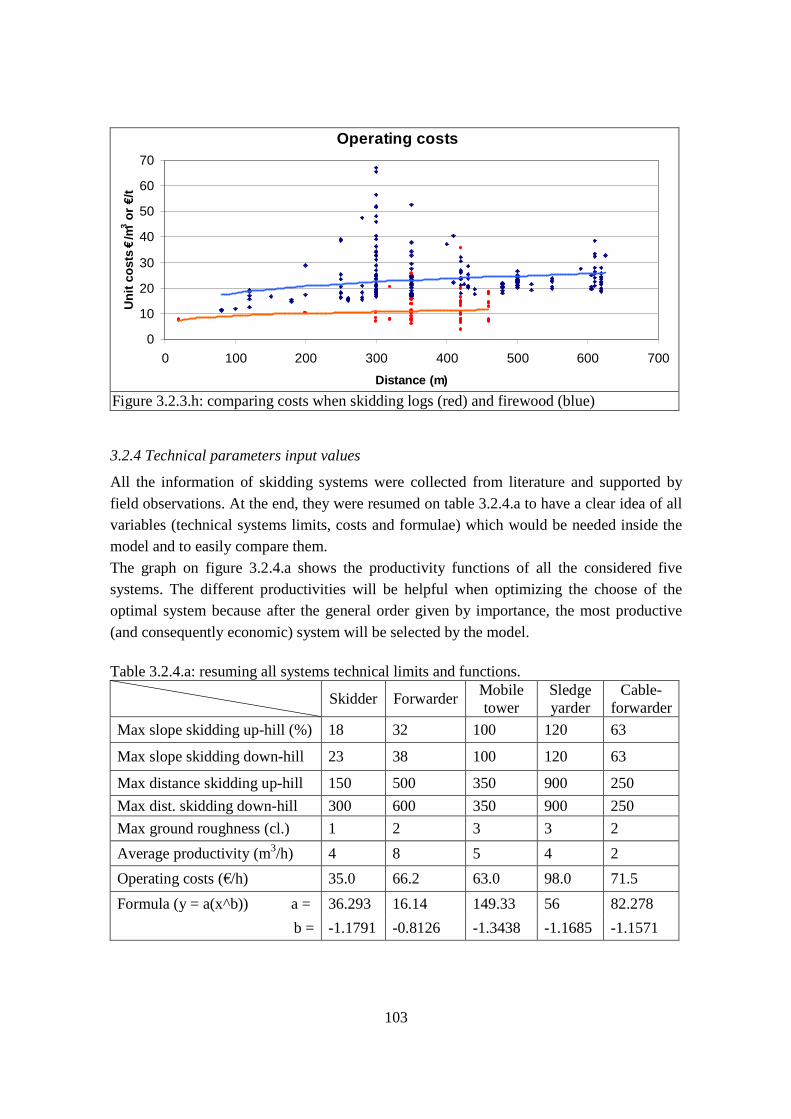
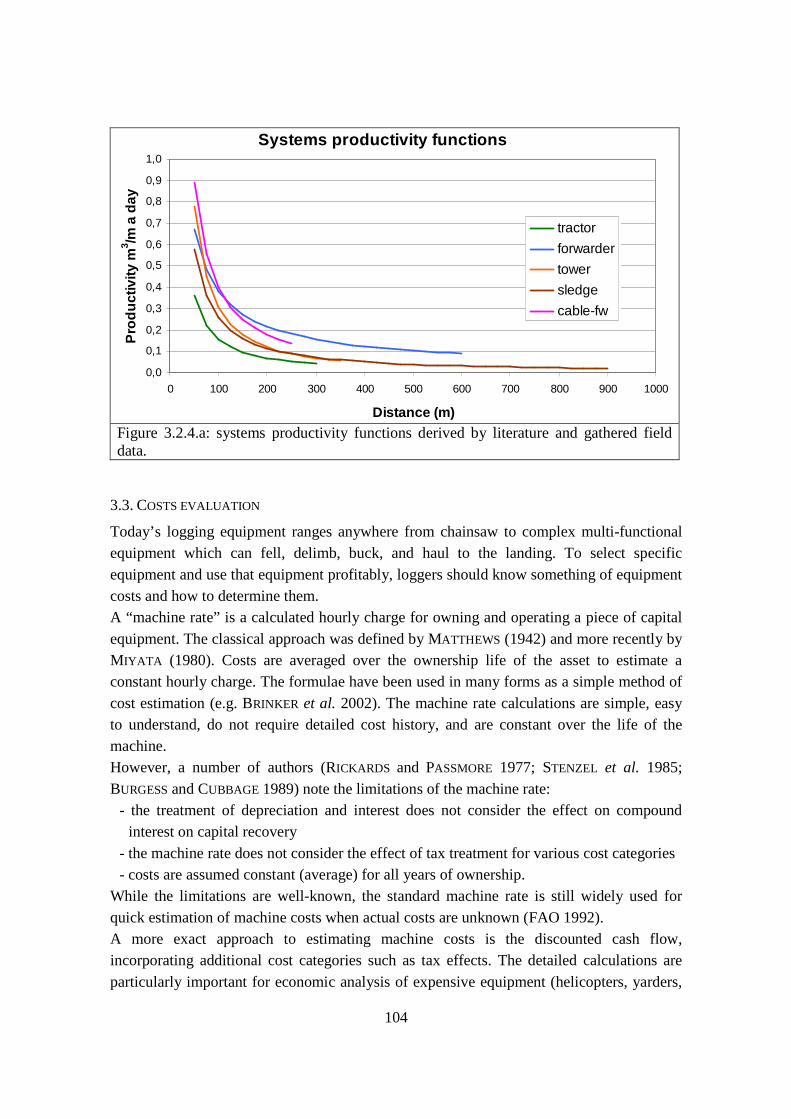

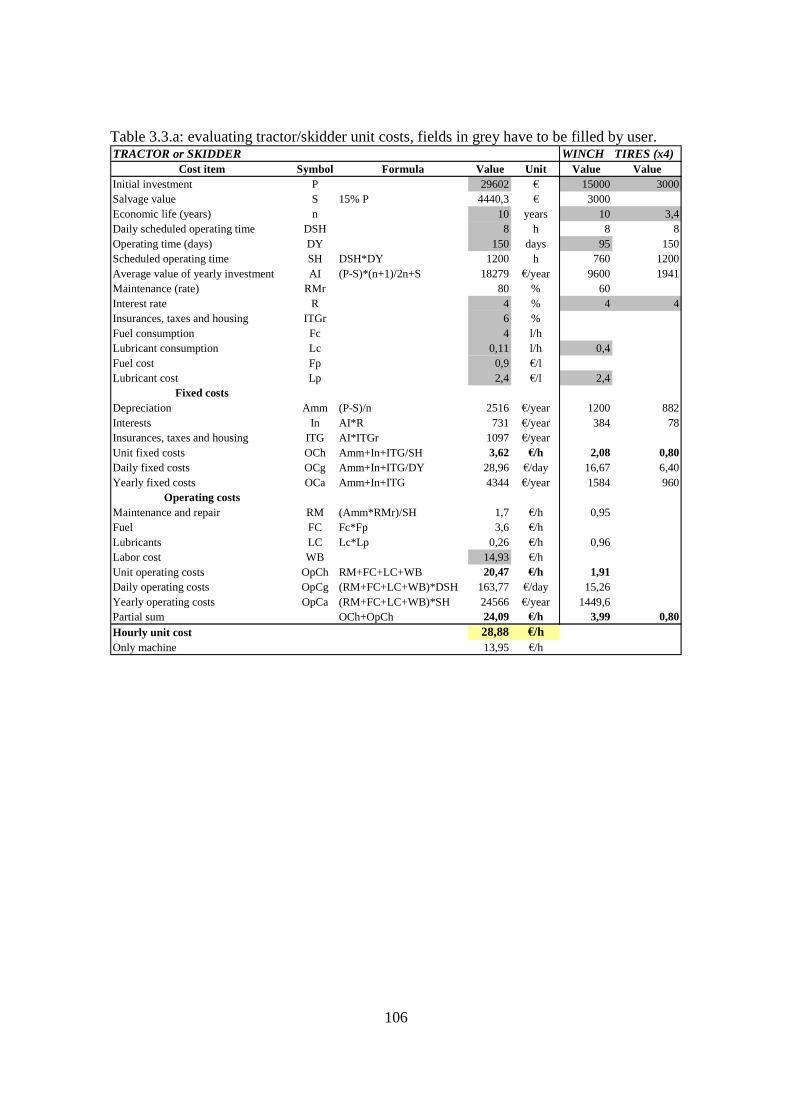


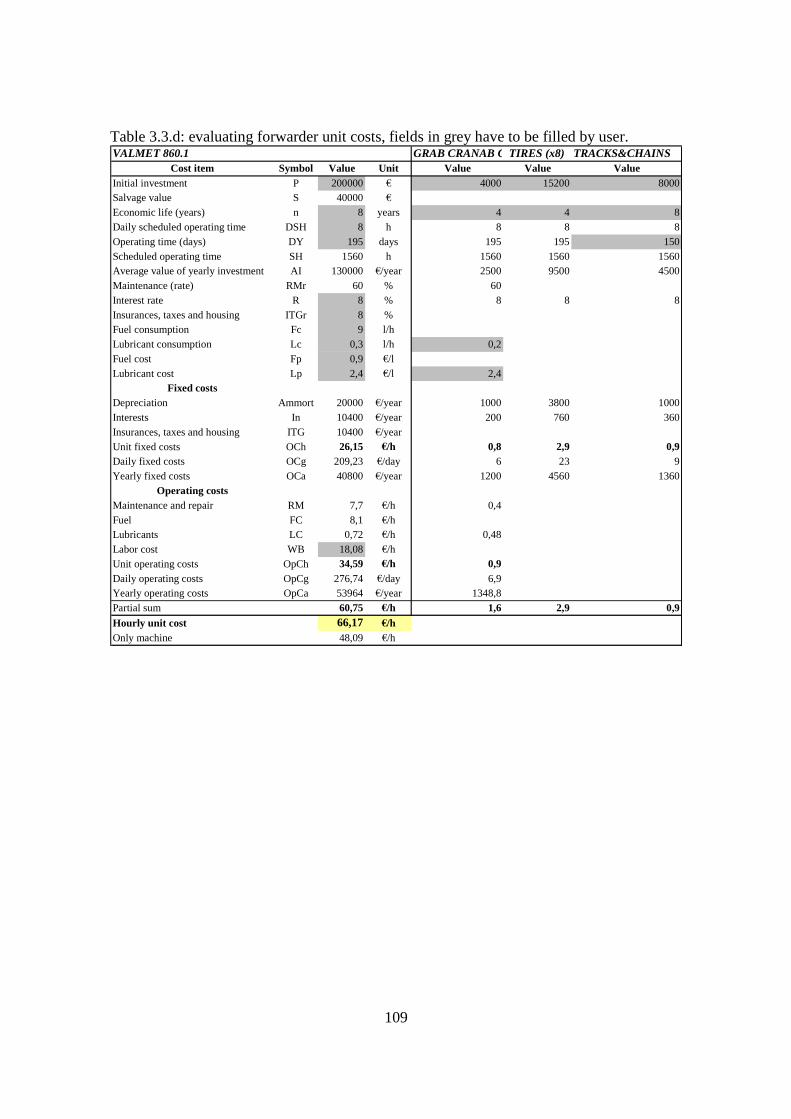
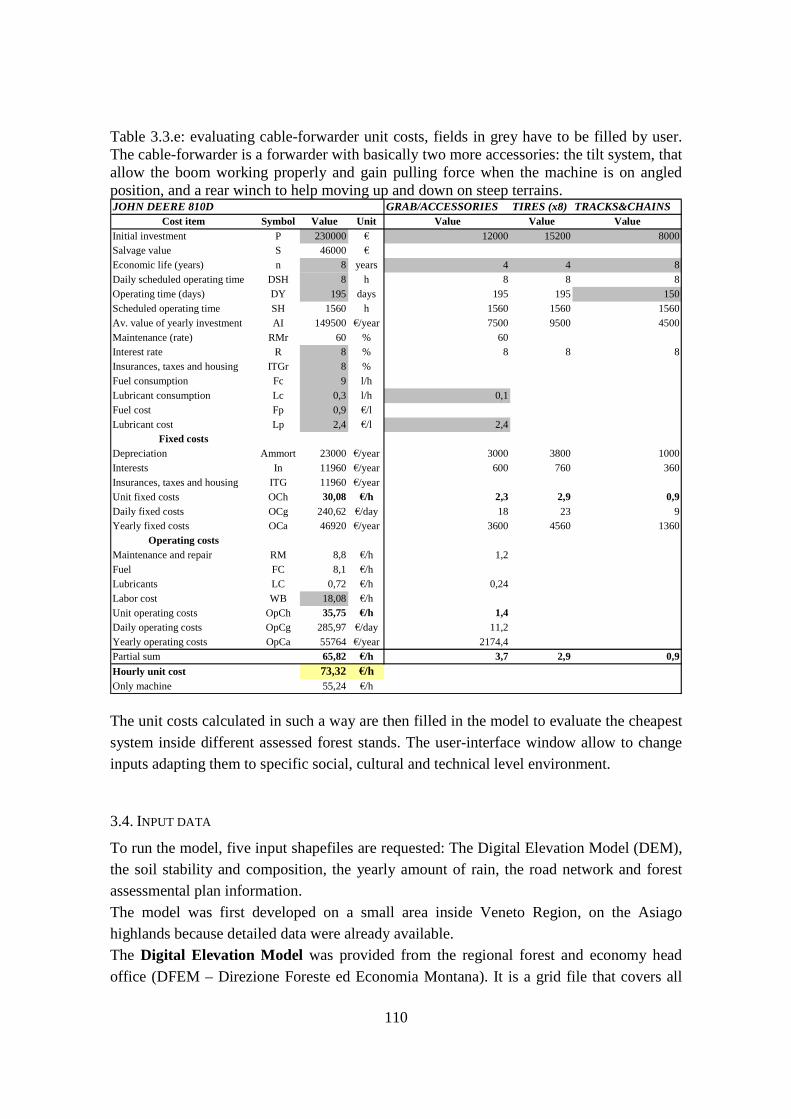
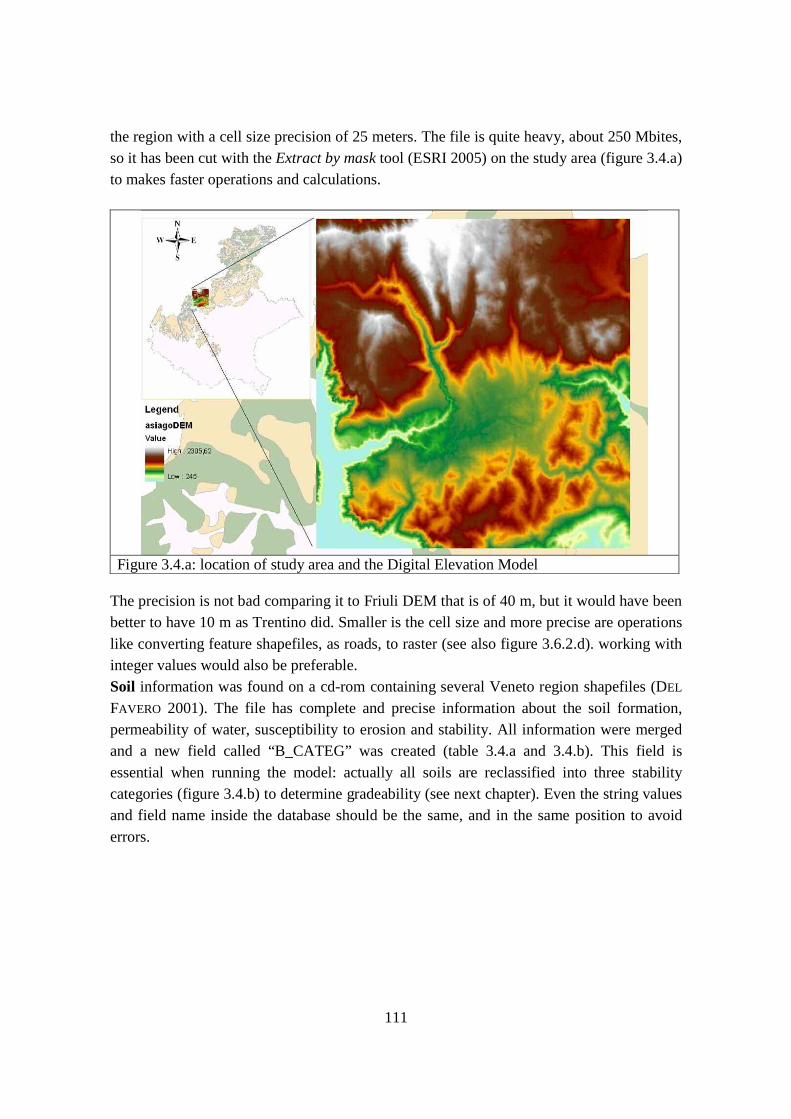

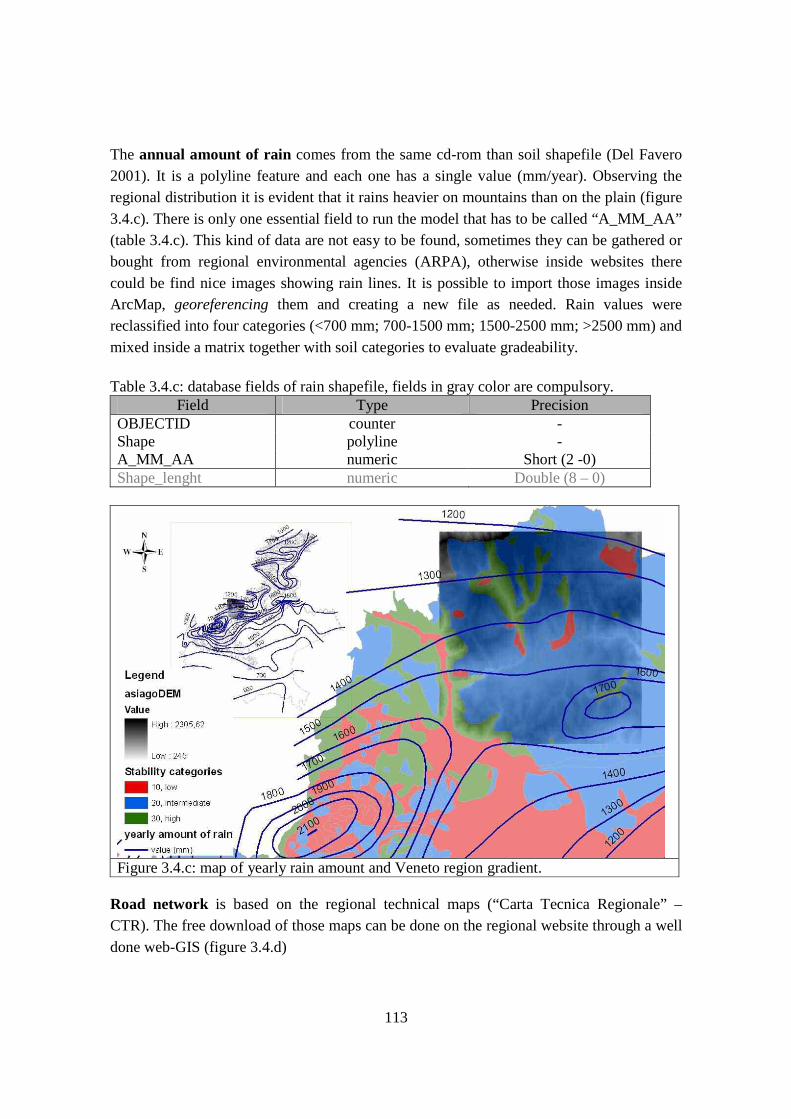
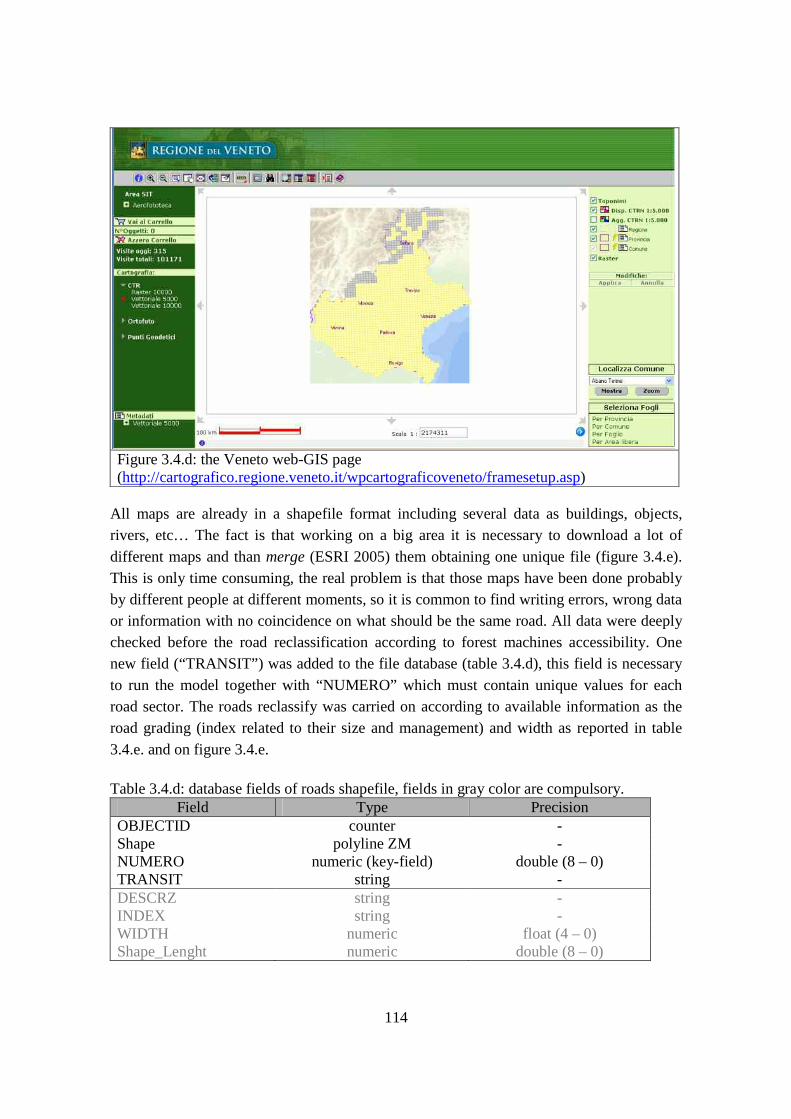
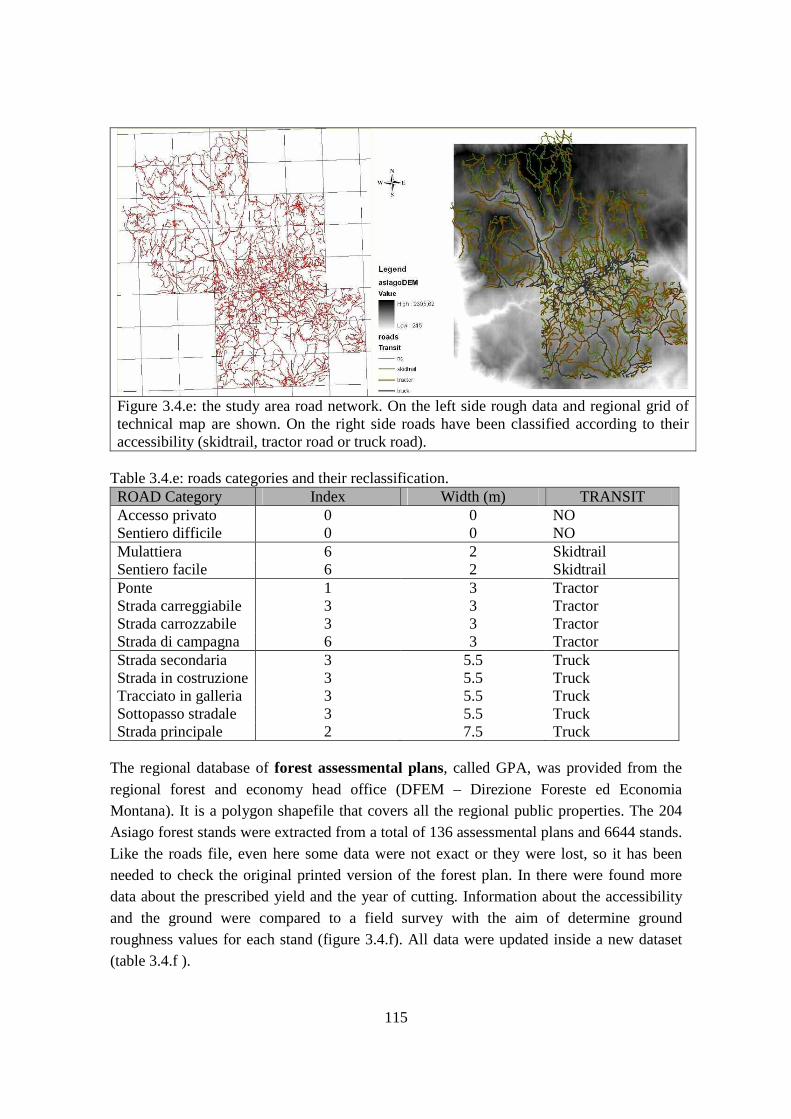

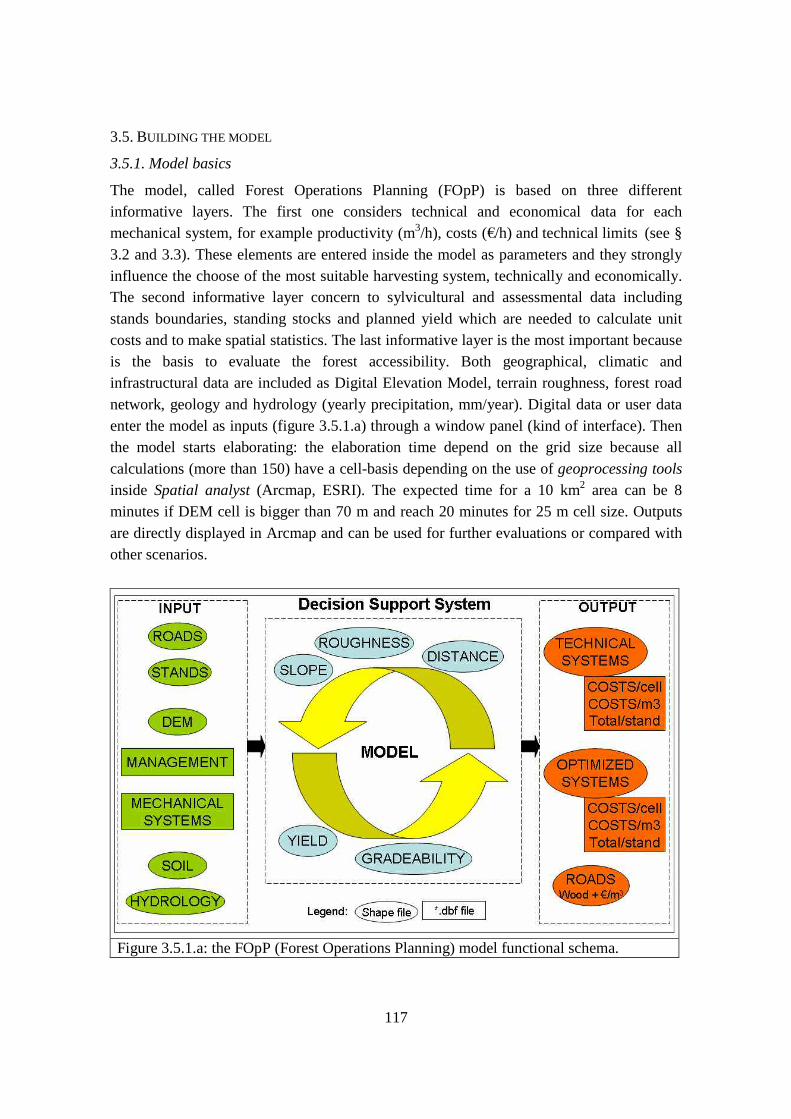
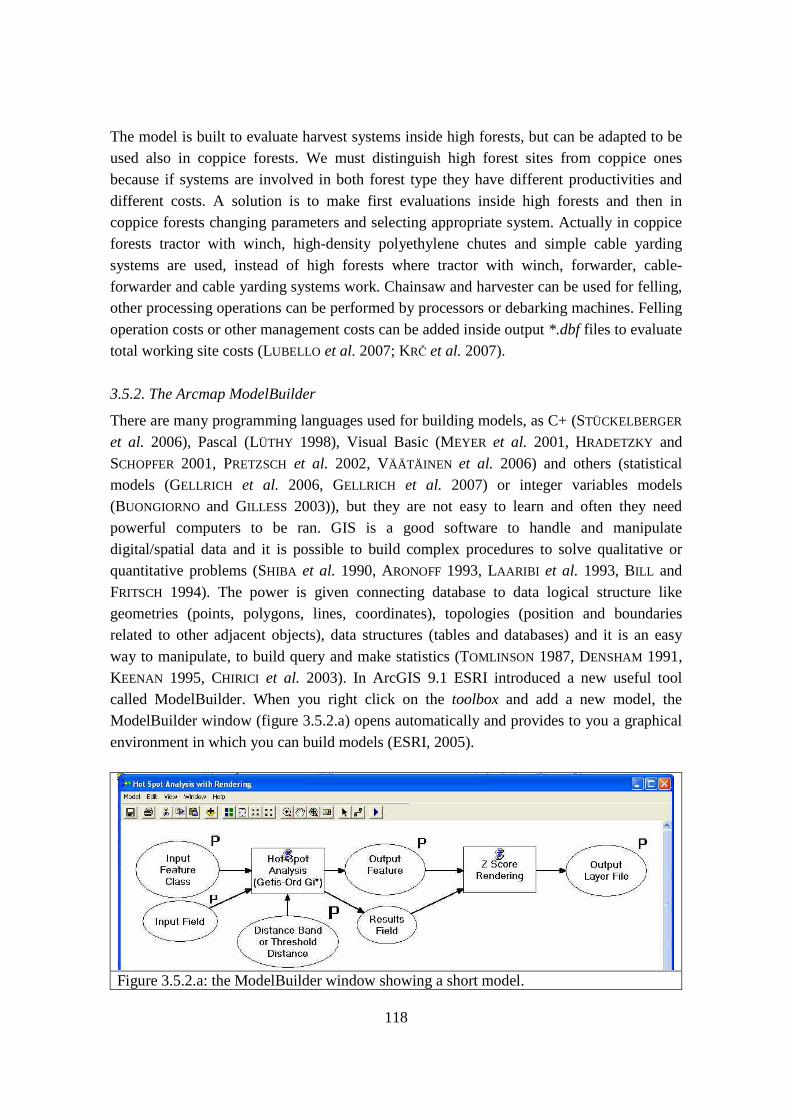

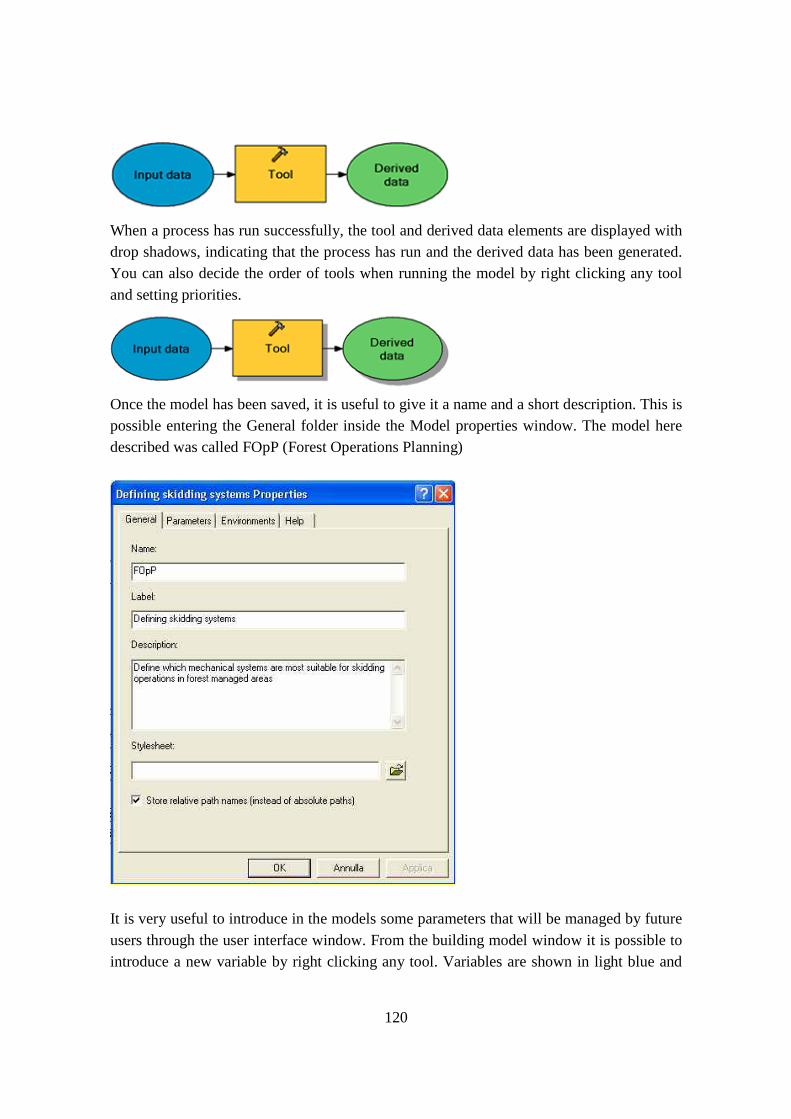
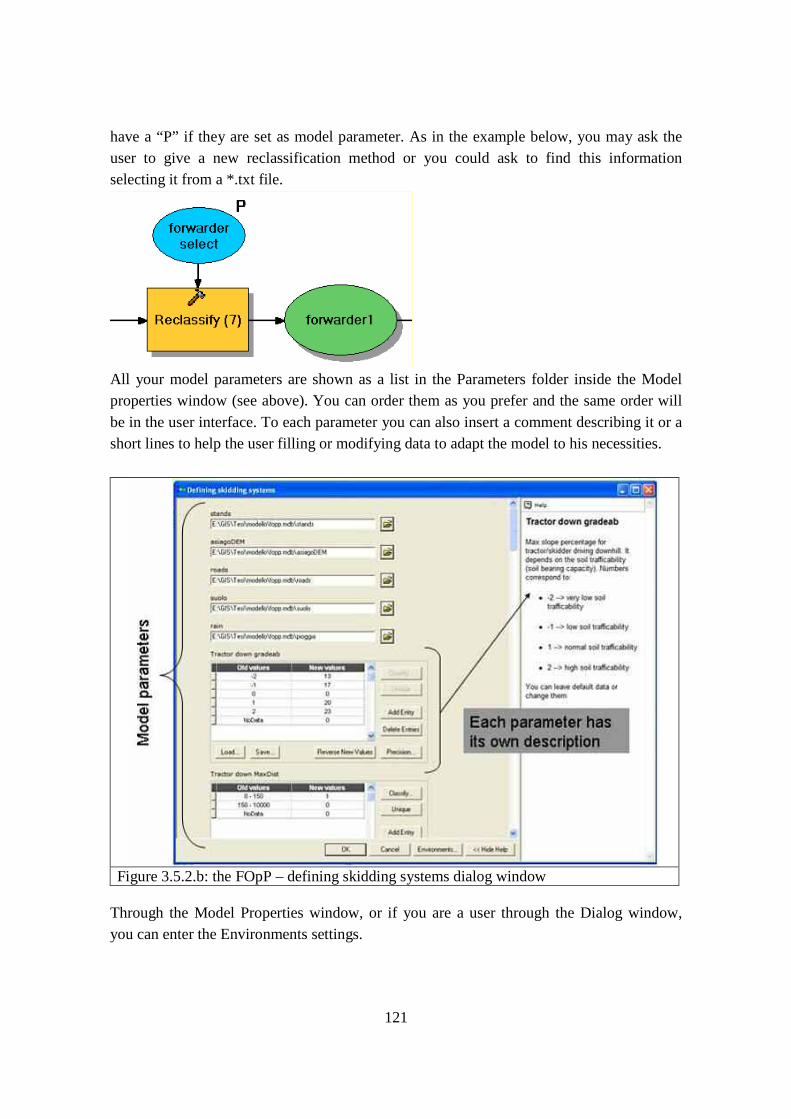


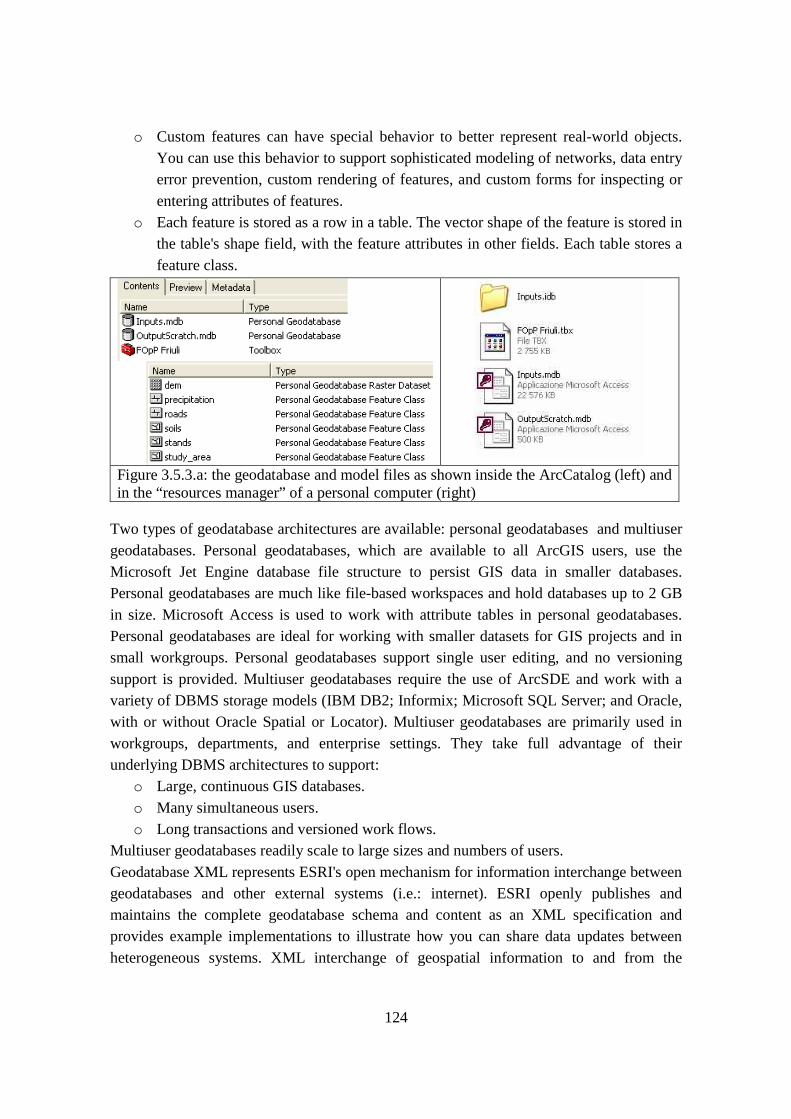

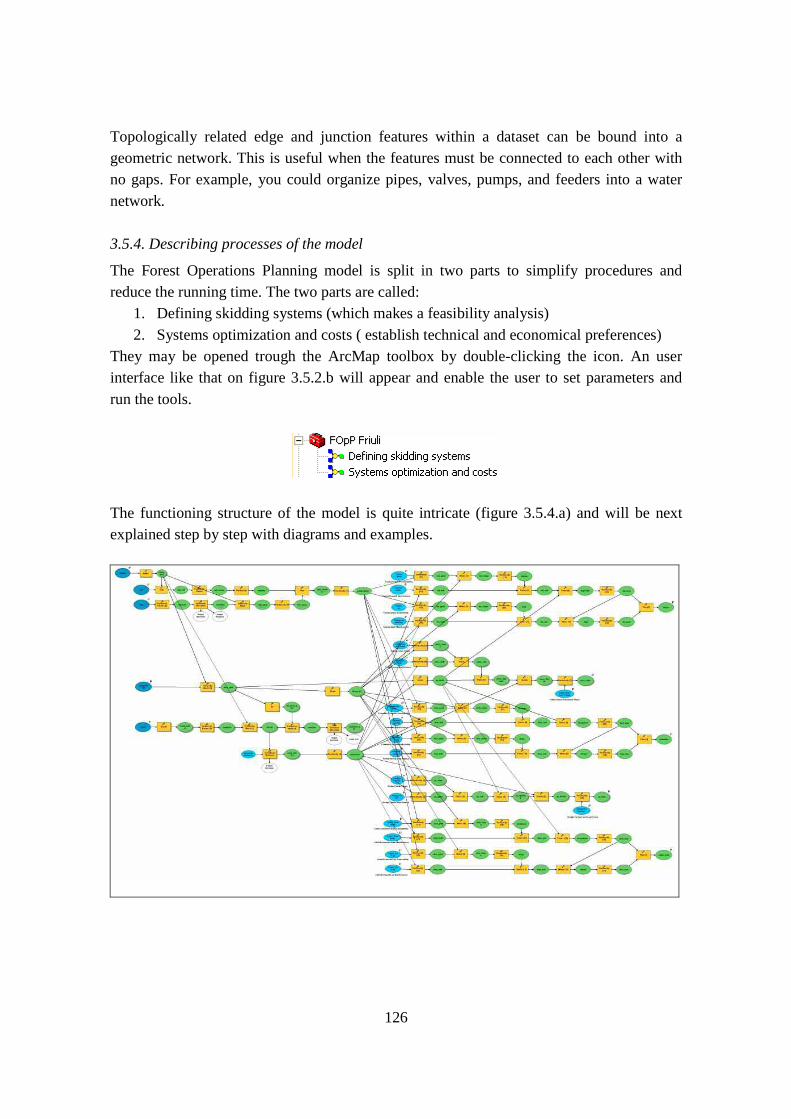
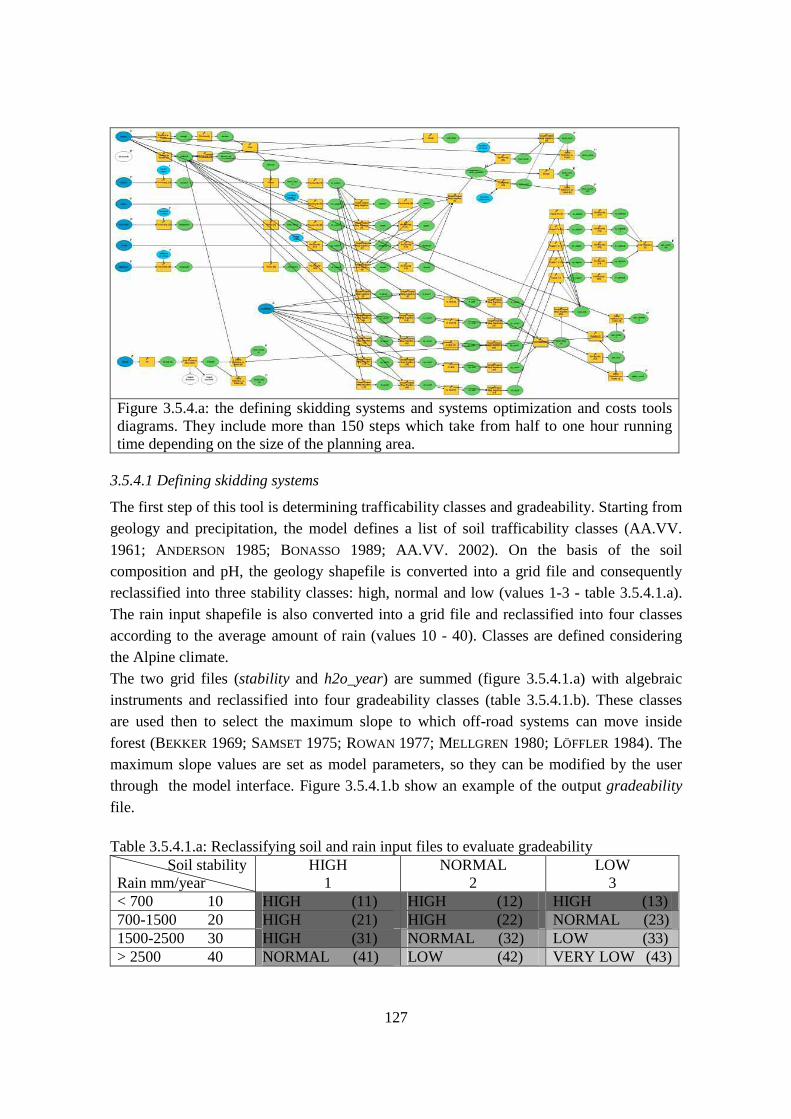
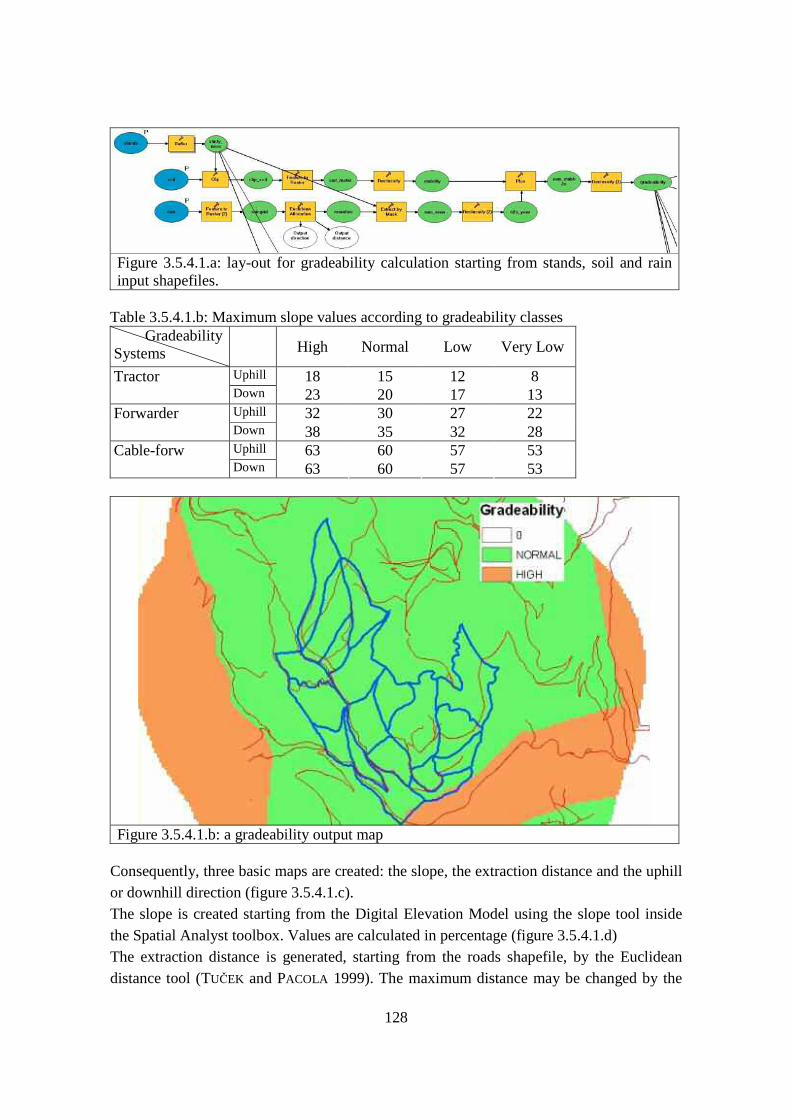
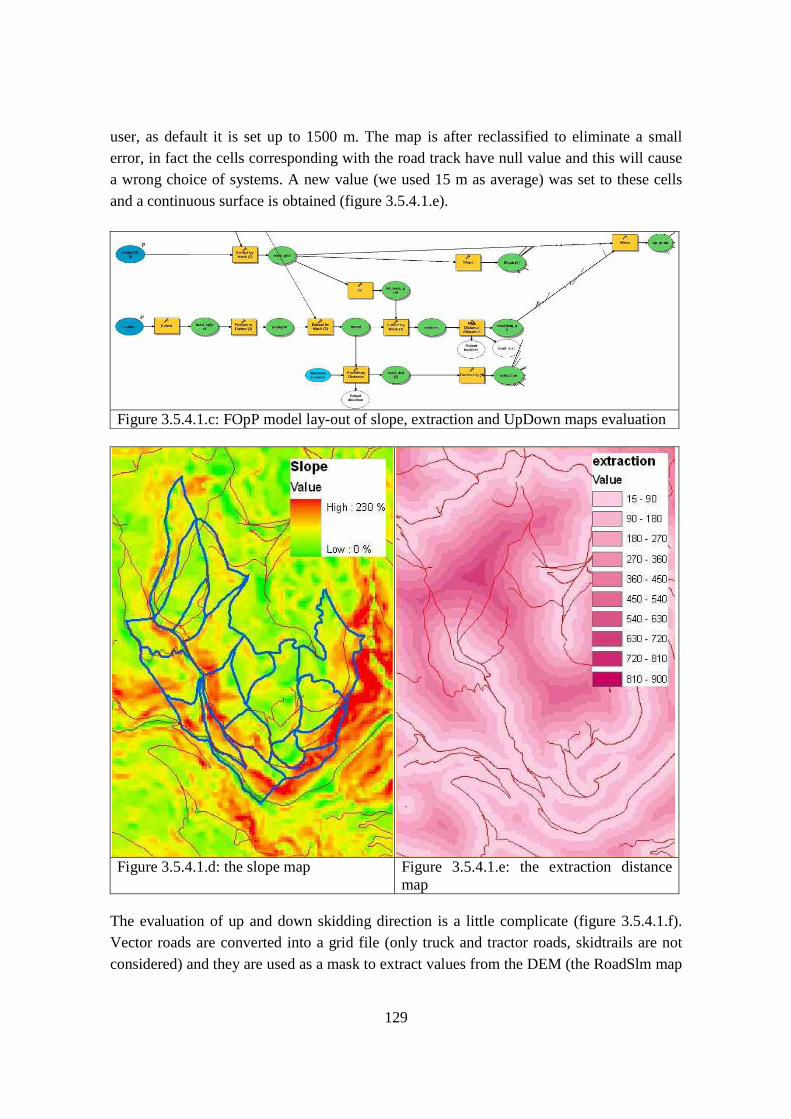
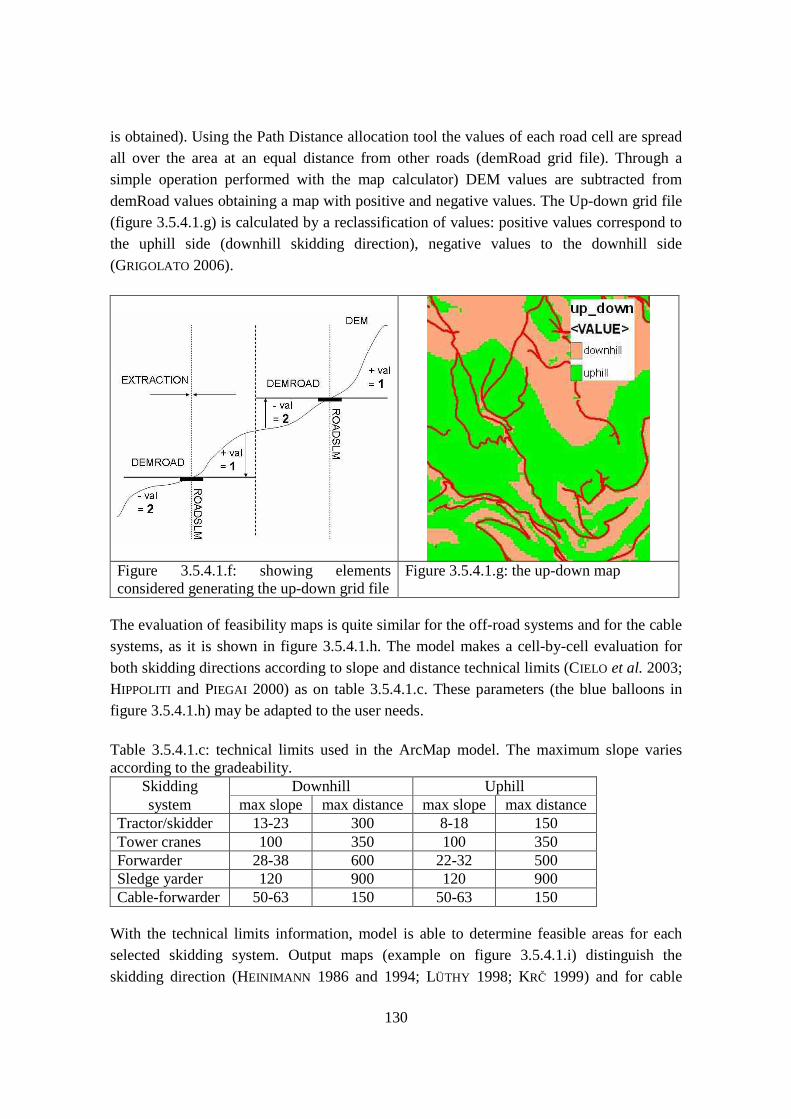


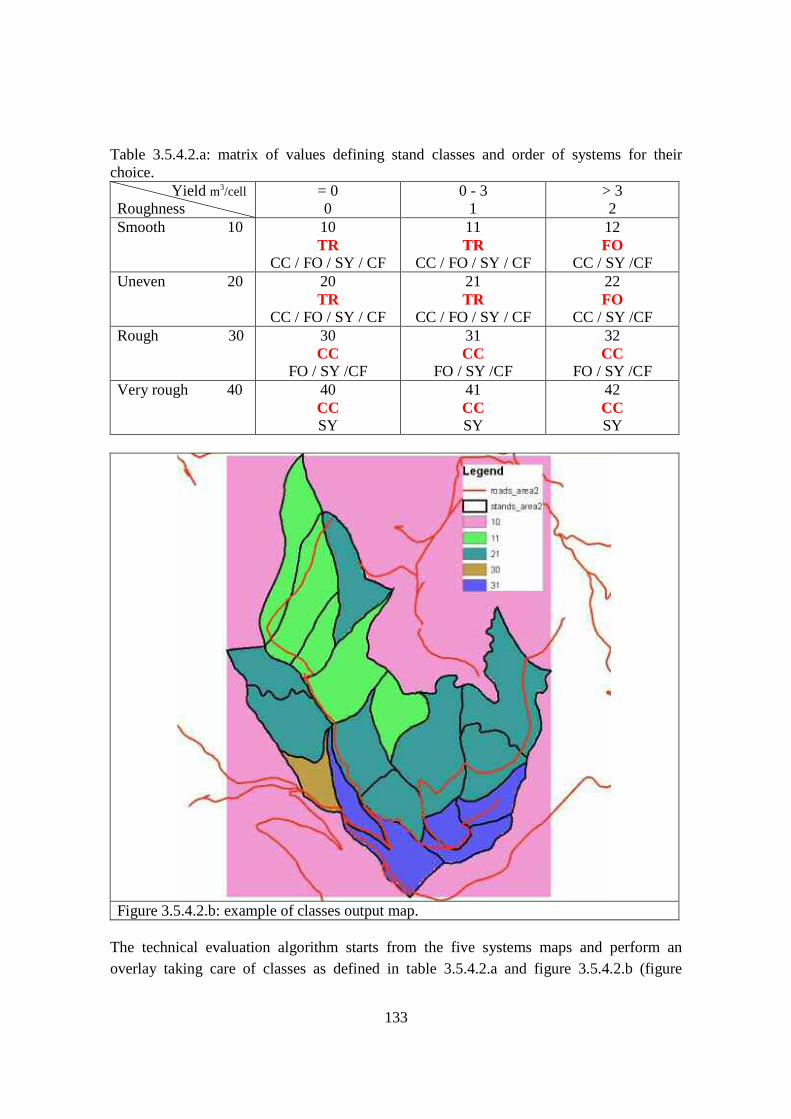
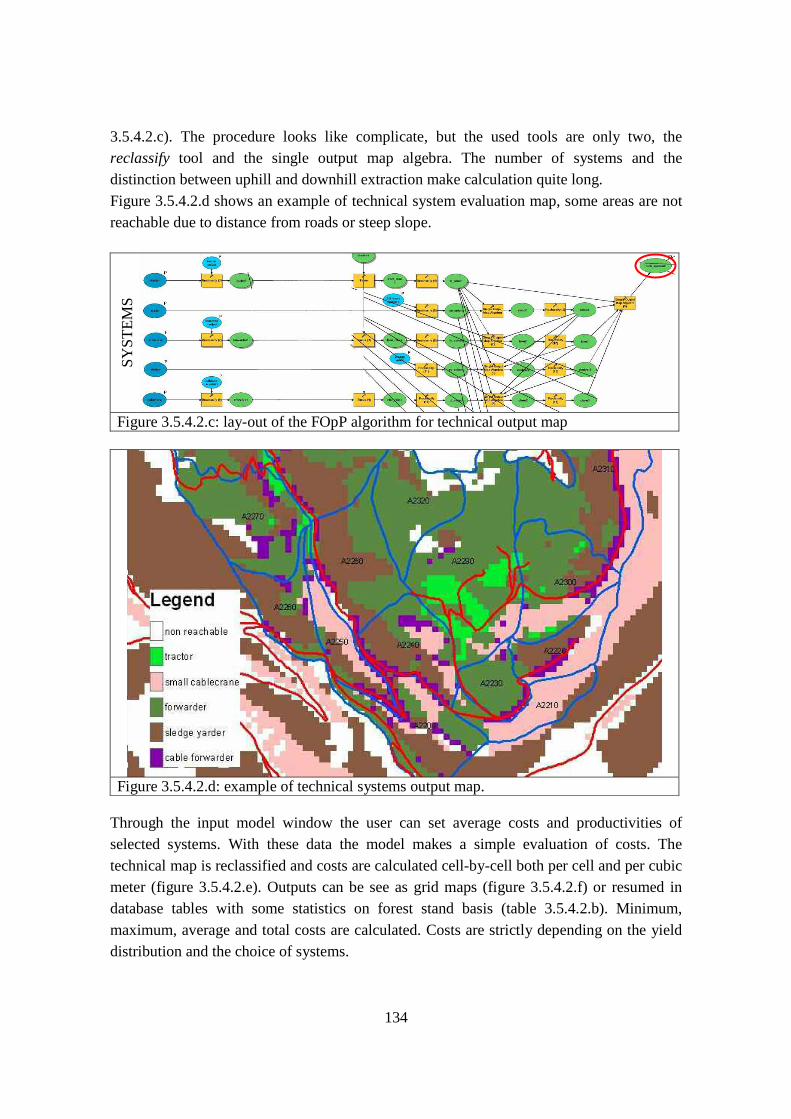
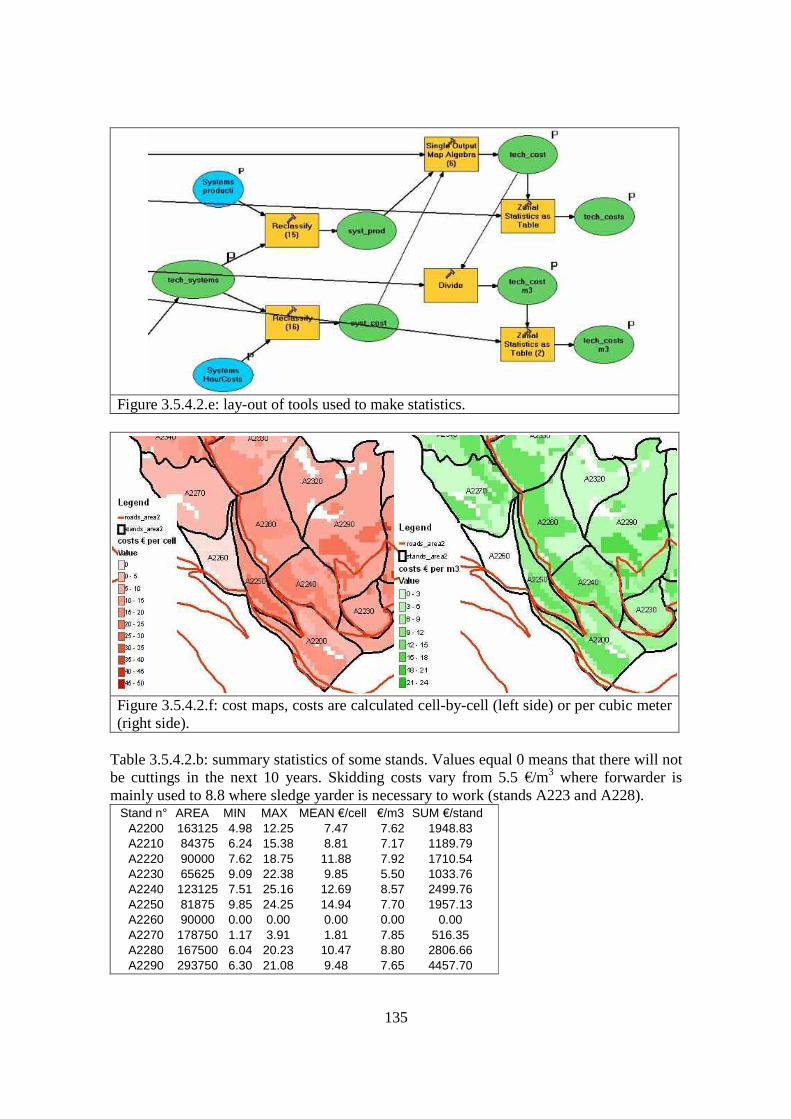

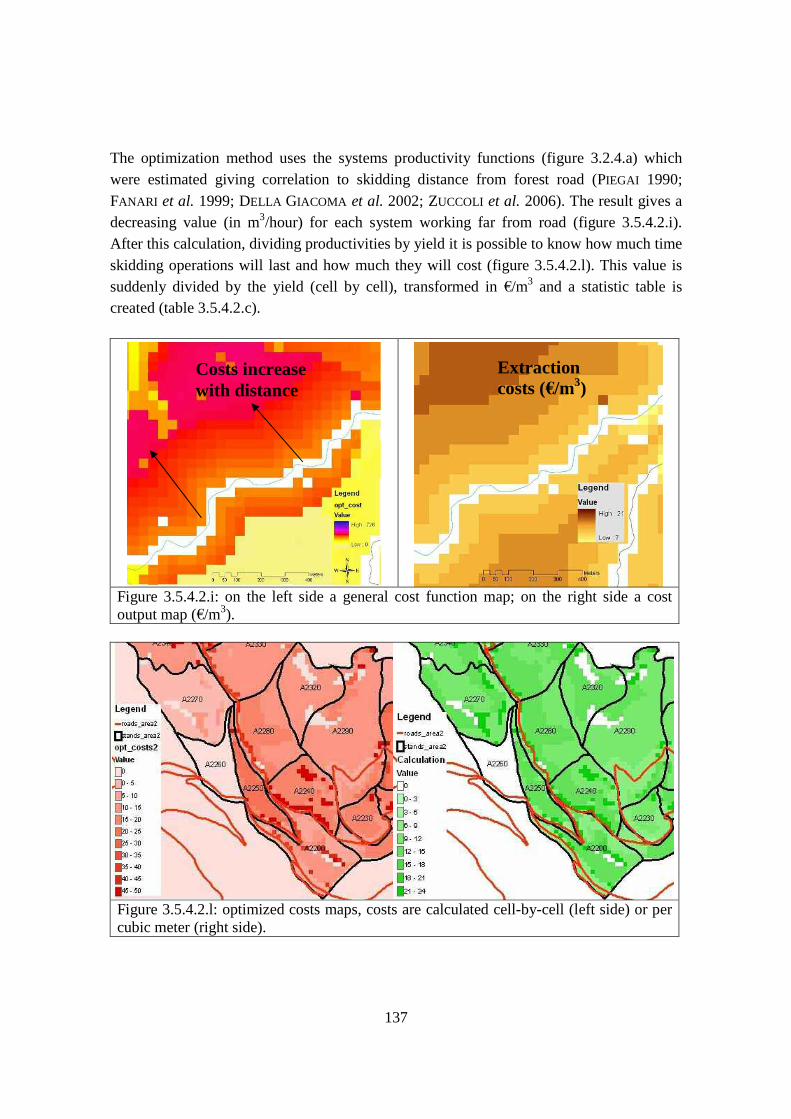
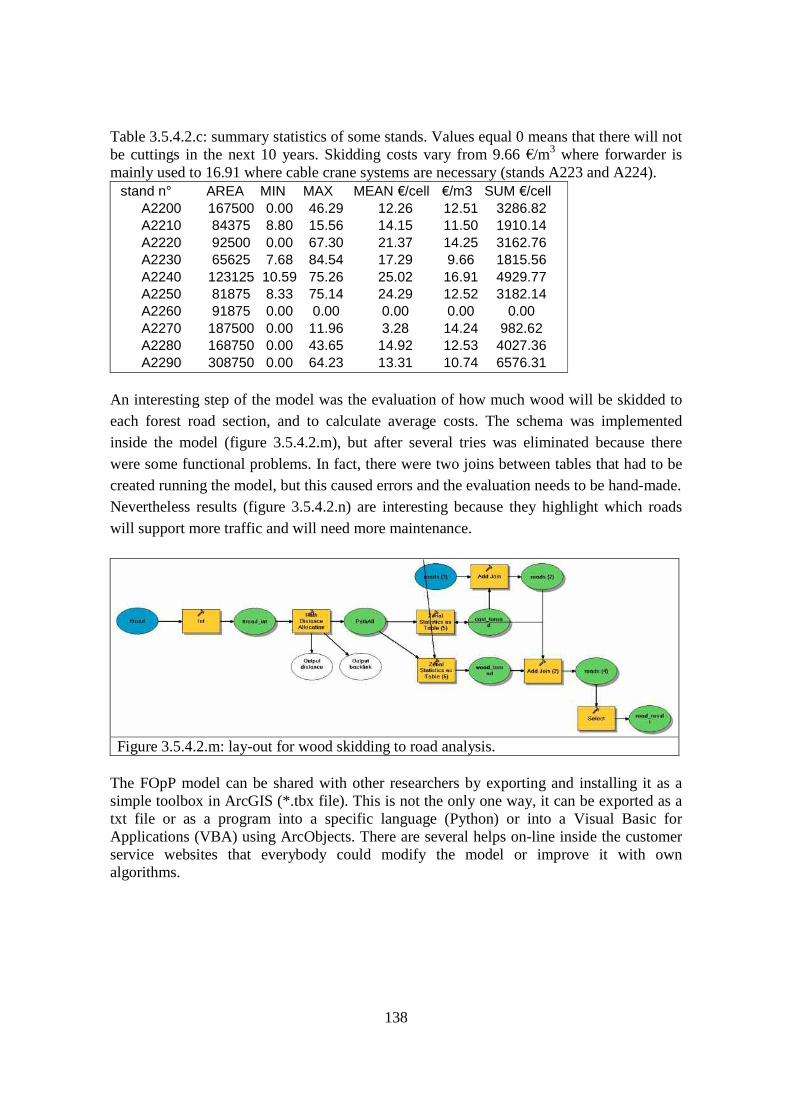
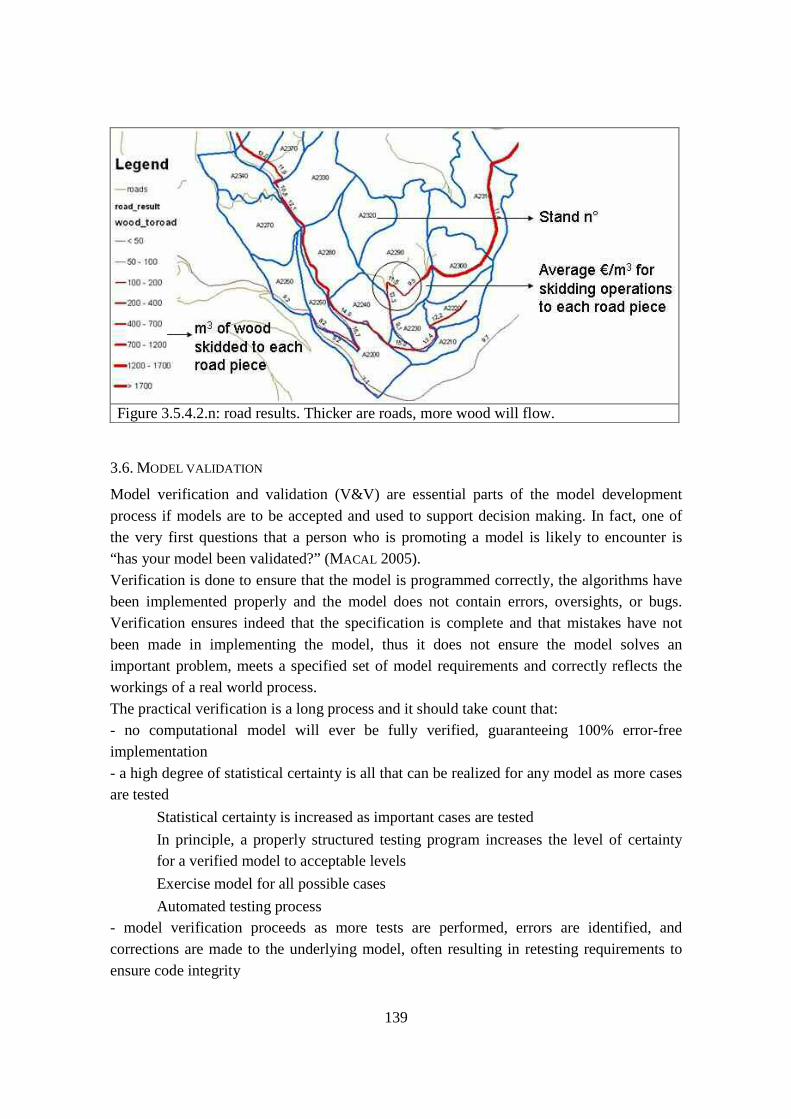
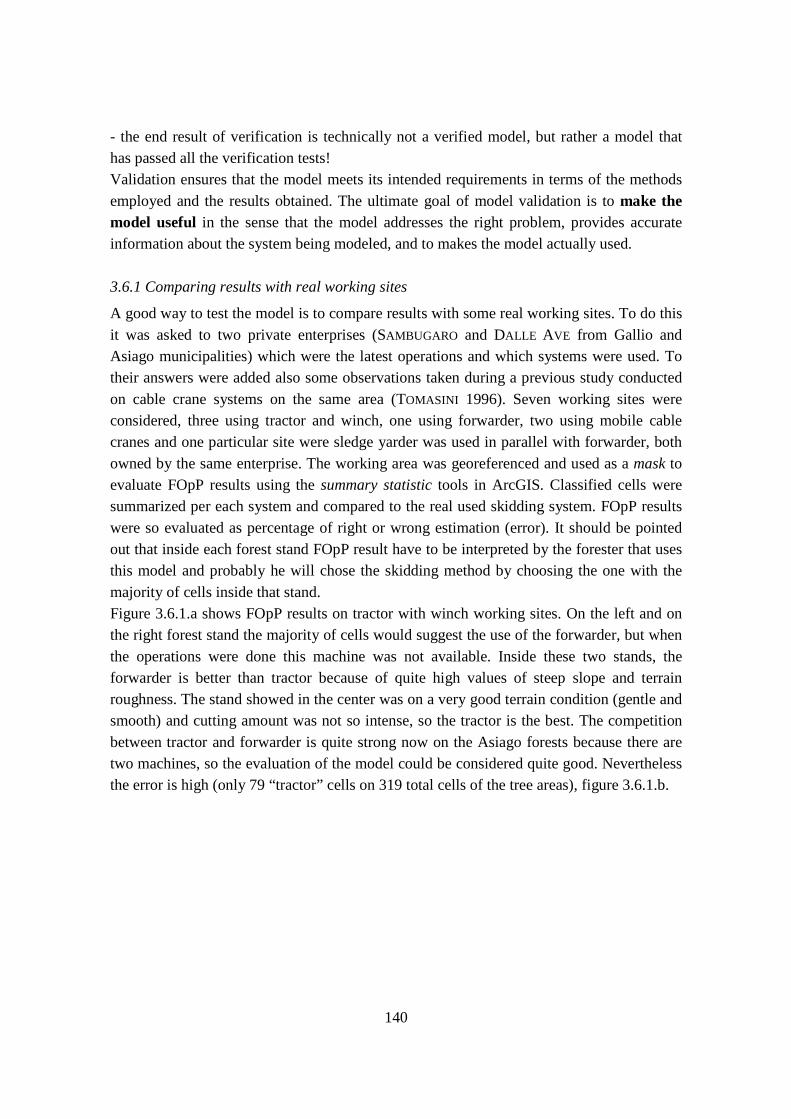
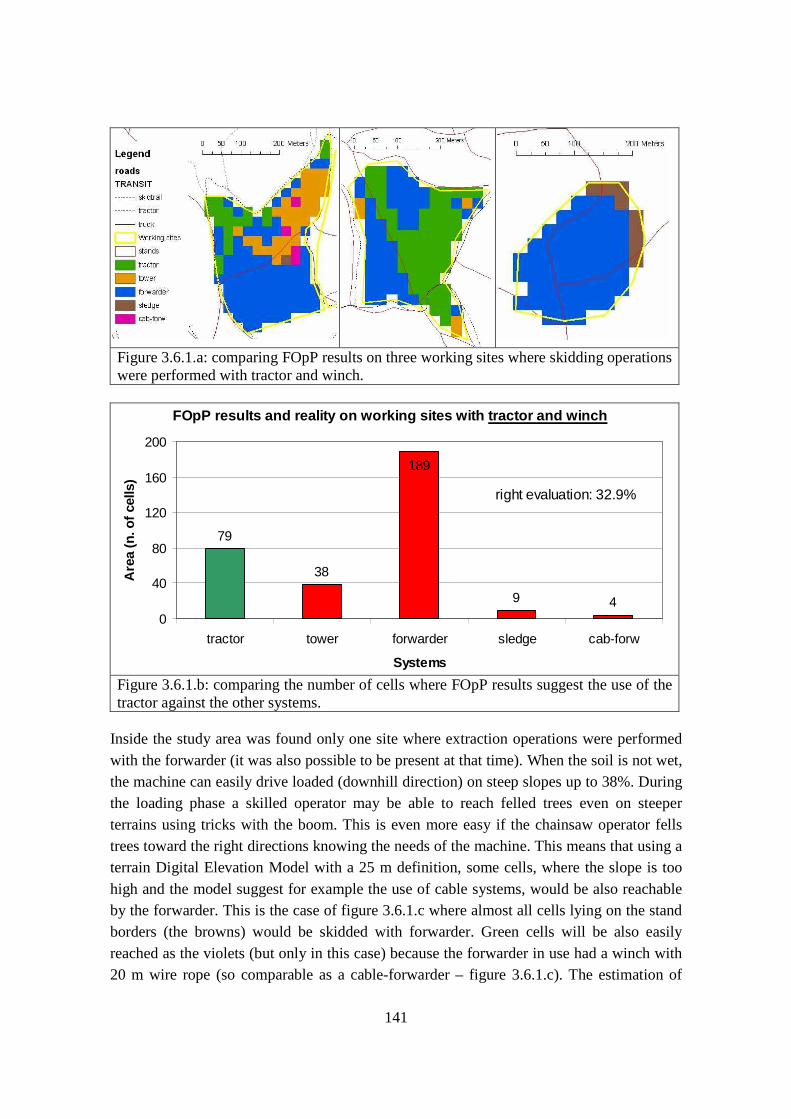

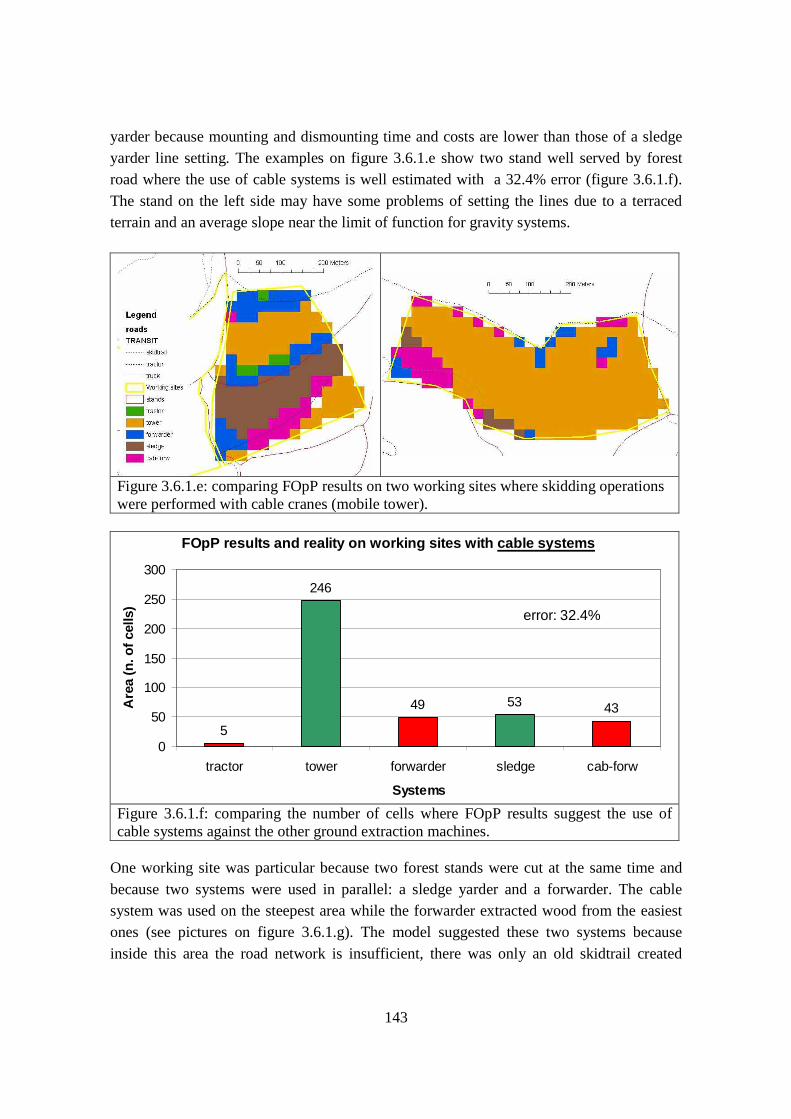


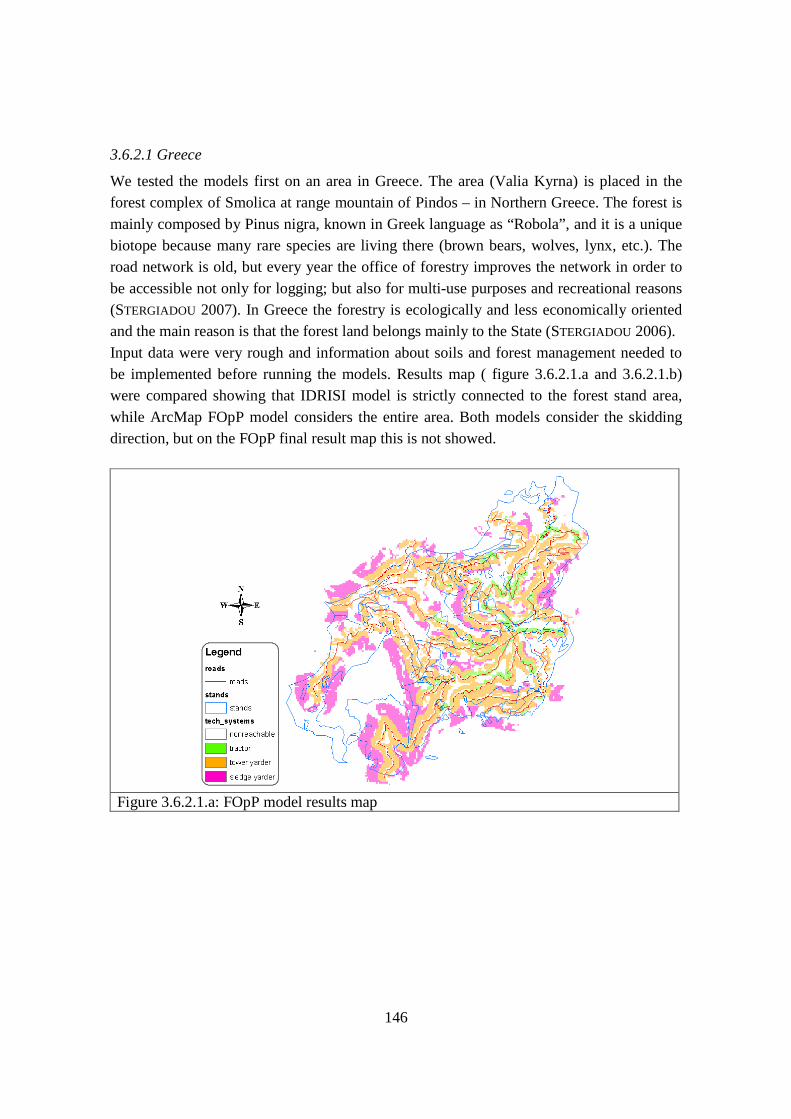
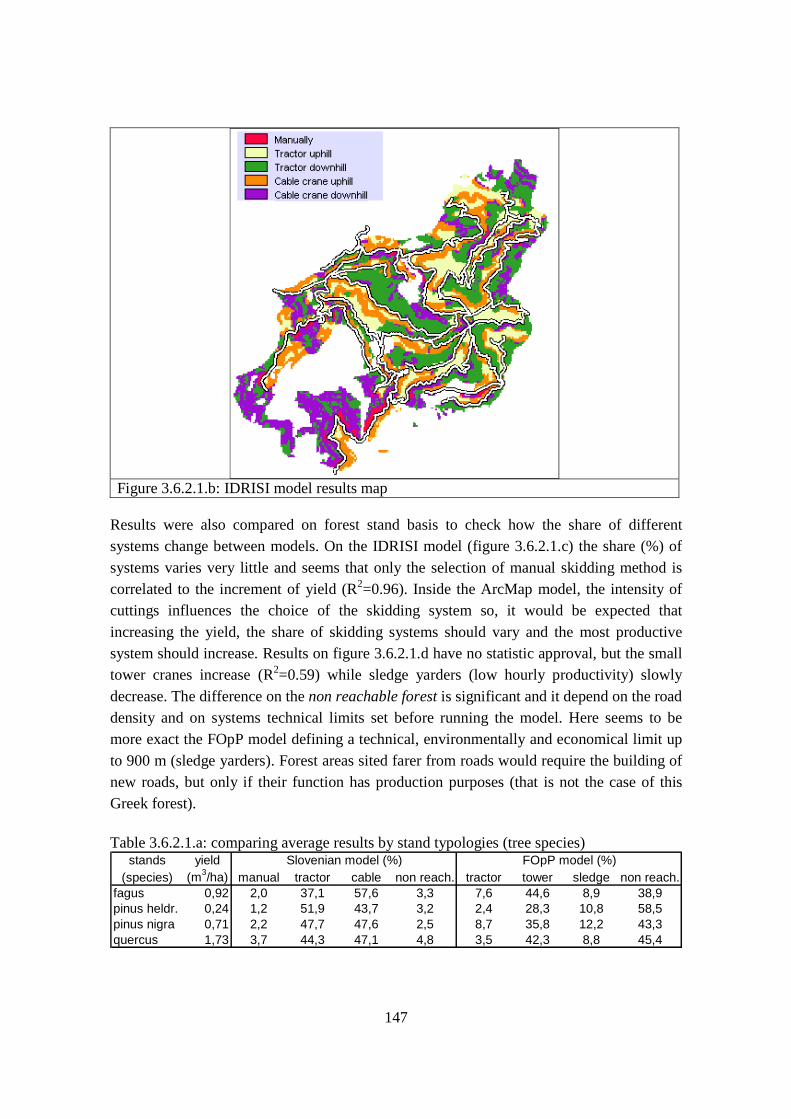


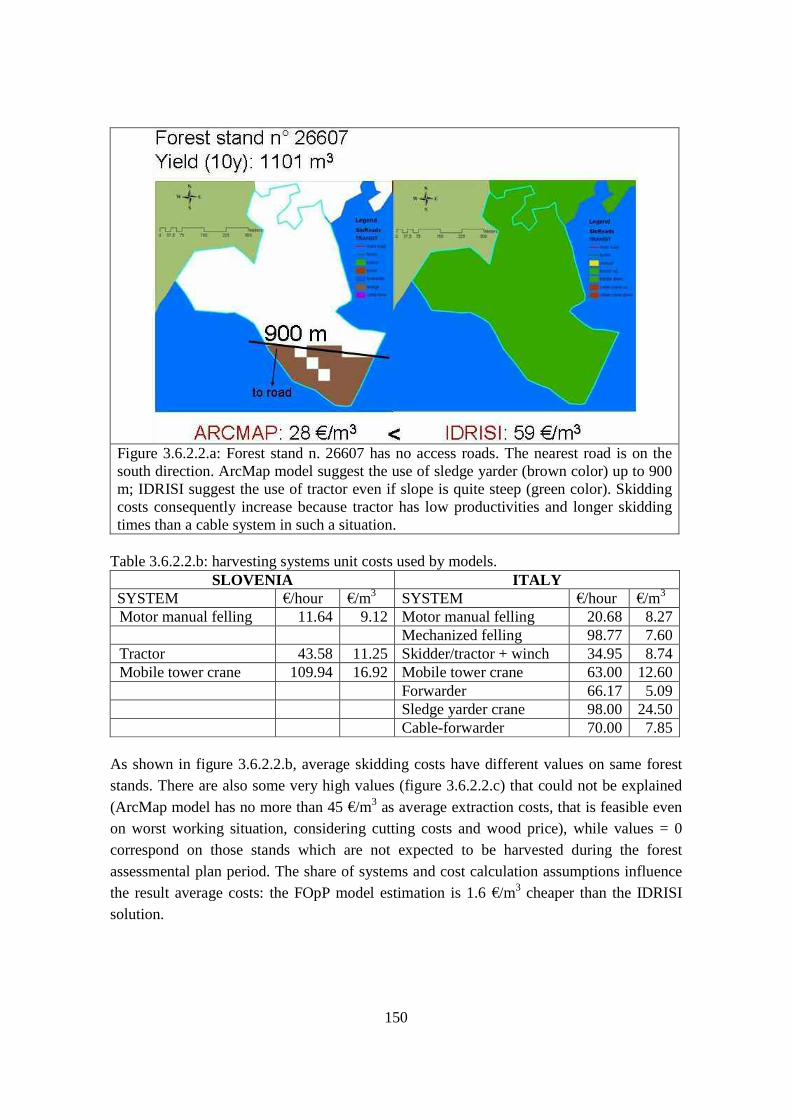
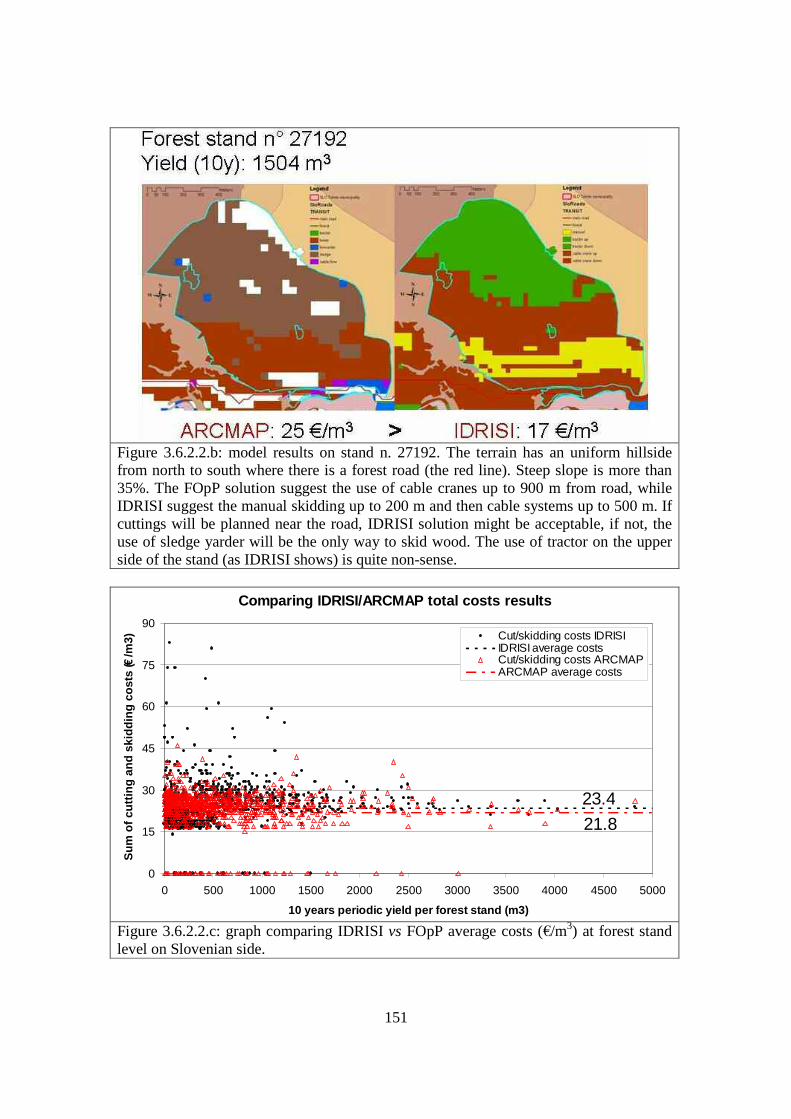
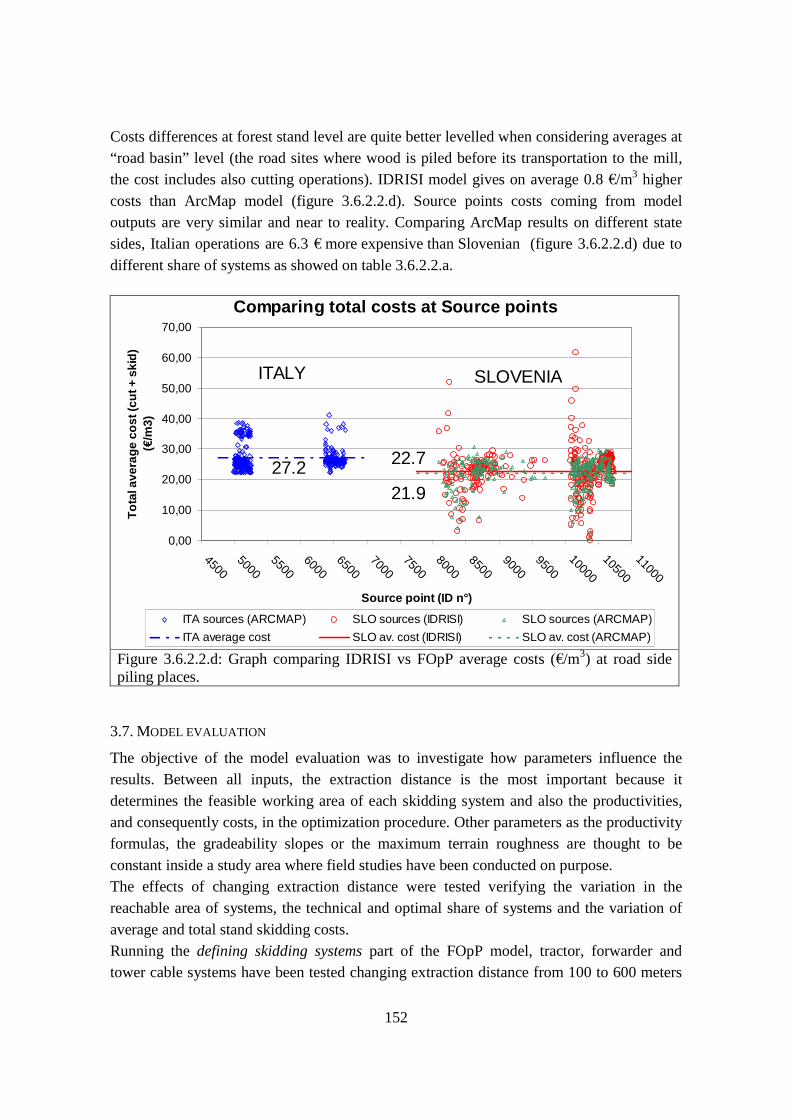


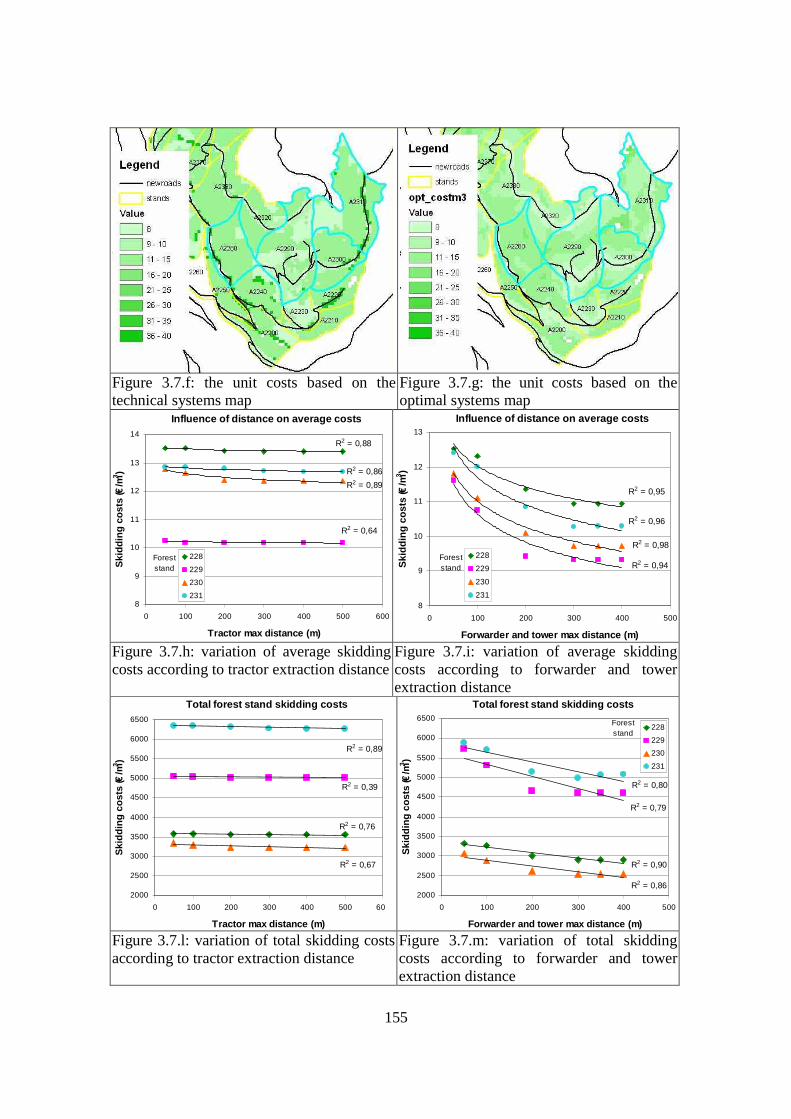
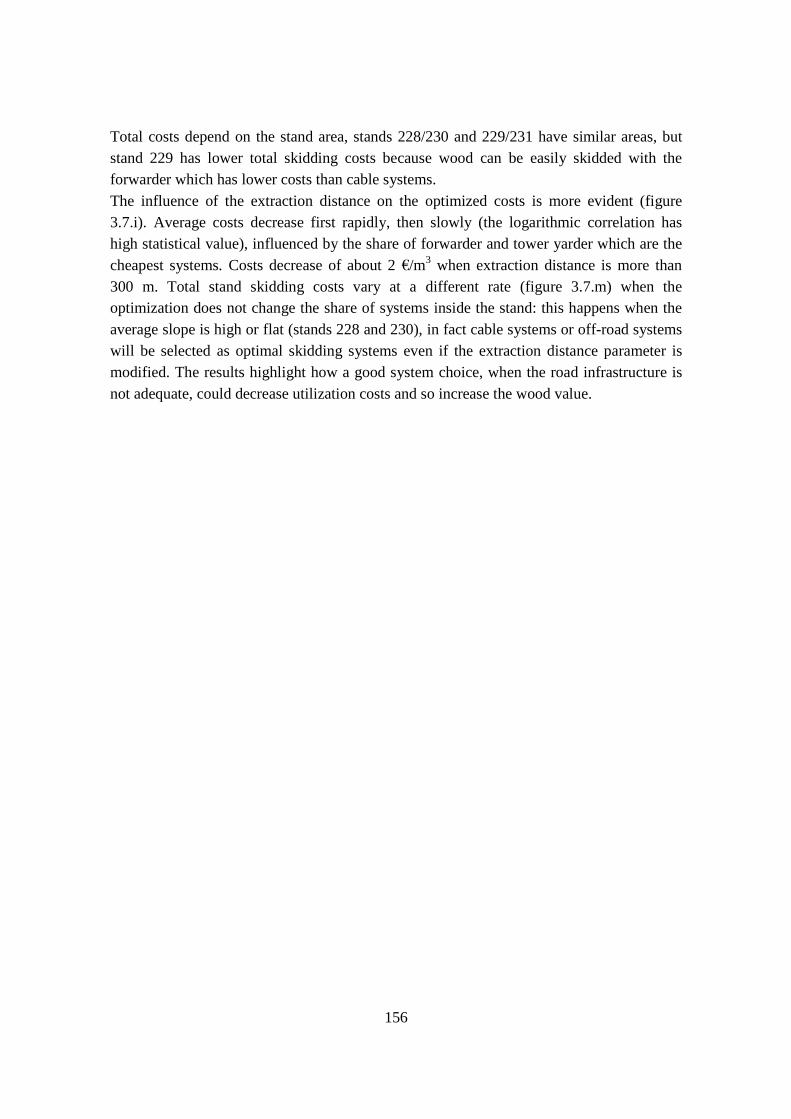

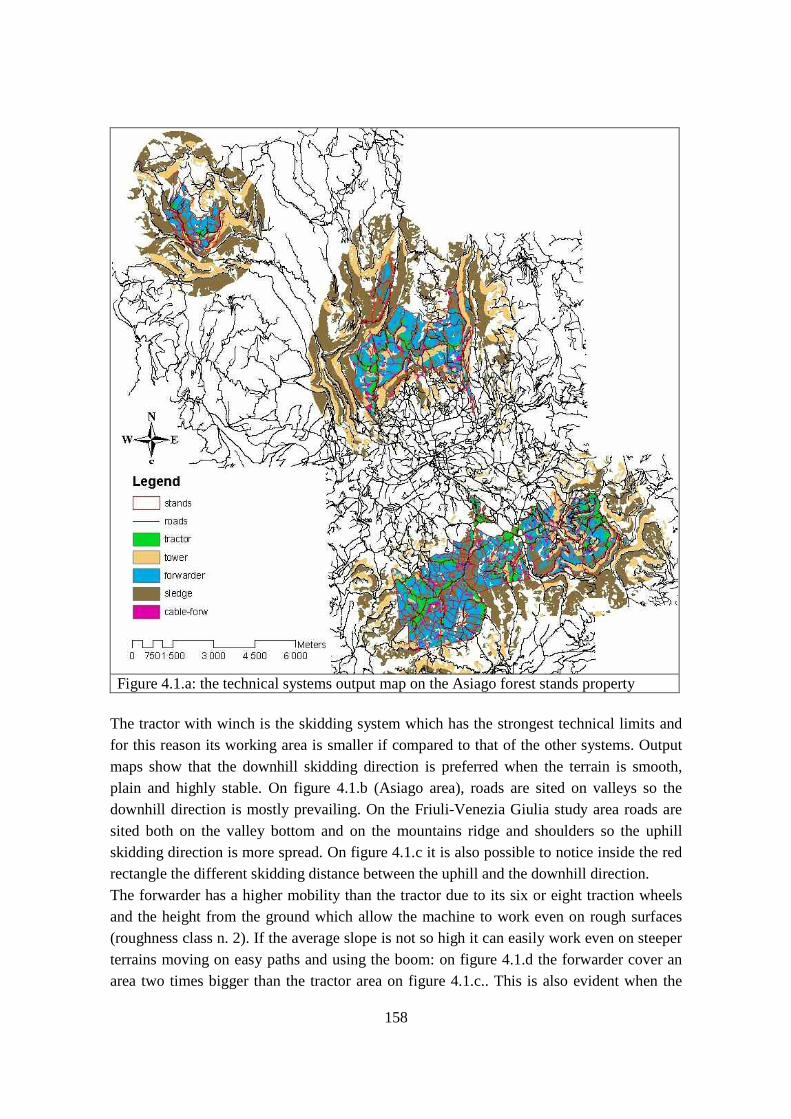
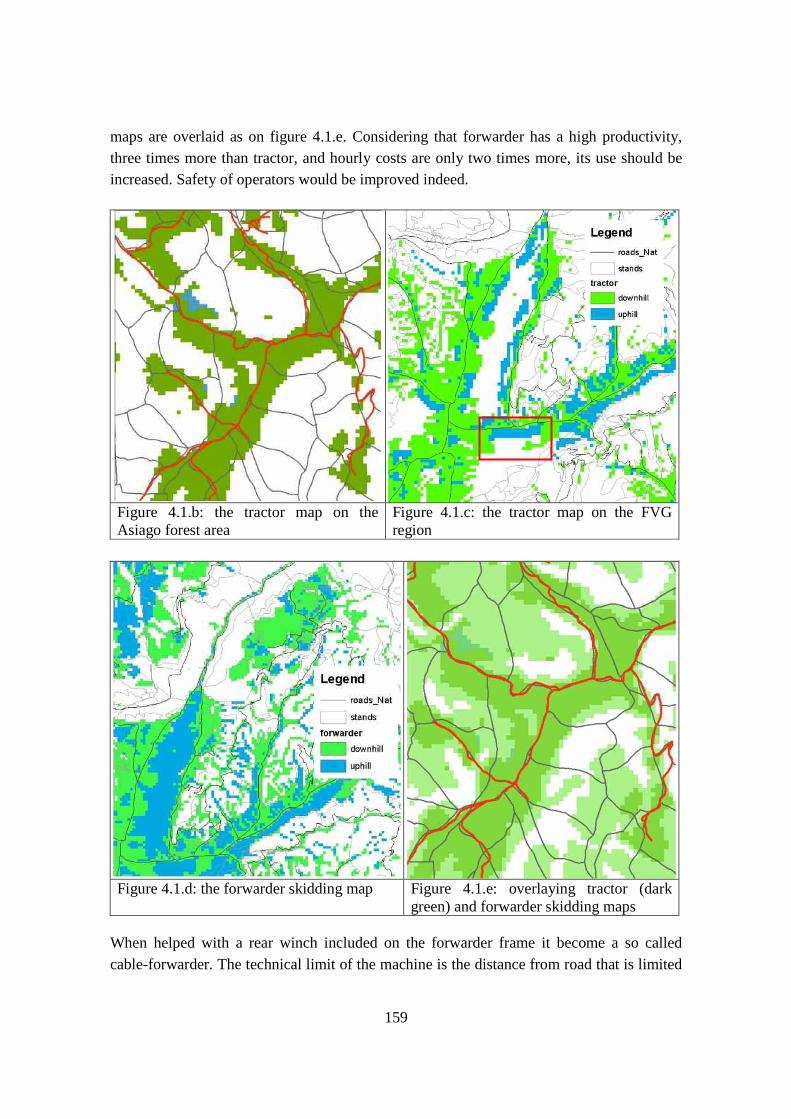
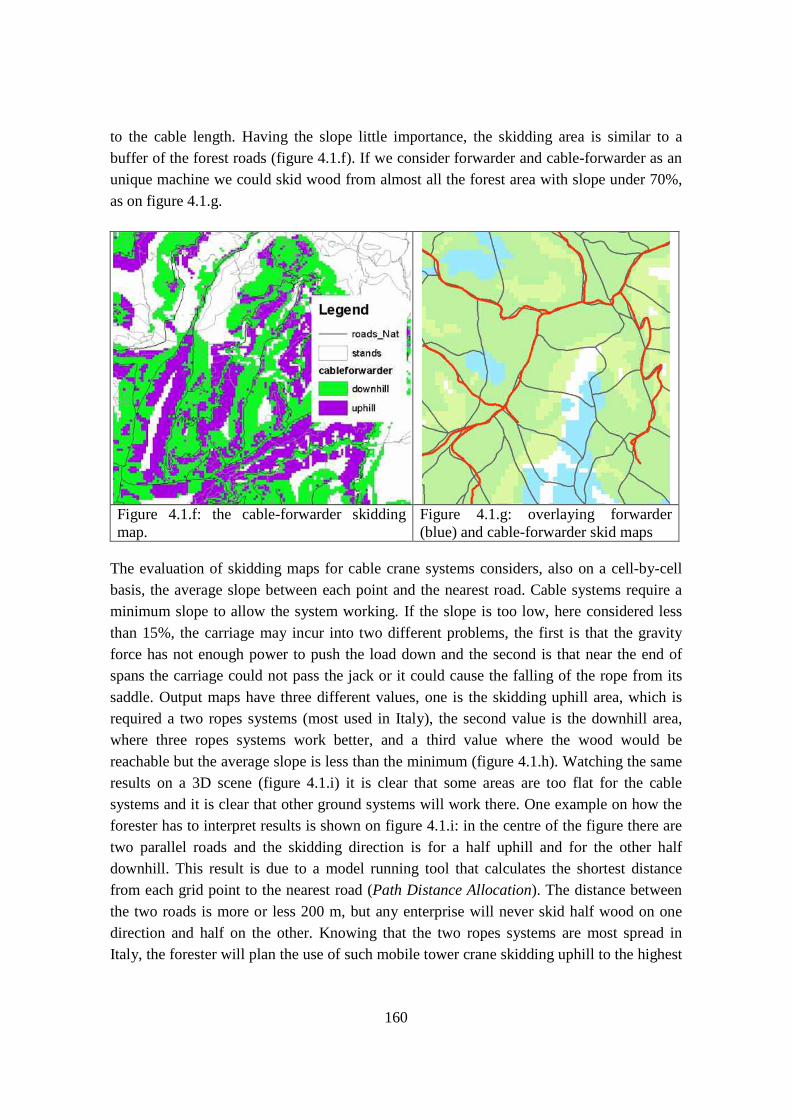
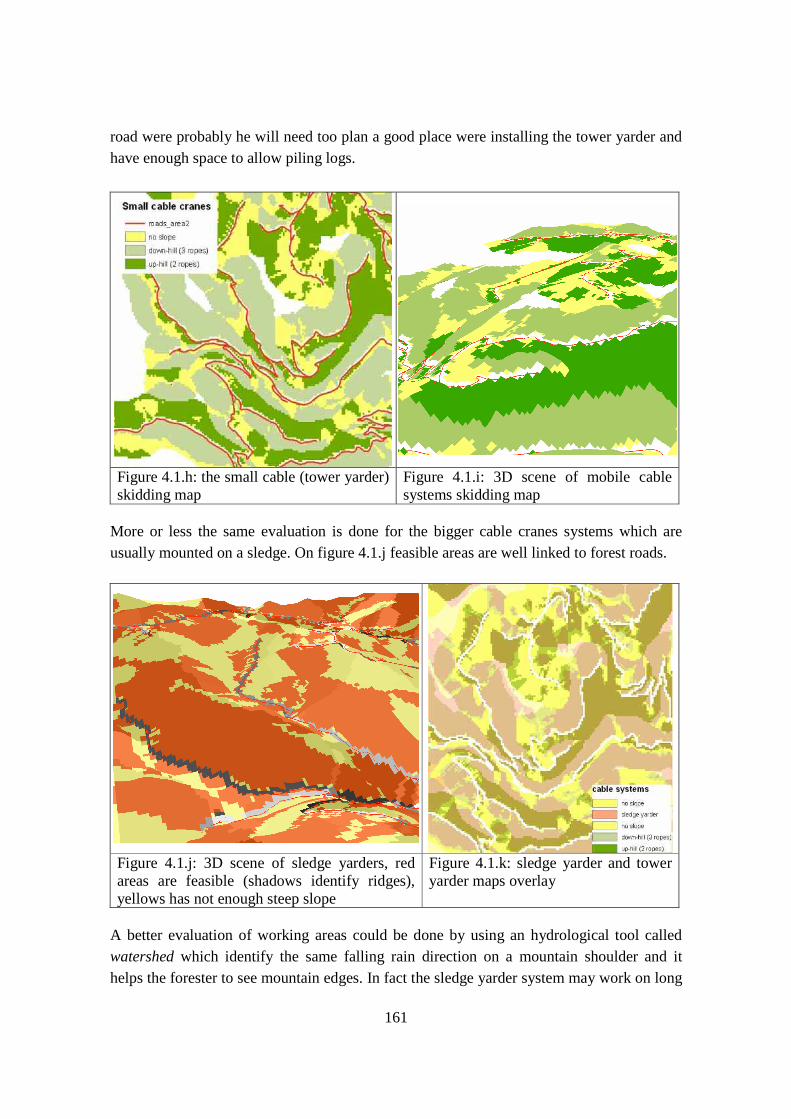


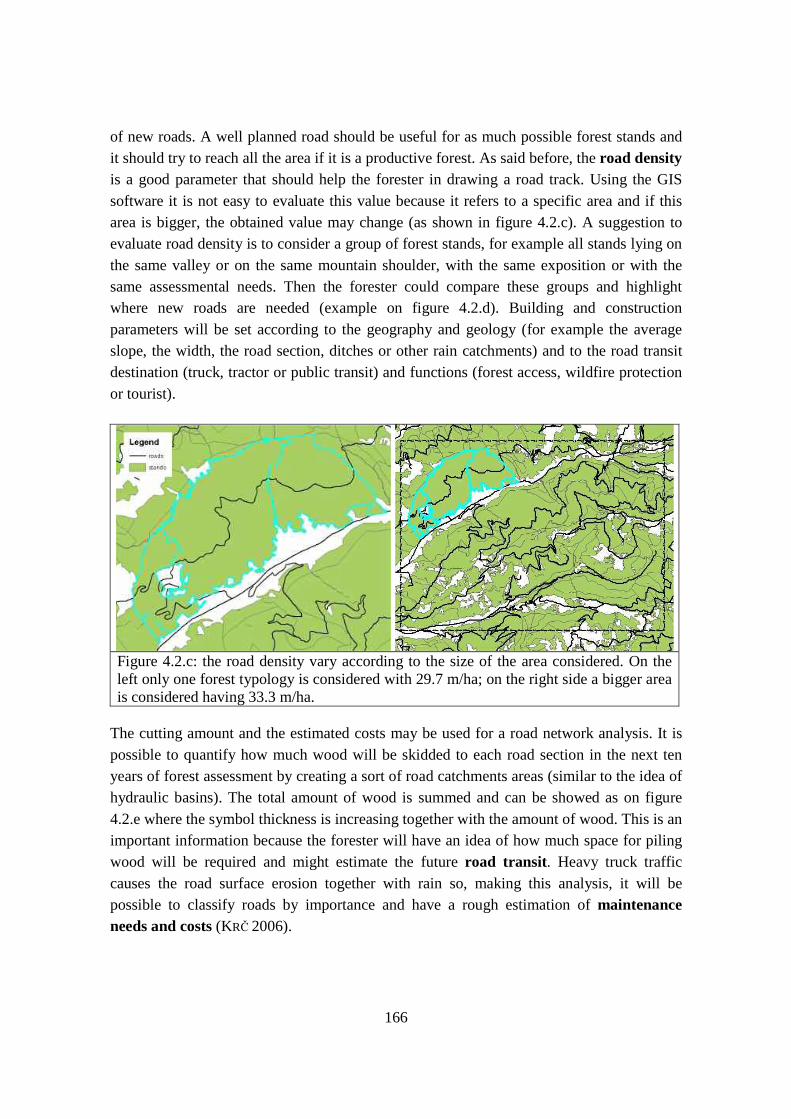

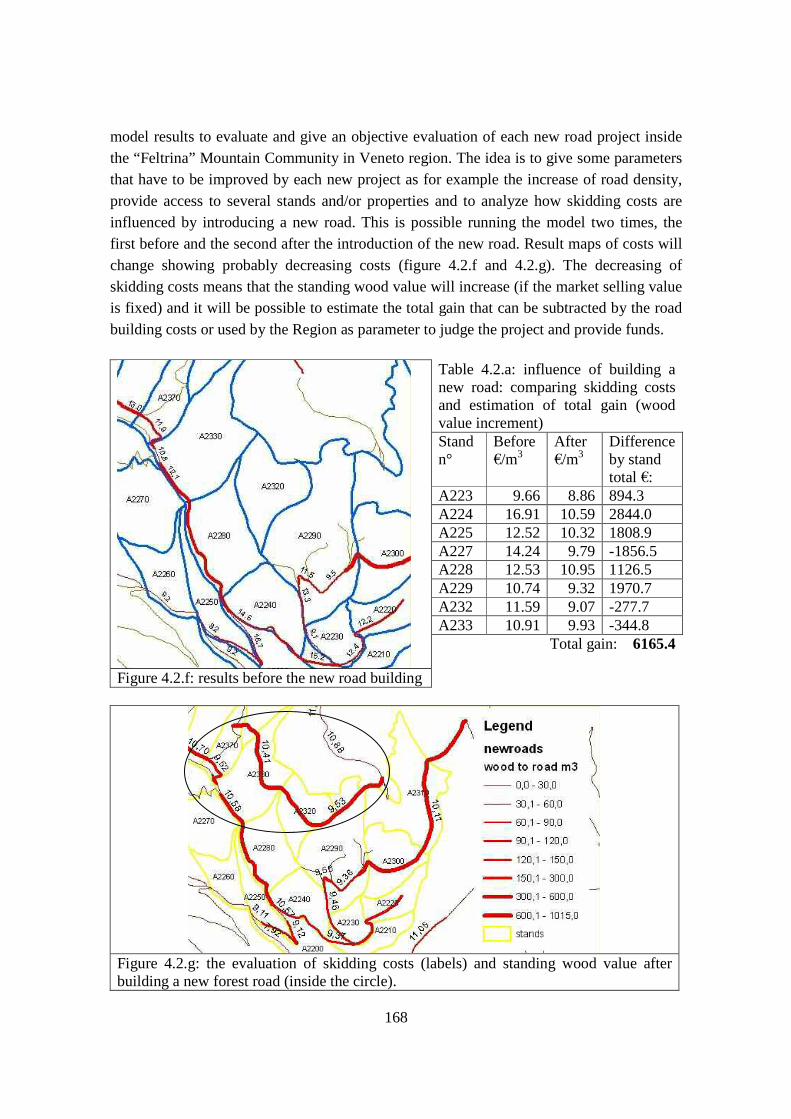

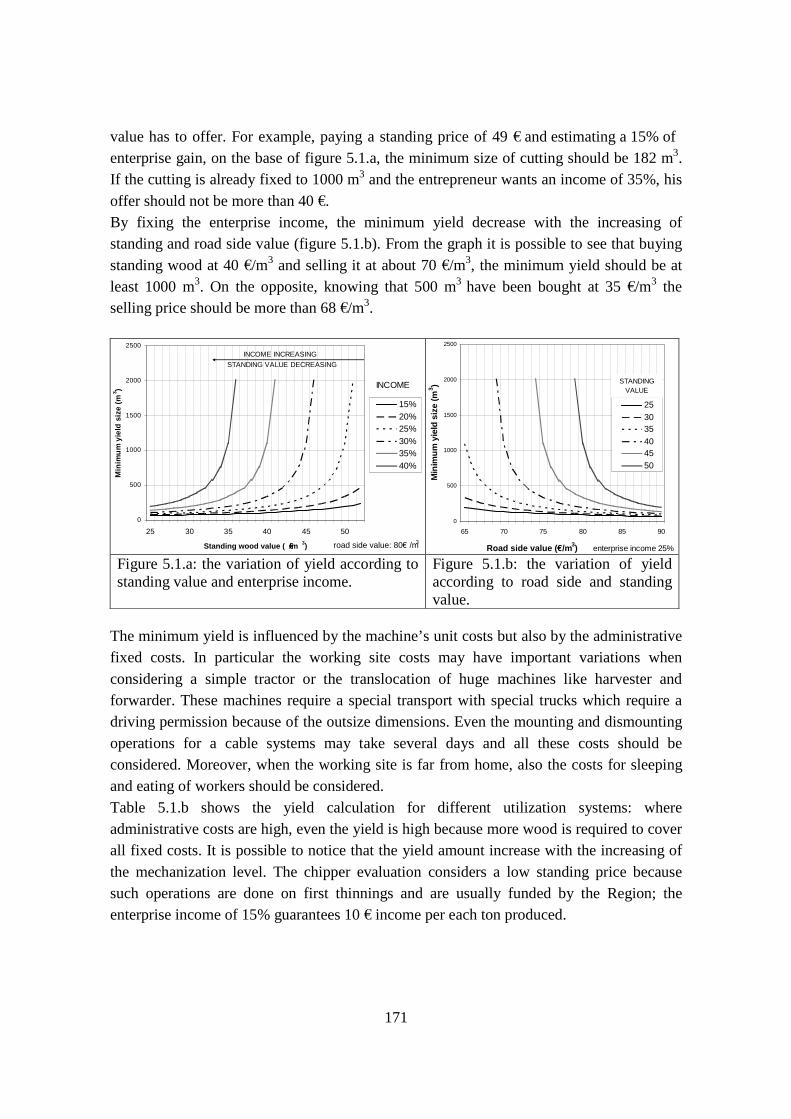
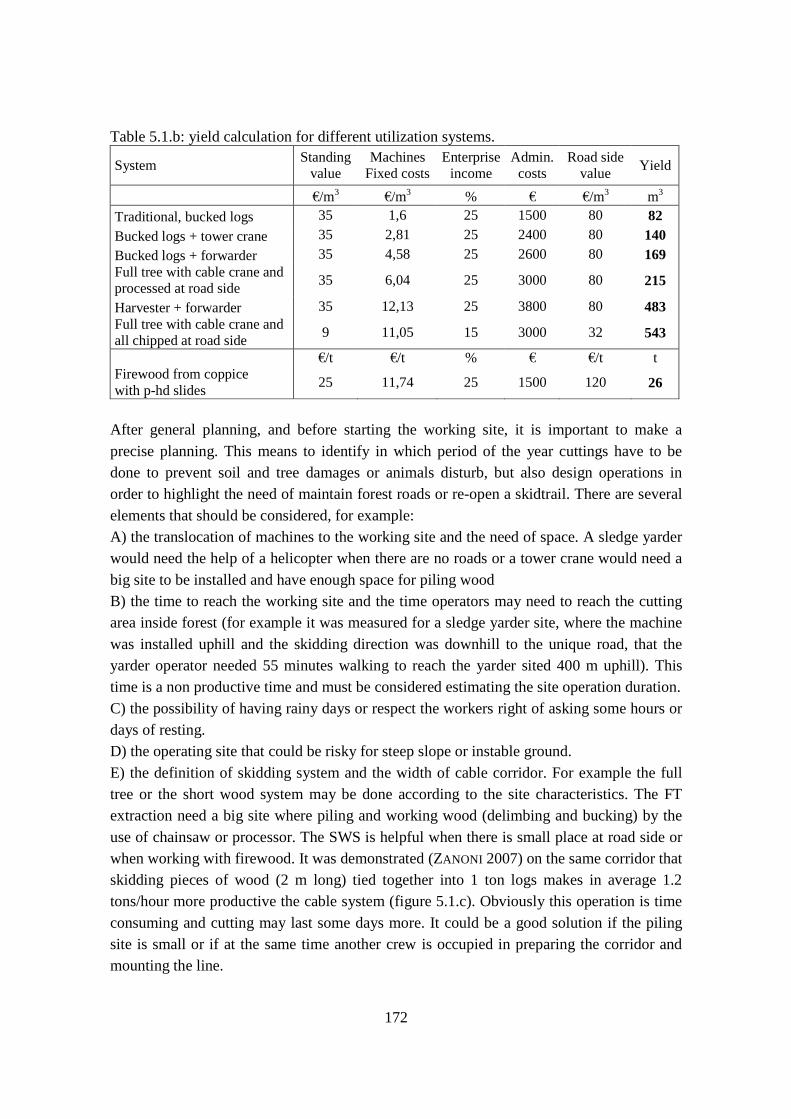
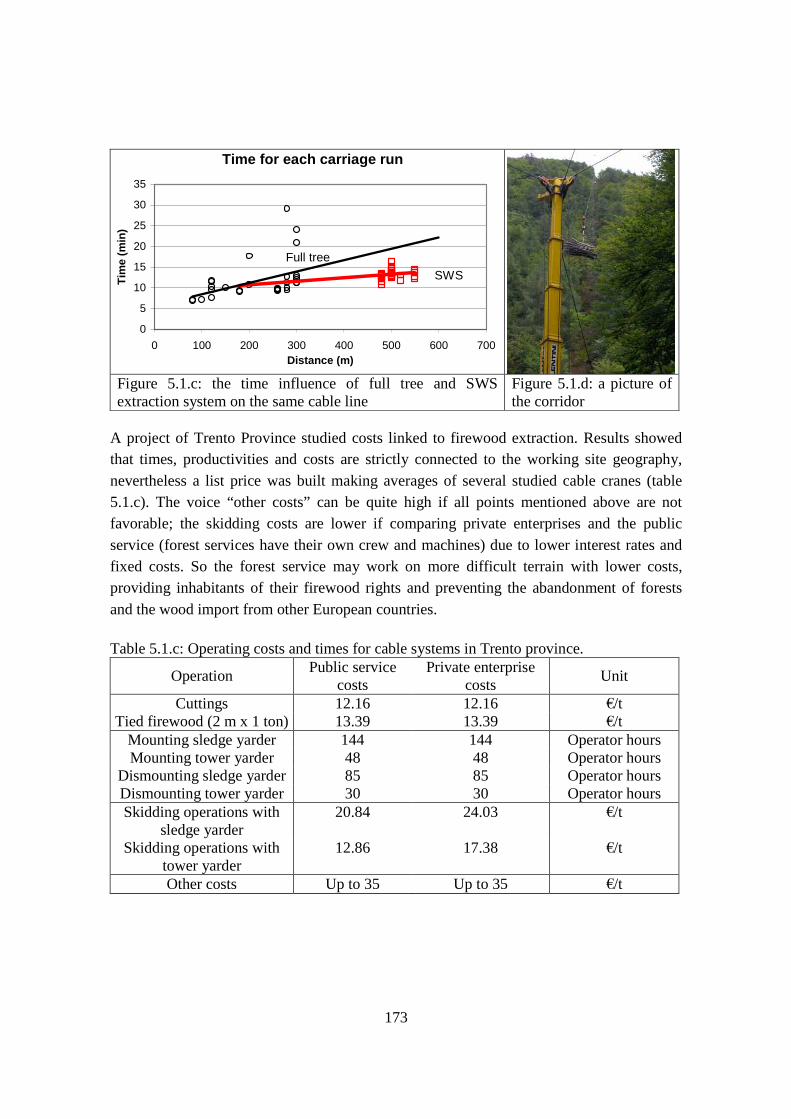

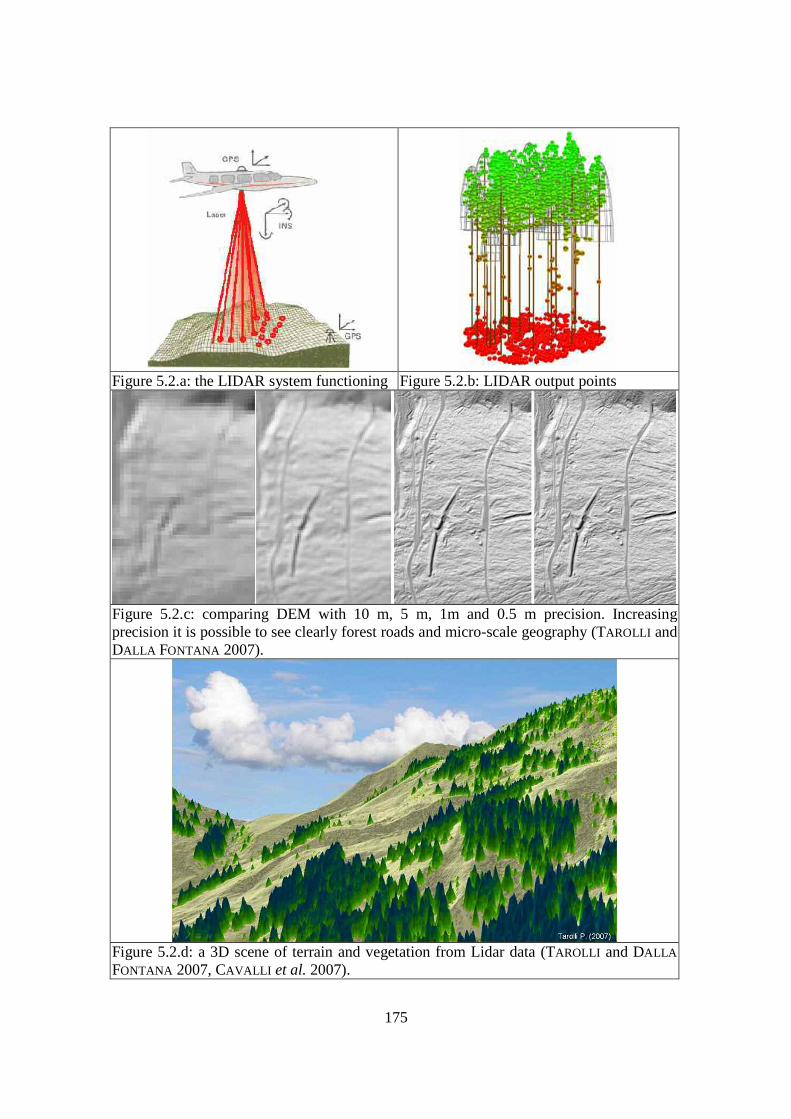

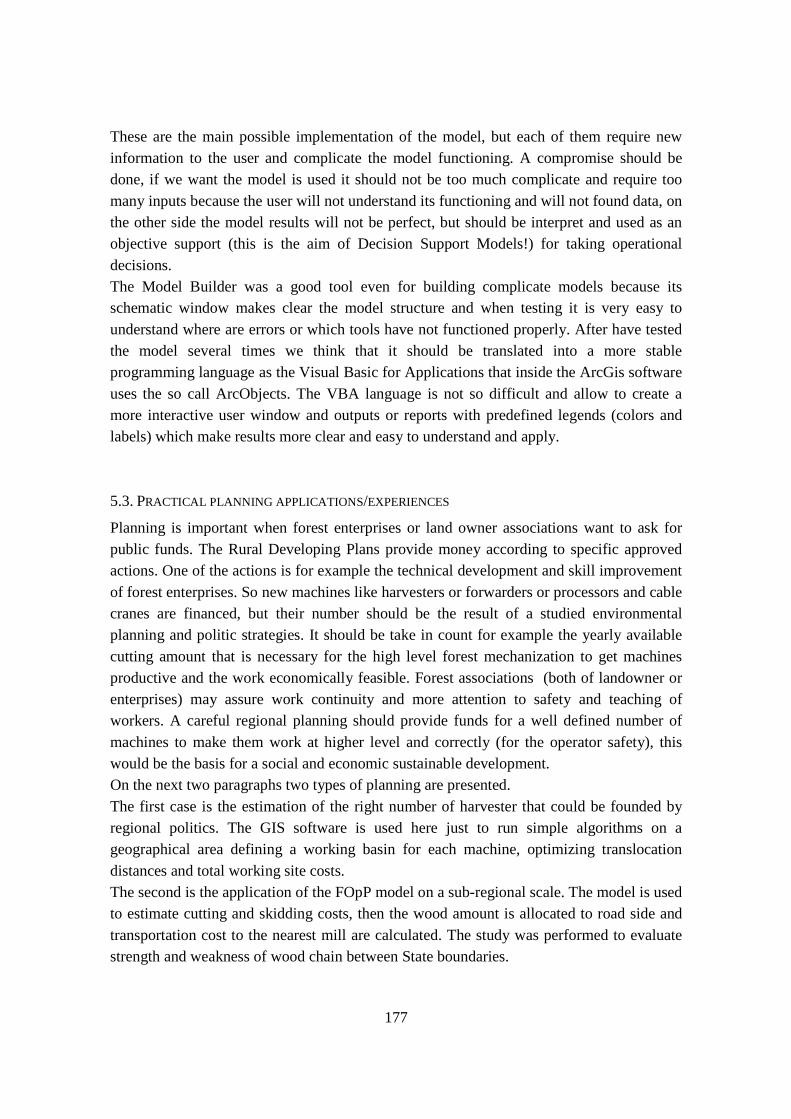
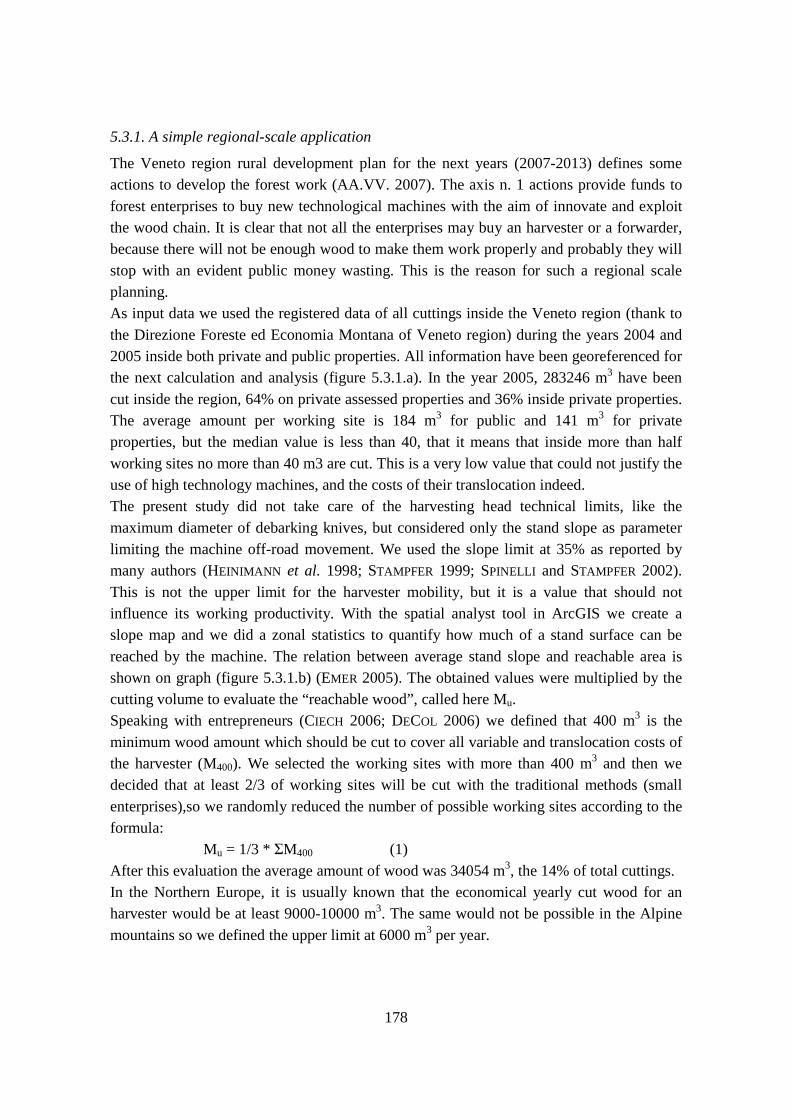


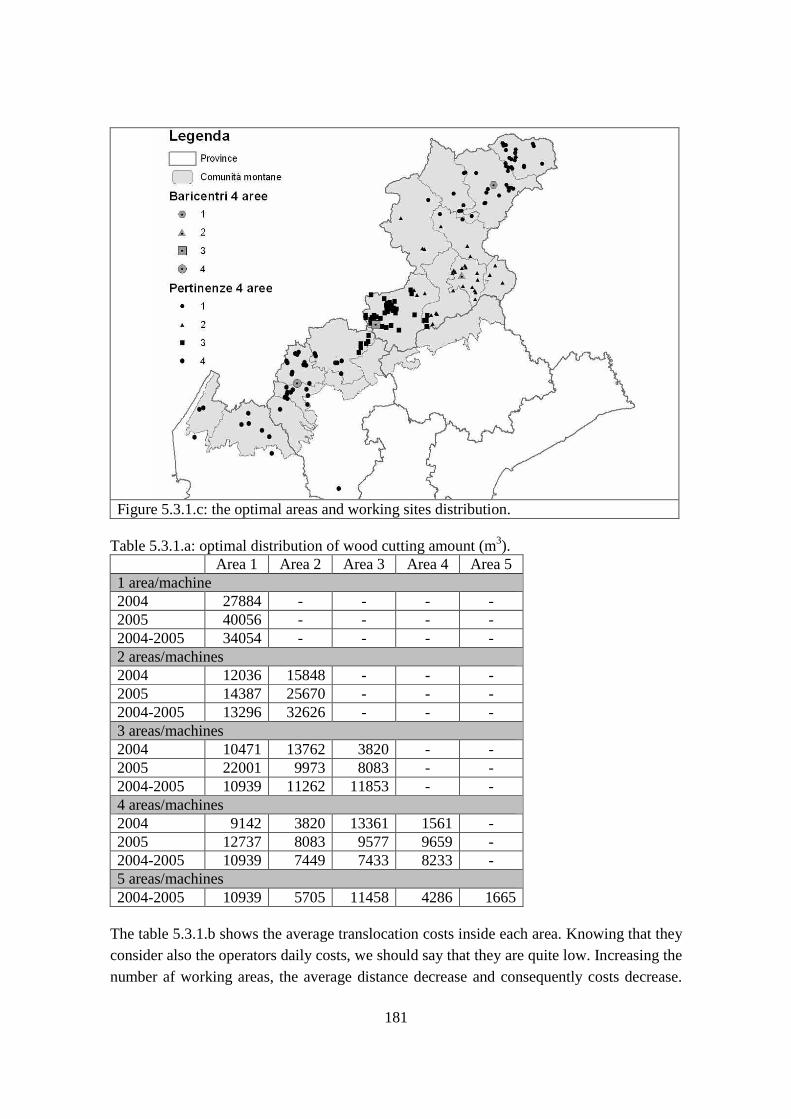
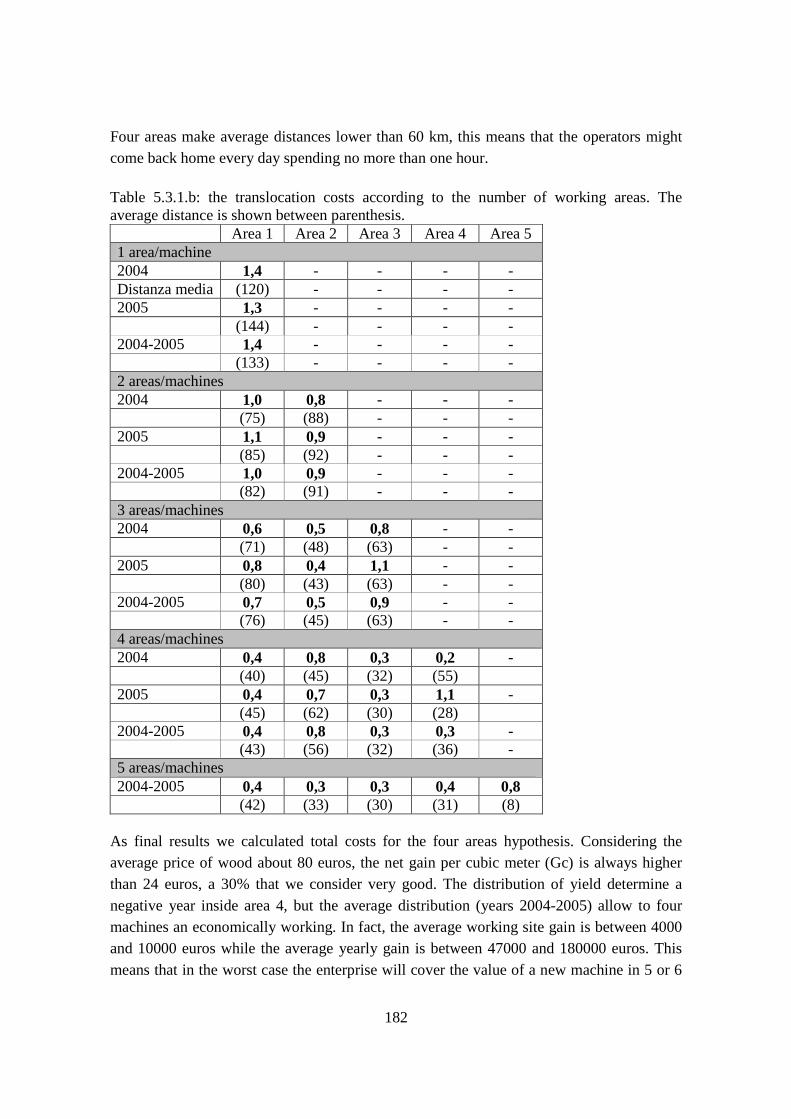


![Fisiopatologia APP. RESPIRATORIO.ppt [Sola lettura] · ¾Immaturità Funzionale dei Pneumociti ... stimolazioni meccaniche su tronchi o recettori nervosi: stenosi delle vie aeree,](https://static.documenti.site/doc/80x56/5e3d8c6239f5c0024d706b2c/fisiopatologia-app-sola-lettura-immaturit-funzionale-dei-pneumociti-stimolazioni.jpg)