
Stefano Mammi
Dipartimento di Scienze Chimiche
Università di Padova
Risonanza Magnetica Nuclearequalche principio e molte applicazioni
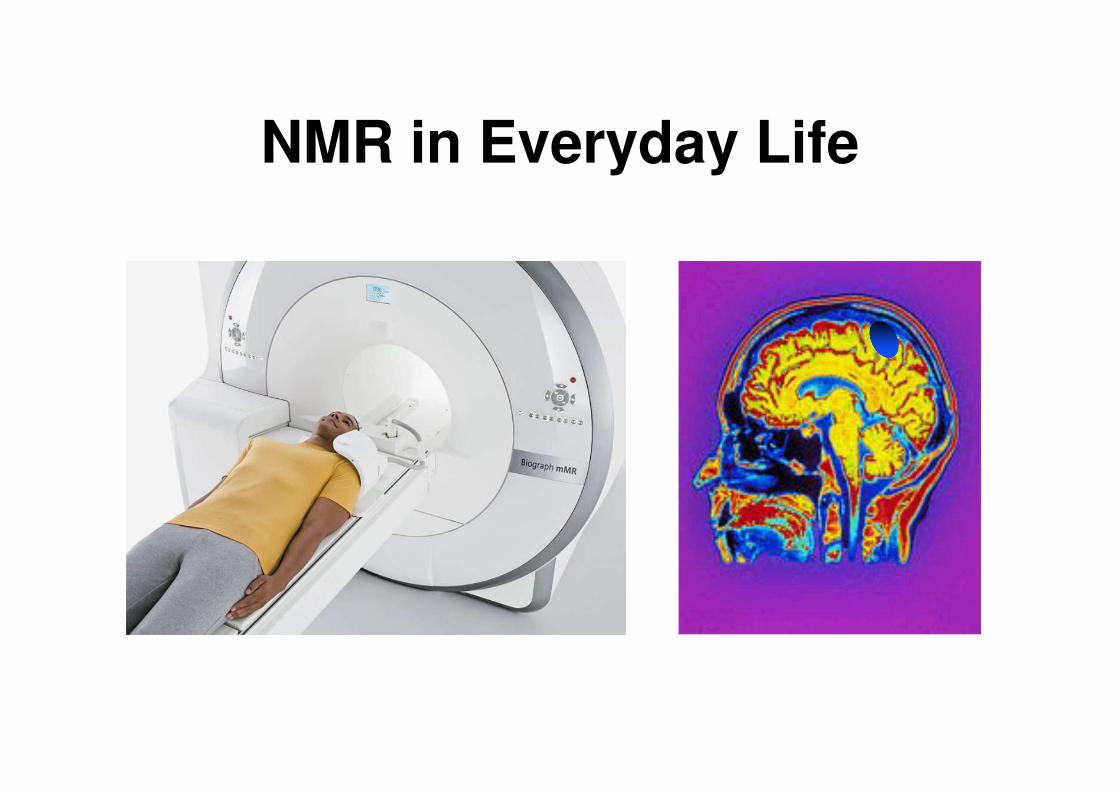
NMR in Everyday Life
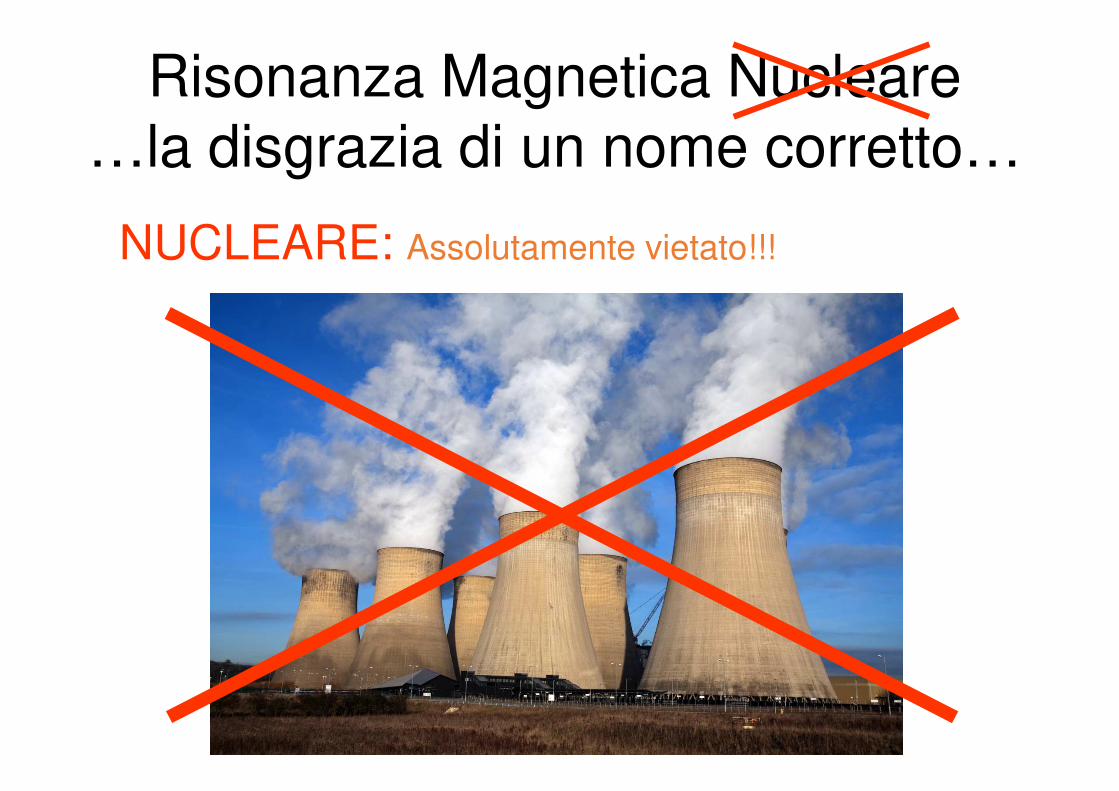
Risonanza Magnetica Nucleare…la disgrazia di un nome corretto…
NUCLEARE: Assolutamente vietato!!!
Risonanza Magnetica Nucleare…la disgrazia di un nome corretto…
NUCLEARE: Assolutamente vietato!!!
MAGNETICA: Molto pericoloso…
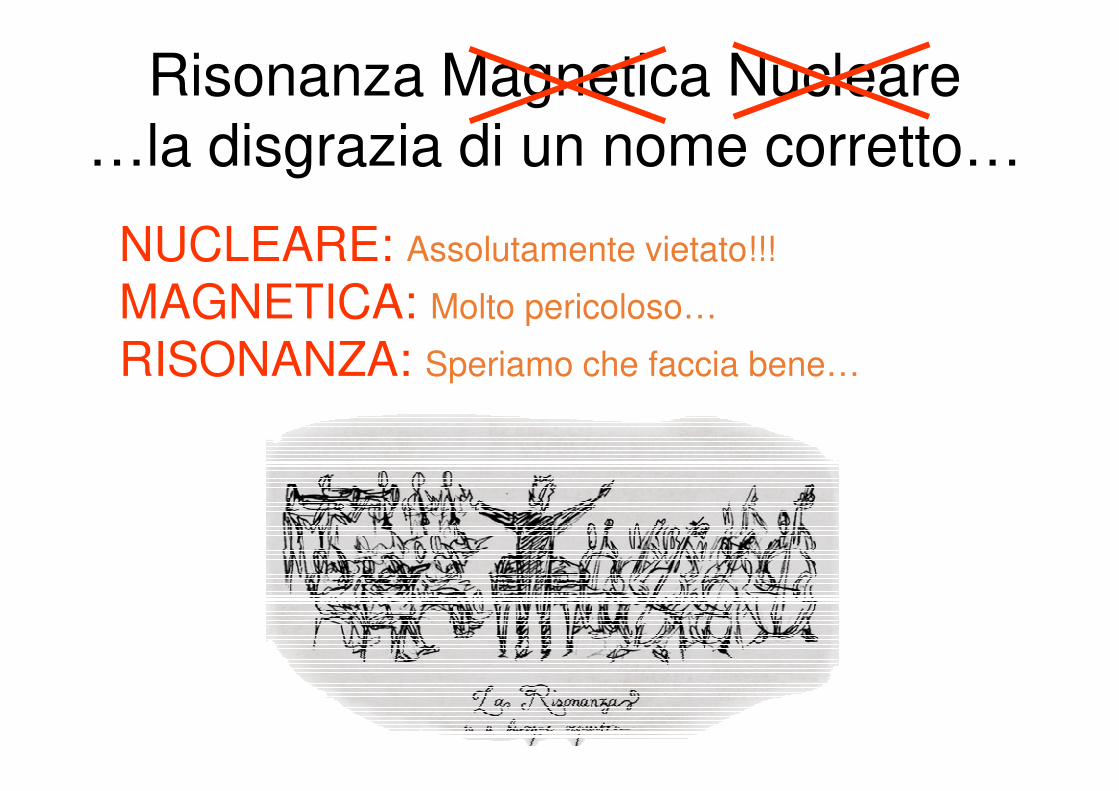
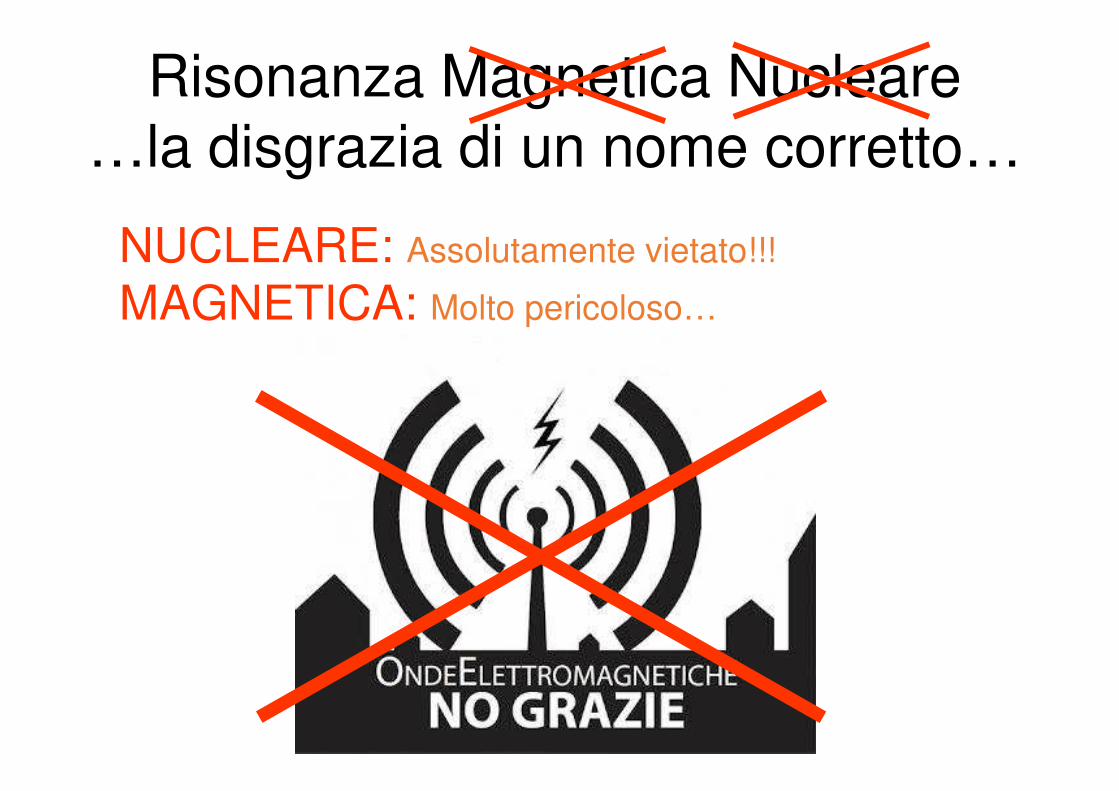
Risonanza Magnetica Nucleare…la disgrazia di un nome corretto…
NUCLEARE: Assolutamente vietato!!!
MAGNETICA: Molto pericoloso…
RISONANZA: Speriamo che faccia bene…
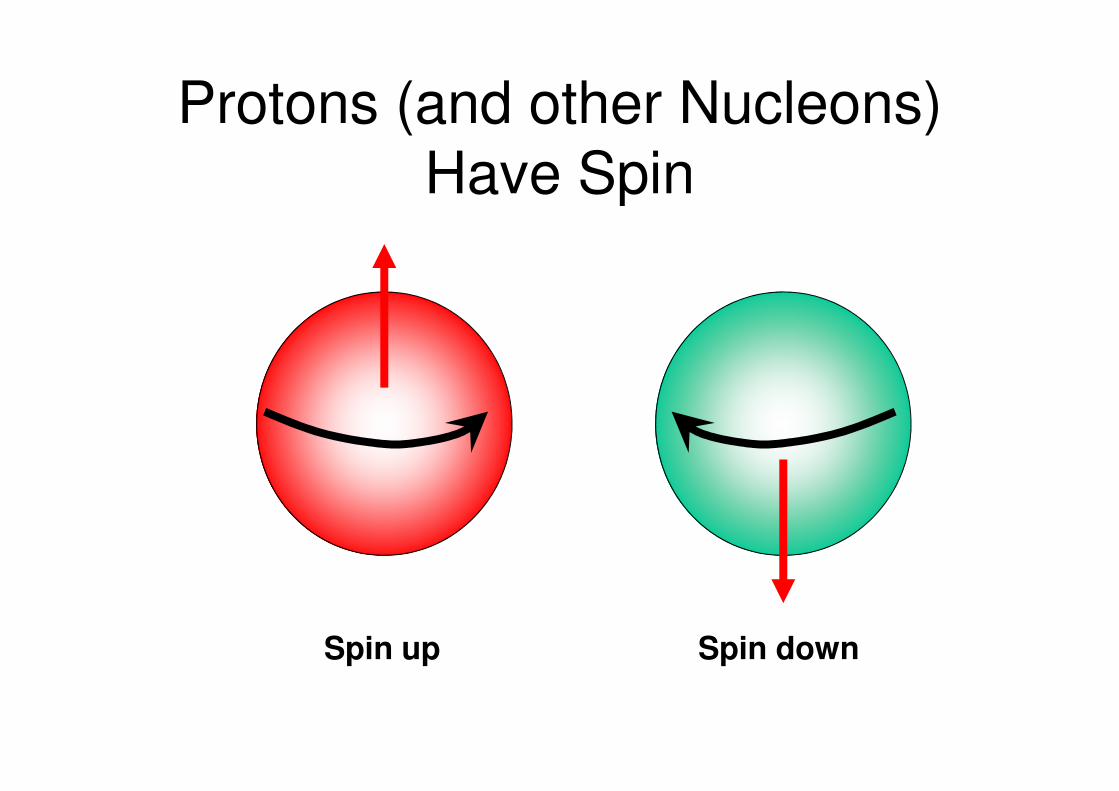
Protons (and other Nucleons) Have Spin
Spin up Spin down

Each Spinning Proton is Like a “Mini-Magnet”
Spin up Spin down
N
S
N
S

Principles of NMR
B0
M0
∆E = γhB0 = hω0 = hν0
kT
E
eP
P∆−
α
β =
M0 = Σµ = Mz
S
N

Principles of NMR
hν
Low Energy High Energy
SS
N N
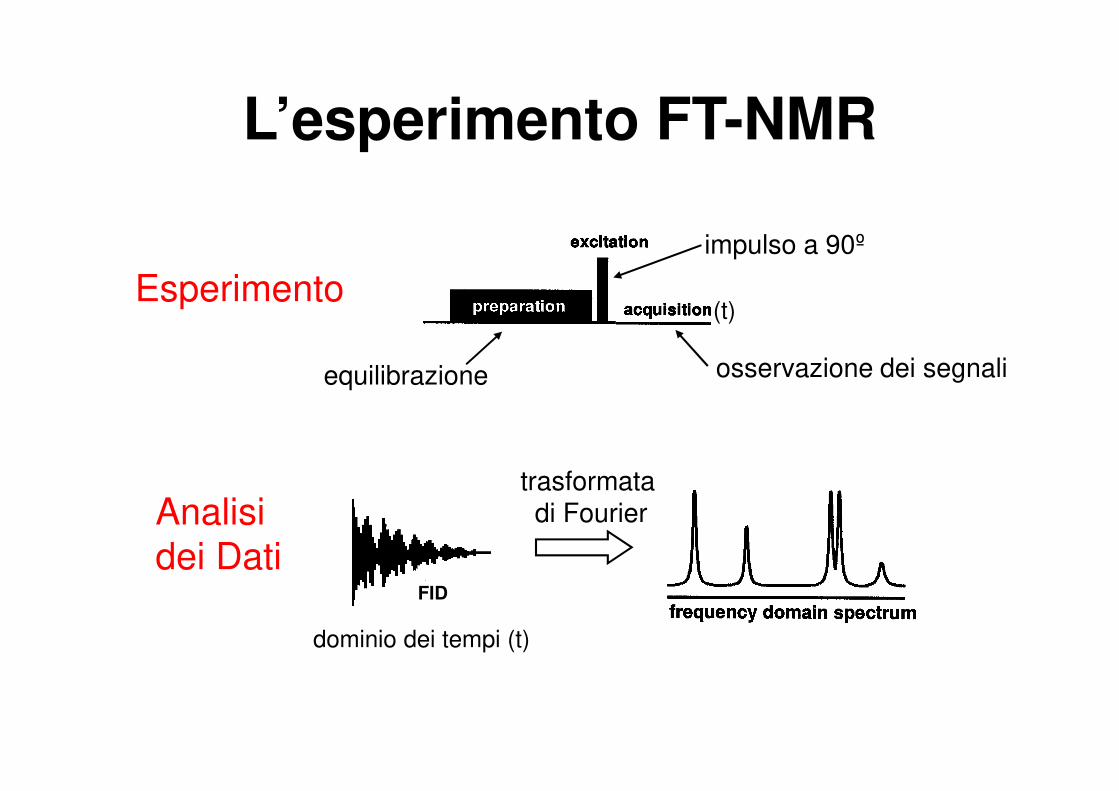
L’esperimento FT-NMR
equilibrazione
impulso a 90º
osservazione dei segnali
Esperimento(t)
Analisi
dei Dati
trasformata di Fourier
dominio dei tempi (t)
FID
8 7 6 5 4 3 2 1 0
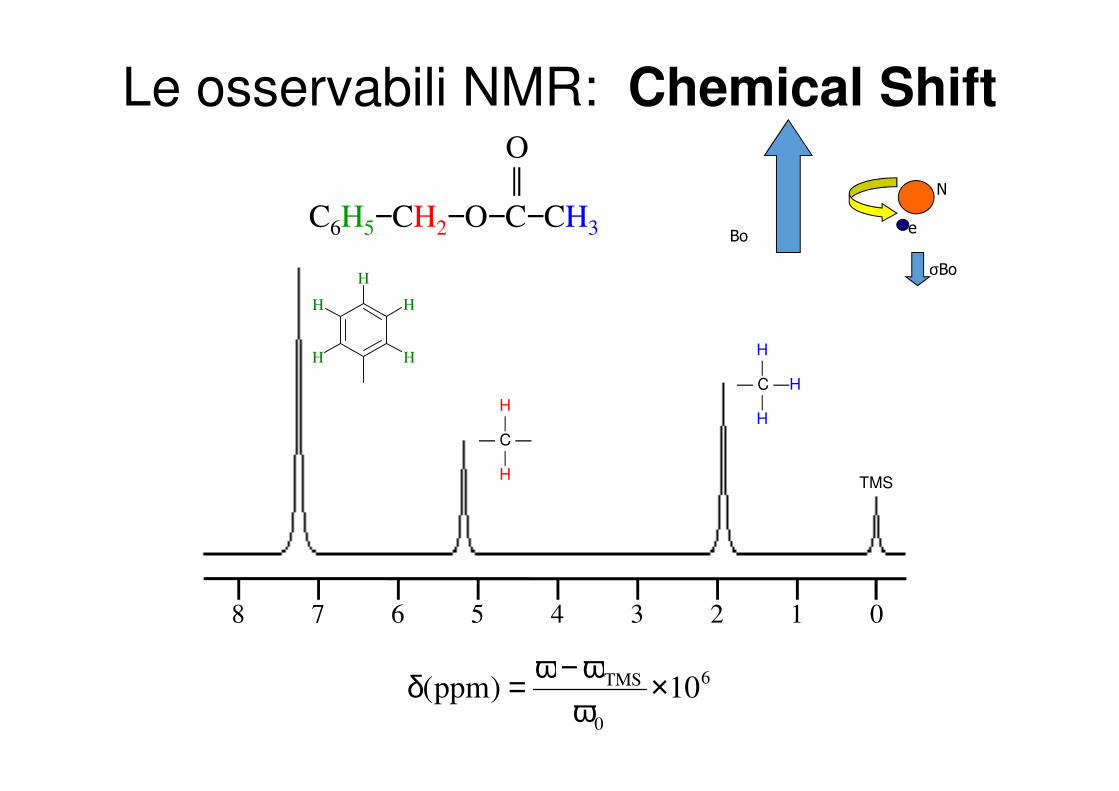
Le osservabili NMR: Chemical ShiftO
C6H5−CH2−O−C−CH3
H H
H
H
H
H|
— C —|H
H|
— C —H|H
TMS
6
0
TMS 10)ppm( ×ωω−ω=δ
N
eBo
σBo

Le osservabili NMR: Accoppiamento Scalare e Dipolare
�L’accoppiamento fra nuclei fornisce
informazioni sulla struttura
attraversolegami
attraversolo spazio
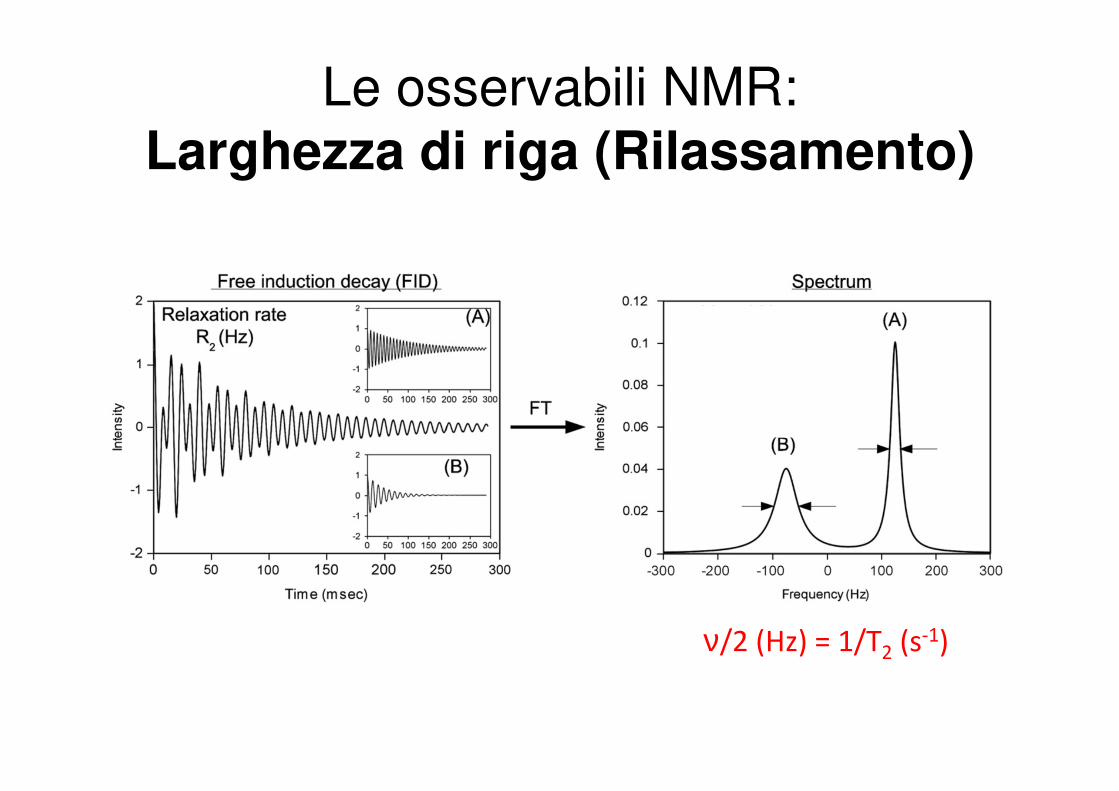
Le osservabili NMR:
Larghezza di riga (Rilassamento)
ν/2 (Hz) = 1/T2 (s-1)

8 7 6 5 4 3 2 1 08 7 6 5 4 3 2 1 0
Le osservabili NMR: Integrazione
O
C6H5−CH2−O−C−CH3
TMS
52
2132
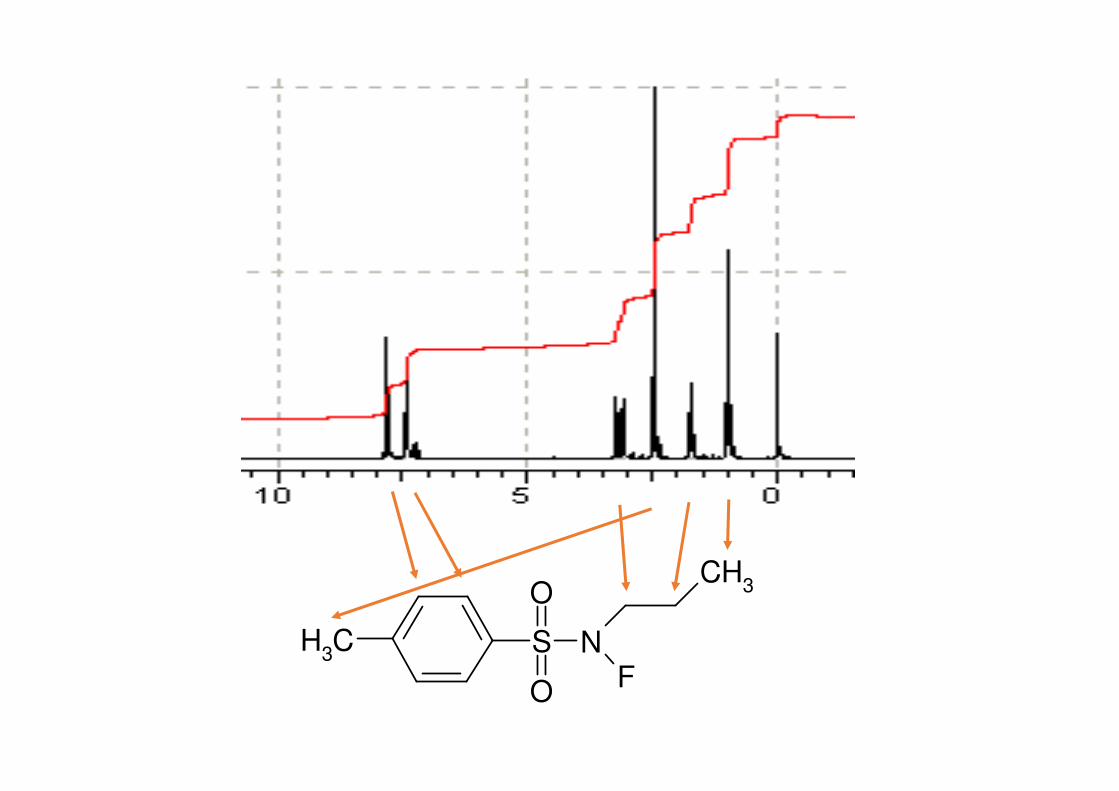
CH3 S
O
O
NF
CH3
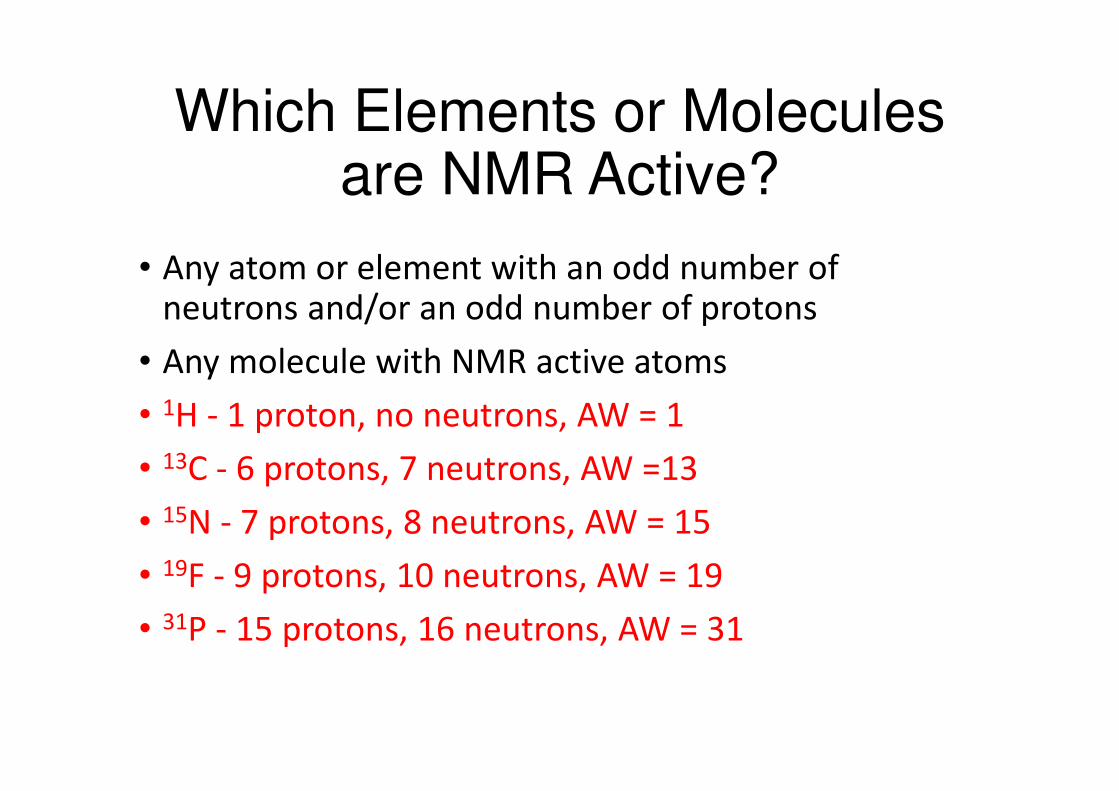
Which Elements or Molecules are NMR Active?
• Any atom or element with an odd number of neutrons and/or an odd number of protons
• Any molecule with NMR active atoms
• 1H - 1 proton, no neutrons, AW = 1
• 13C - 6 protons, 7 neutrons, AW =13
• 15N - 7 protons, 8 neutrons, AW = 15
• 19F - 9 protons, 10 neutrons, AW = 19
• 31P - 15 protons, 16 neutrons, AW = 31

Typical Applications of NMR:1 - Structural (chemical) elucidation
* Natural product chemistry
* Synthetic organic chemistry
- analytical tool of choice of synthetic chemists
- used in conjunction with MS and IR
2 - Study of dynamic processes
* reaction kinetics
* study of equilibrium (chemical or structural)
3 - Structural (three-dimensional) studies
* Proteins, Protein-ligand complexes
* DNA, RNA, Protein/DNA complexes
* Polysaccharides
4 - Metabolomics
5 - Drug Design
* Structure Activity Relationships by NMR
6 - Medicine – MRI, fMRI
7 - Solid State NMR
* Materials
* Structural biology
* Pharmaceutical analysis
8 - TD-NMR
MRI images of the Human Brain
NMR Structure of MMP-13 complexed to a ligand
O
O
O
O
OH
OO
O
HO
NH
OH
OO
O
O
Taxol (natural product)
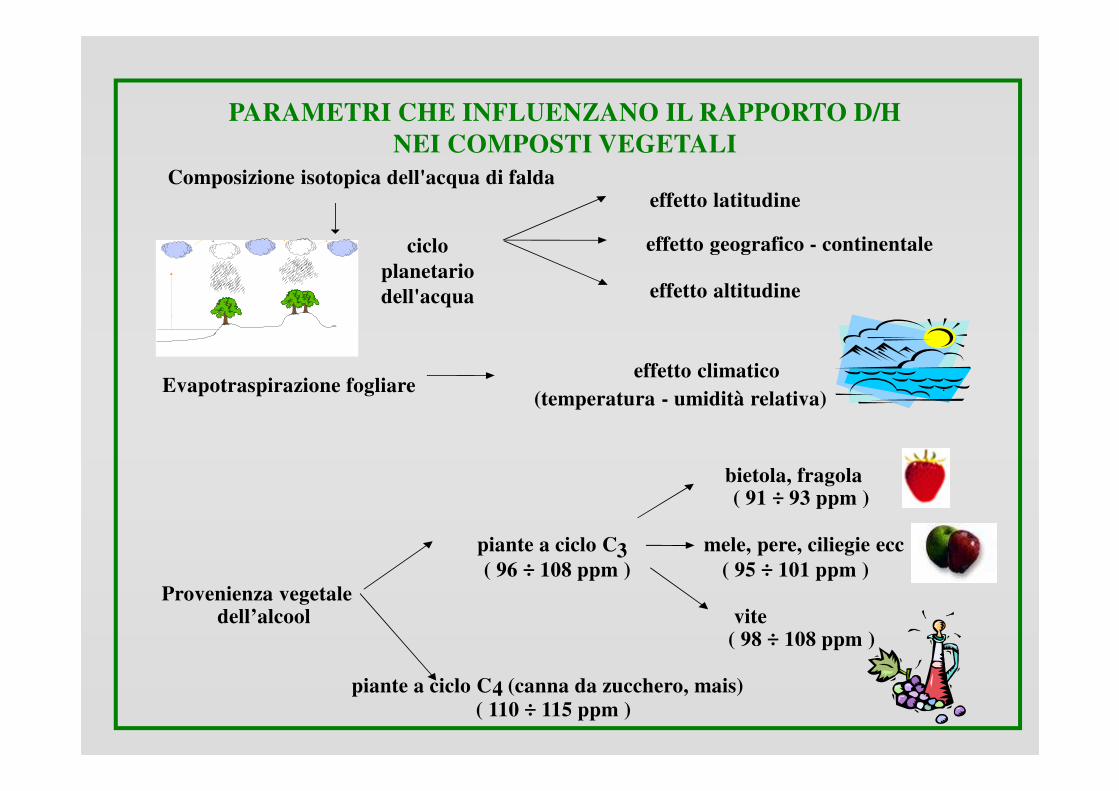
PARAMETRI CHE INFLUENZANO IL RAPPORTO D/H
NEI COMPOSTI VEGETALI
Composizione isotopica dell'acqua di faldaeffetto latitudine
ciclo
planetario
dell'acqua
effetto geografico - continentale
effetto altitudine
Evapotraspirazione fogliareeffetto climatico
(temperatura - umidità relativa)
bietola, fragola ( 91 ÷ 93 ppm )
piante a ciclo C3 mele, pere, ciliegie ecc
( 96 ÷ 108 ppm ) ( 95 ÷ 101 ppm )
Provenienza vegetaledell’alcool vite
( 98 ÷ 108 ppm )
piante a ciclo C (canna da zucchero, mais)4 ( 110 ÷ 115 ppm )
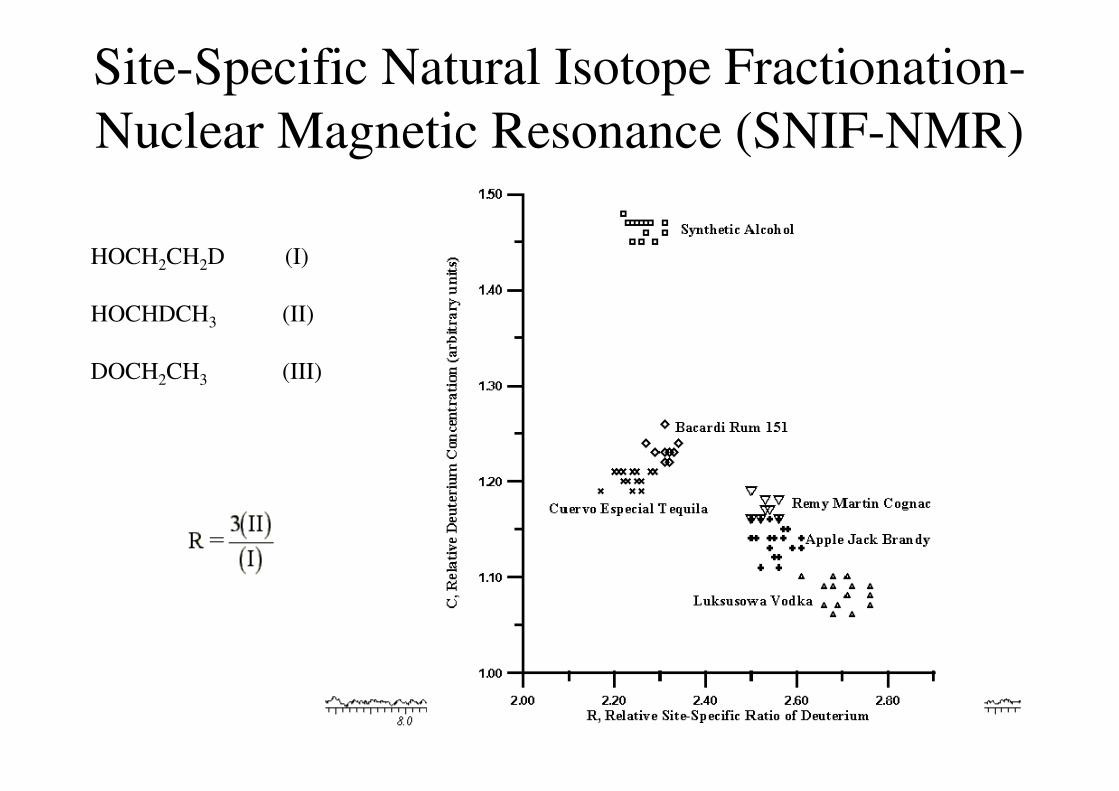
Site-Specific Natural Isotope Fractionation-
Nuclear Magnetic Resonance (SNIF-NMR)
HOCH2CH2D (I)
HOCHDCH3 (II)
DOCH2CH3 (III)
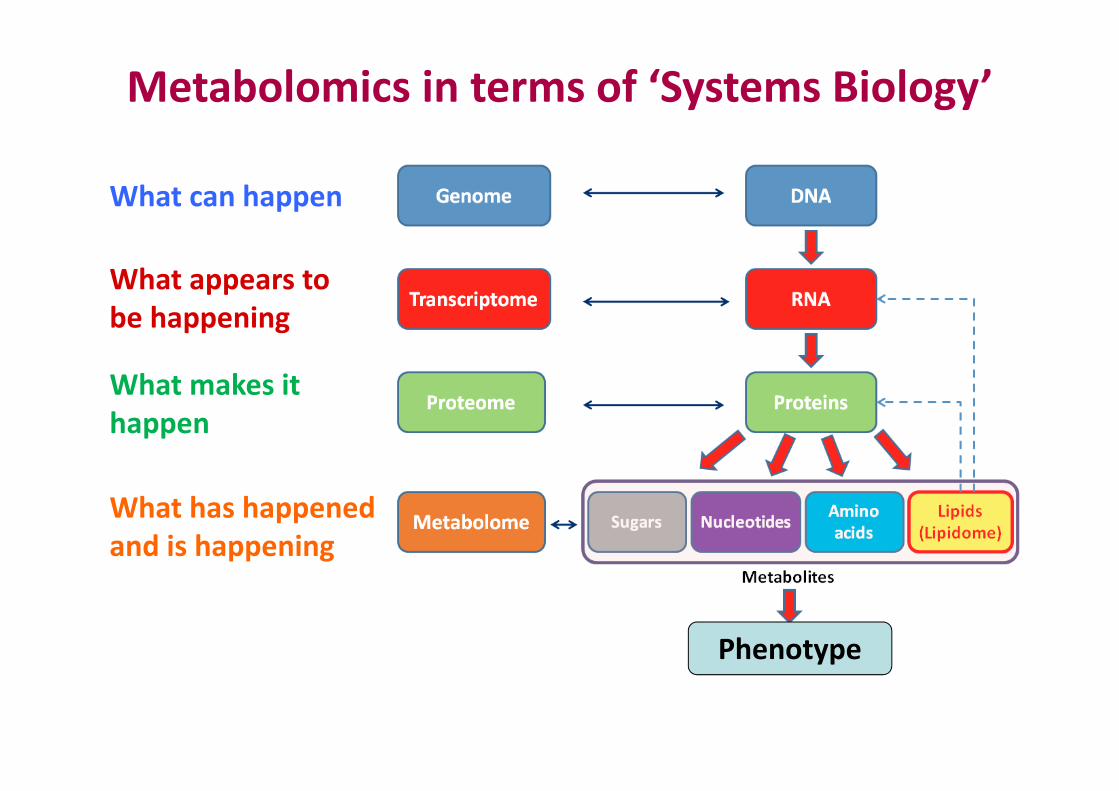
Metabolomics in terms of ‘Systems Biology’
What can happen
What appears to
be happening
What makes it
happen
What has happened
and is happening
Phenotype
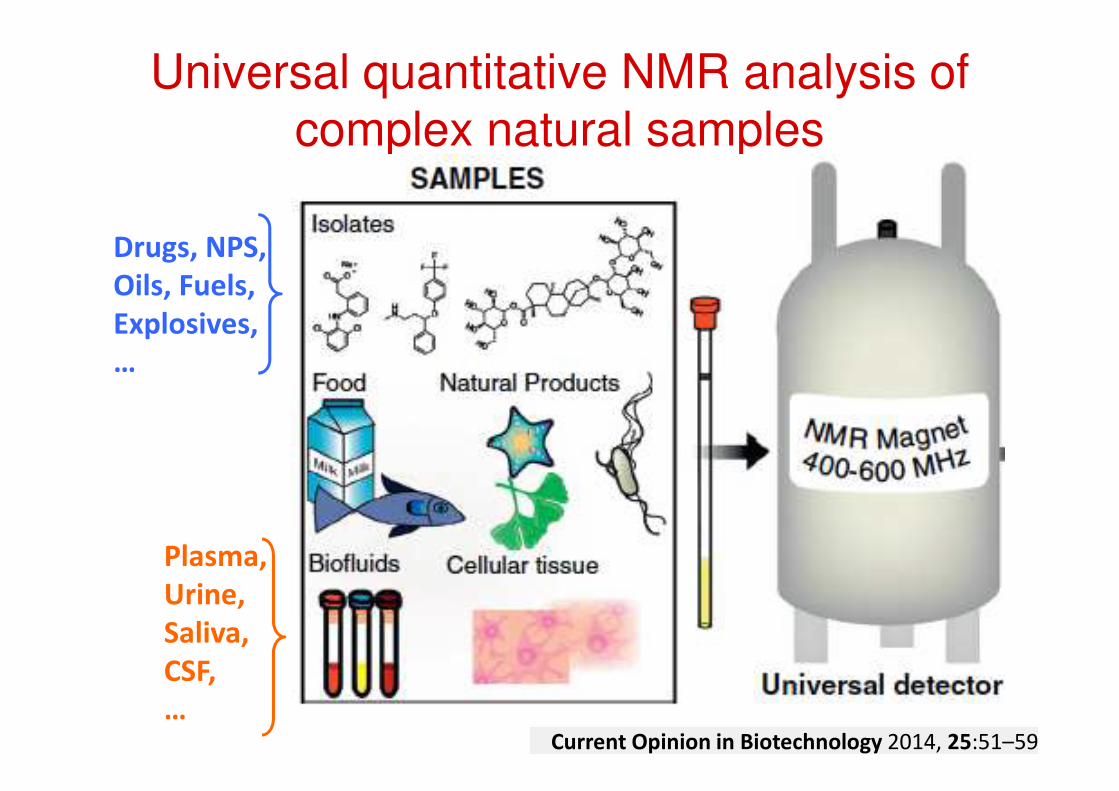
Universal quantitative NMR analysis of complex natural samples
Plasma,
Urine,
Saliva,
CSF,
…
Drugs, NPS,
Oils, Fuels,
Explosives,
…
Current Opinion in Biotechnology 2014, 25:51–59

1234567ppm
hippurate urea
allantoin creatininehippurate
2-oxoglutarate
citrate
TMAO
succinatefumarate
water
creatinine
taurine
1234567ppm
-25
-20
-15
-10
-5
0
5
10
15
20
25
-30 -20 -10 0 10
PC1
PC2
Metodi
quantitativi
Metodi chemiometrici
(fingerprinting e pattern recognition)
• Identificare e quantificare quanti più metaboliti possibile
(o una selezione)
• Usare l’intero spettro come fingerprint
(analisi statistica)
Due Approcci alla Metabolomica
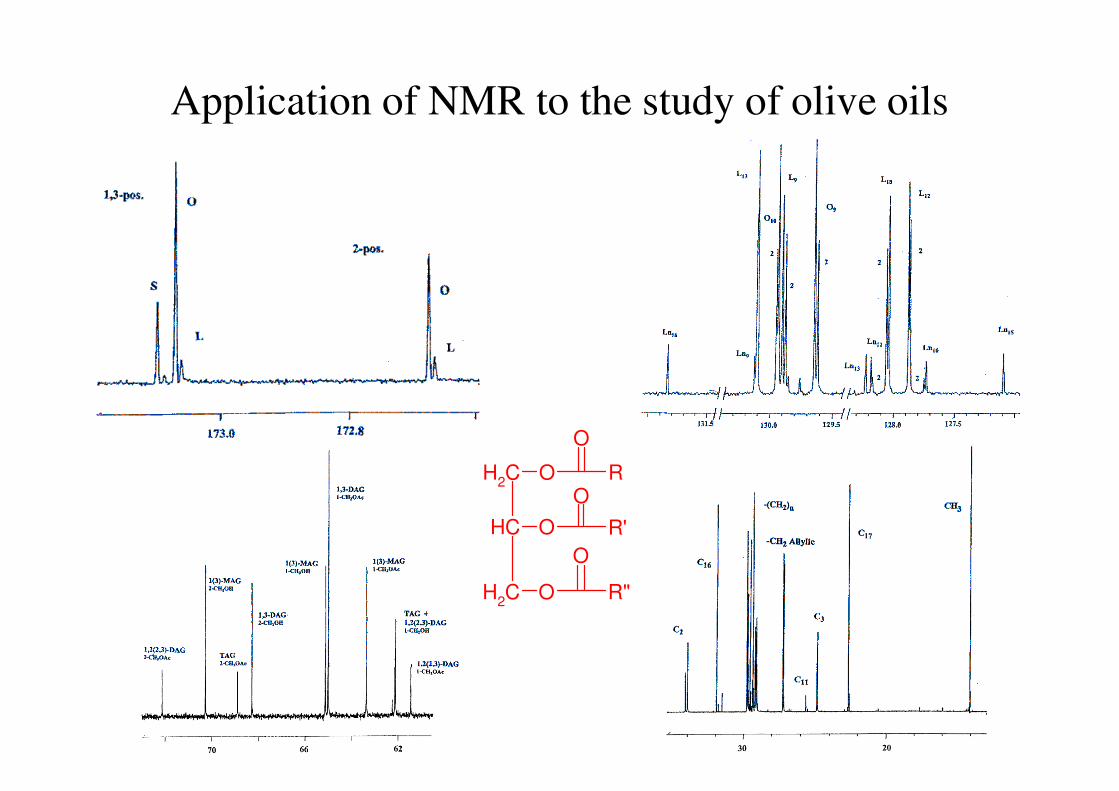
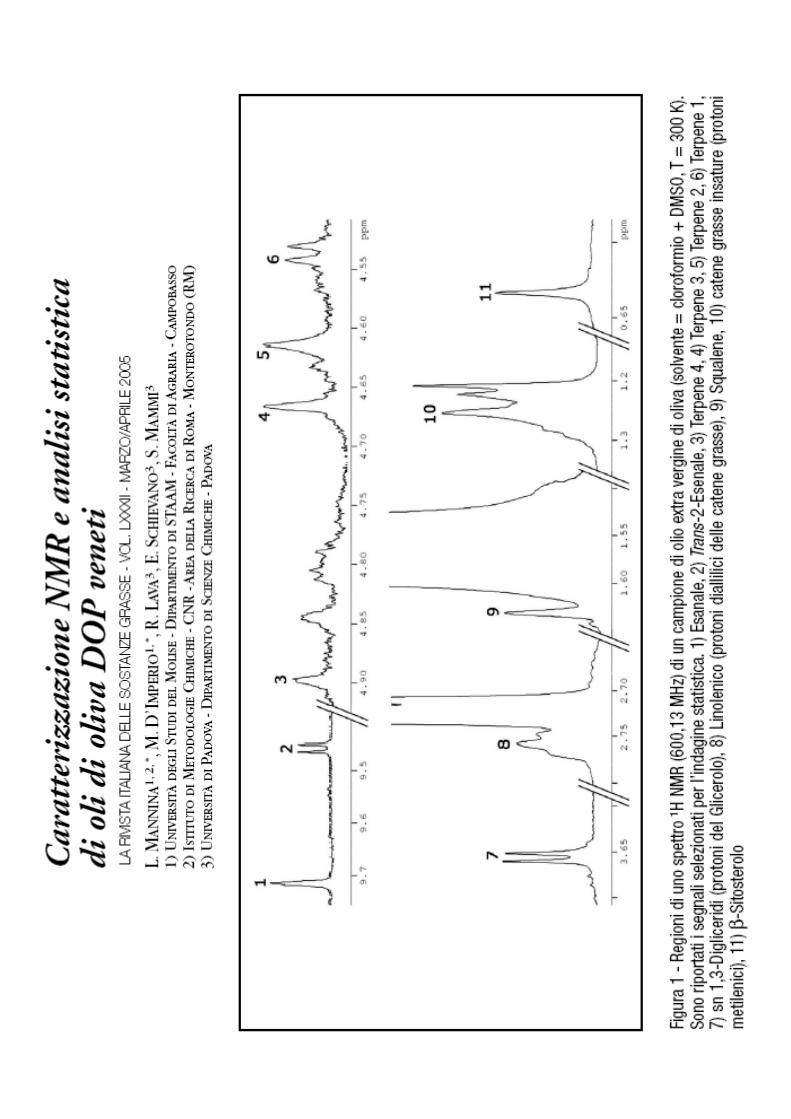
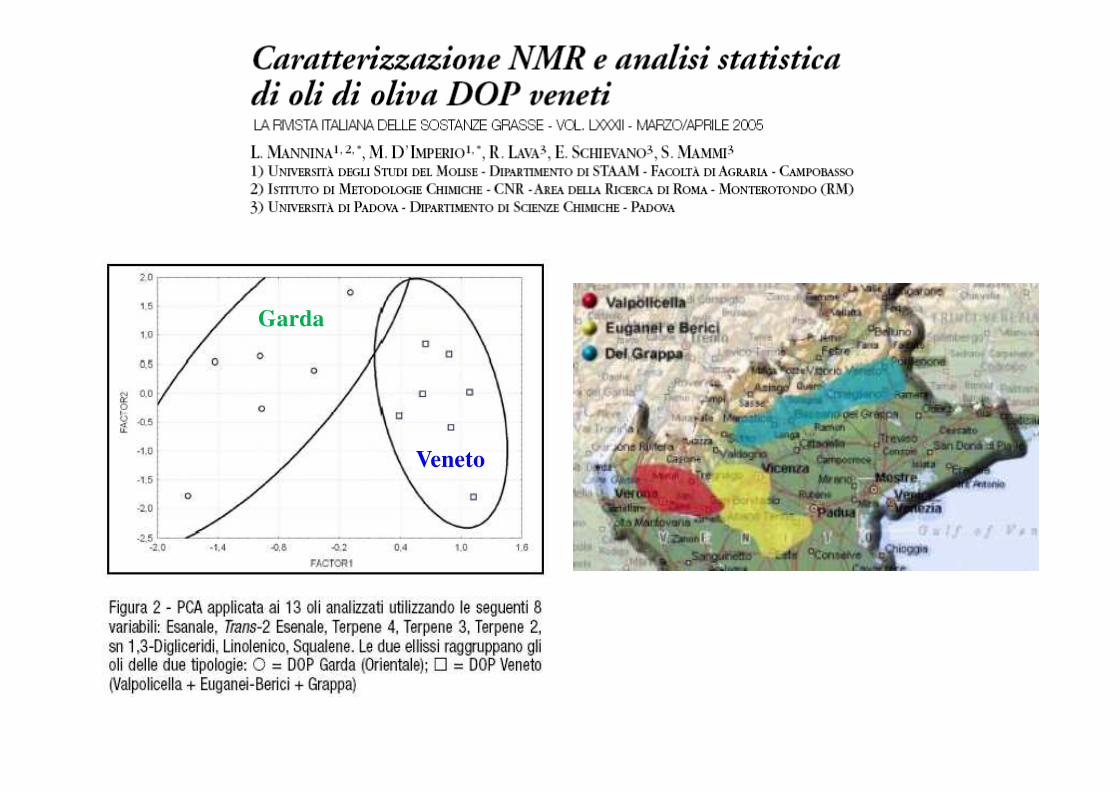
Application of NMR to the study of olive oils
CH2
CH
CH2
O
O
O
O
R"
O
RO
R'

Adulterazione di Olio E.V. d’Oliva
con Altri Oli Vegetali
Olio di nocciola
Olio E.V. d’oliva
Mannina, Sobolev, Segre,
Spectroscopy Europe 15 (2003) 6-14

8.70 8.65 8.60 8.55
Chemical Shift ( ppm)
8.70 8.65 8.60 8.55
Chemical Shift ( ppm)
Histamine in Cheese and Fish
Health and Hygiene Indicator
J. Agric. Food Chem. 2009, 57, 2647–2652
negative
HMF in HoneyO
OOH
Targeted-qNMR
Freshness and preservation state
IndicatorMagn. Reson. Chem. 2009, 47, 868–872
positive
LoQ 2 mg/kg
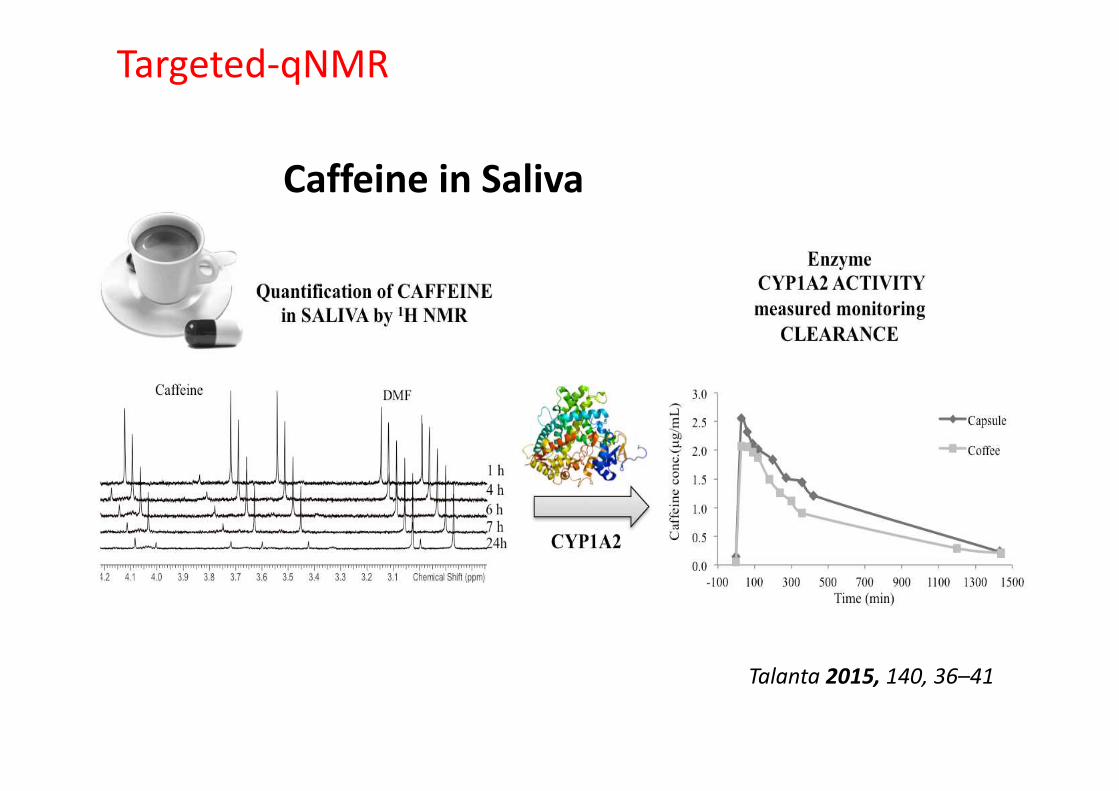
Caffeine in Saliva
Talanta 2015, 140, 36–41
Targeted-qNMR
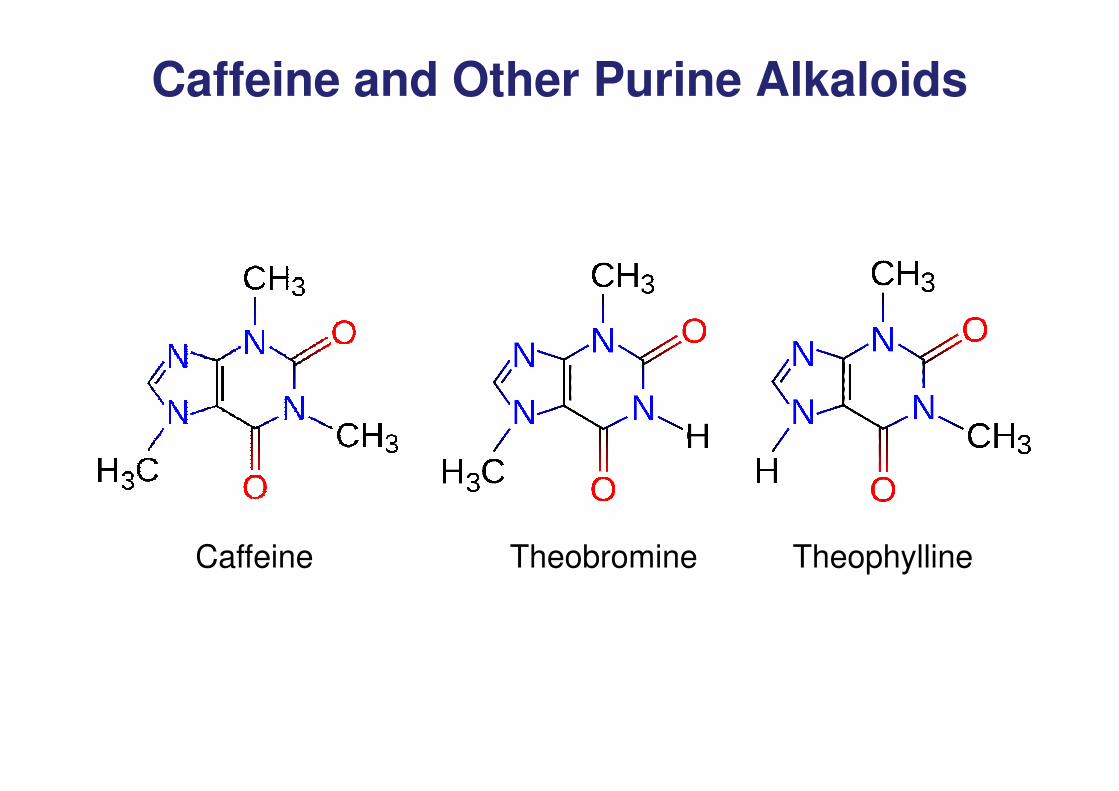
Caffeine and Other Purine Alkaloids
Caffeine Theobromine Theophylline
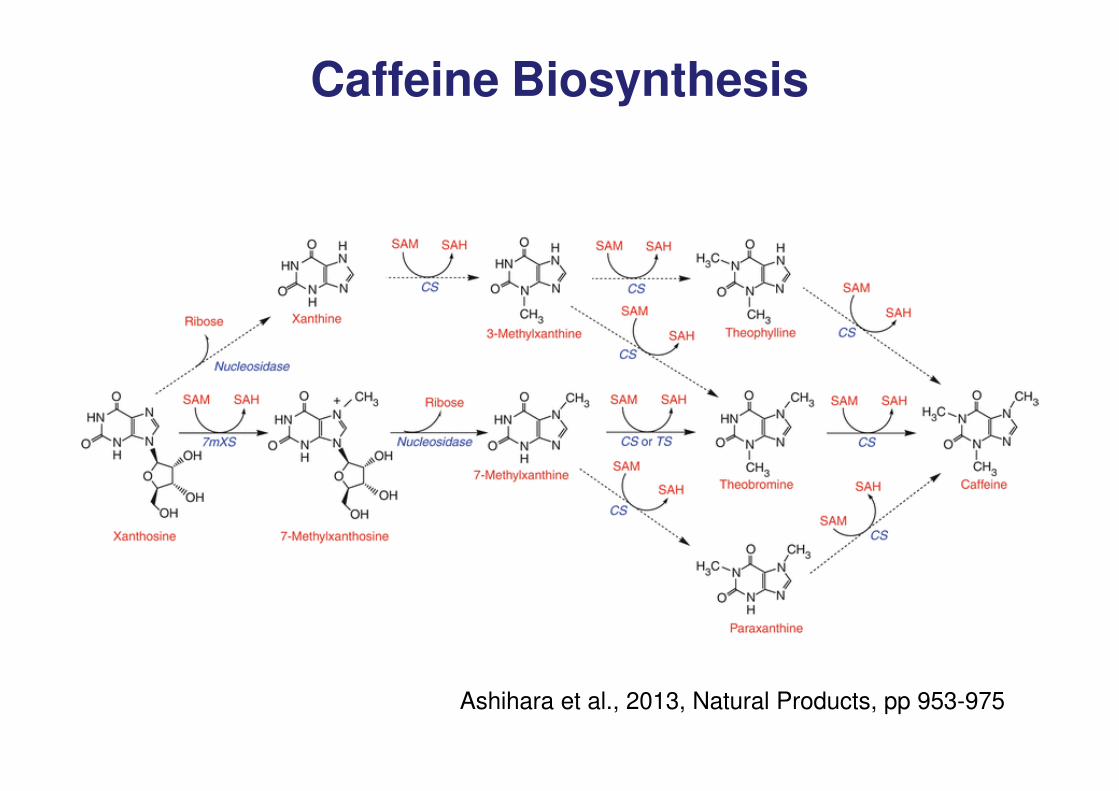
Caffeine Biosynthesis
Ashihara et al., 2013, Natural Products, pp 953-975
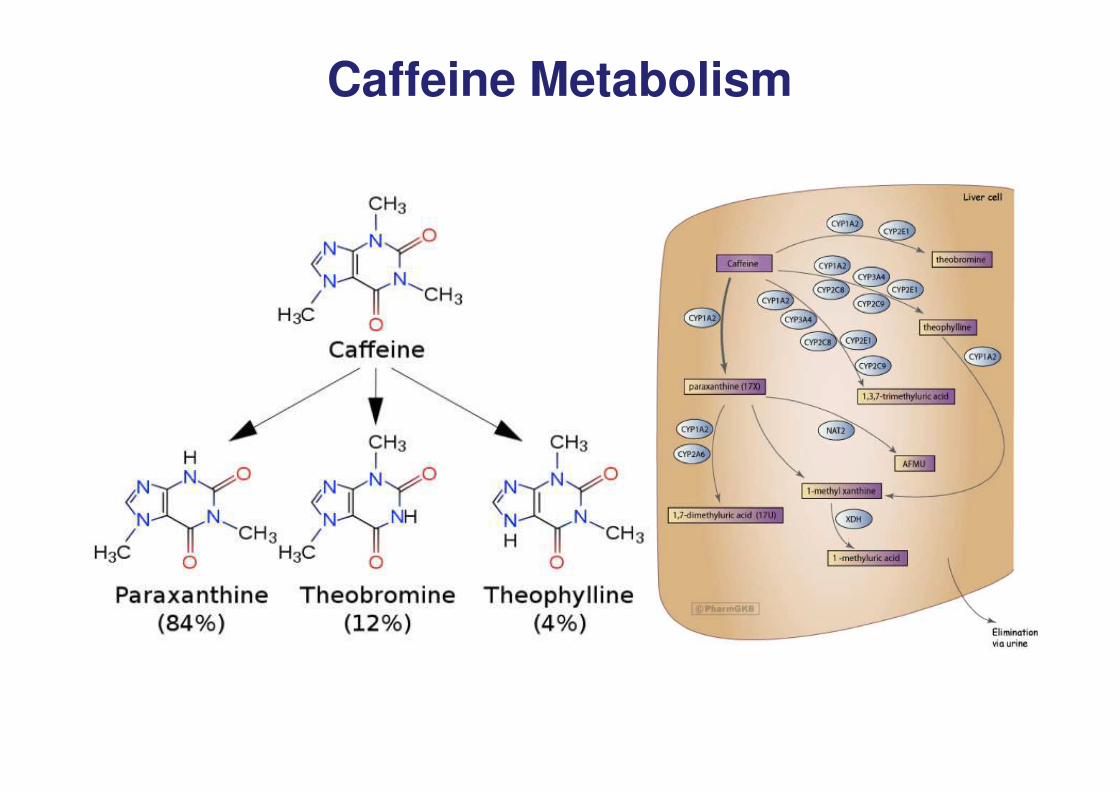
Caffeine Metabolism

Fig. 3. Zoom of the aliphatic region of the spectra of saliva extracts at different times after caffeine intake
Schievano et al. Talanta 140 (2015) 36–41
Caffeine Metabolism

Schievano et al. Talanta 140 (2015) 36–41
Fig. 4. Experimentation (black diamond = capsule, gray squares = espresso coffee).
Caffeine Metabolism

Identification of Robusta Coffee in Blends
JAFC 2014, 62, 12309−12314

• Grows between 600 and 2000 m
elevation
> Sweet
> Aromatic
< Caffeine
• More popular and 40% more
expensive
• Grows between 0 and 1000 m
elevation
• The plant is more resilient
> Astringent
> Full-bodied
< Delicate
• More economic
COFFEE
Coffea Arabica Coffea Canephora
var. Robusta

DIN 10779 Method
→ Grinding of the beans
→ Soxhlet extraction with tBME for 5 hours
→ Saponification
→ Extraction of the non-saponifiable fraction with tBME (up to 1-2
days)
→ Anhydrification and filtration
→ Solvent evaporation
→ HPLC analysis with UV-vis detector (about 45 minutes)
→ Limit of quantification: down to 2% of Robusta in the blend
At least 2 days are necessary
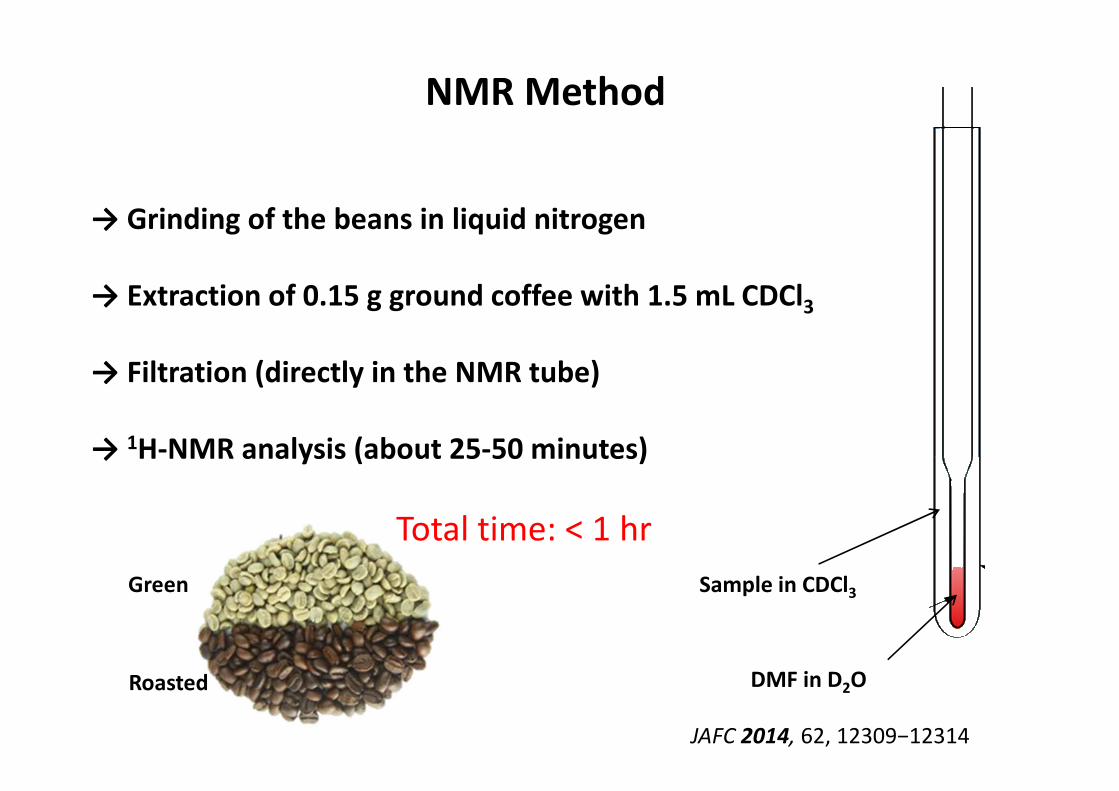
→ Grinding of the beans in liquid nitrogen
→ Extraction of 0.15 g ground coffee with 1.5 mL CDCl3
→ Filtration (directly in the NMR tube)
→ 1H-NMR analysis (about 25-50 minutes)
Sample in CDCl3
DMF in D2O
Total time: < 1 hr
NMR Method
Green
Roasted
JAFC 2014, 62, 12309−12314

16-OMC is a marker of Robusta coffee
JAFC 2014, 62, 12309−12314
LoD 5 mg/kg
LoQ 20 mg/kg< 0.9% of Robusta in the blend

1234567ppm
hippurate urea
allantoin creatininehippurate
2-oxoglutarate
citrate
TMAO
succinatefumarate
water
creatinine
taurine
1234567ppm
-25
-20
-15
-10
-5
0
5
10
15
20
25
-30 -20 -10 0 10
PC1
PC2
Metodi
quantitativi
Metodi chemiometrici
(fingerprinting e pattern recognition)
• Identificare e quantificare quanti più metaboliti possibile
(o una selezione)
• Usare l’intero spettro come fingerprint
(analisi statistica)
Due Approcci alla Metabolomica
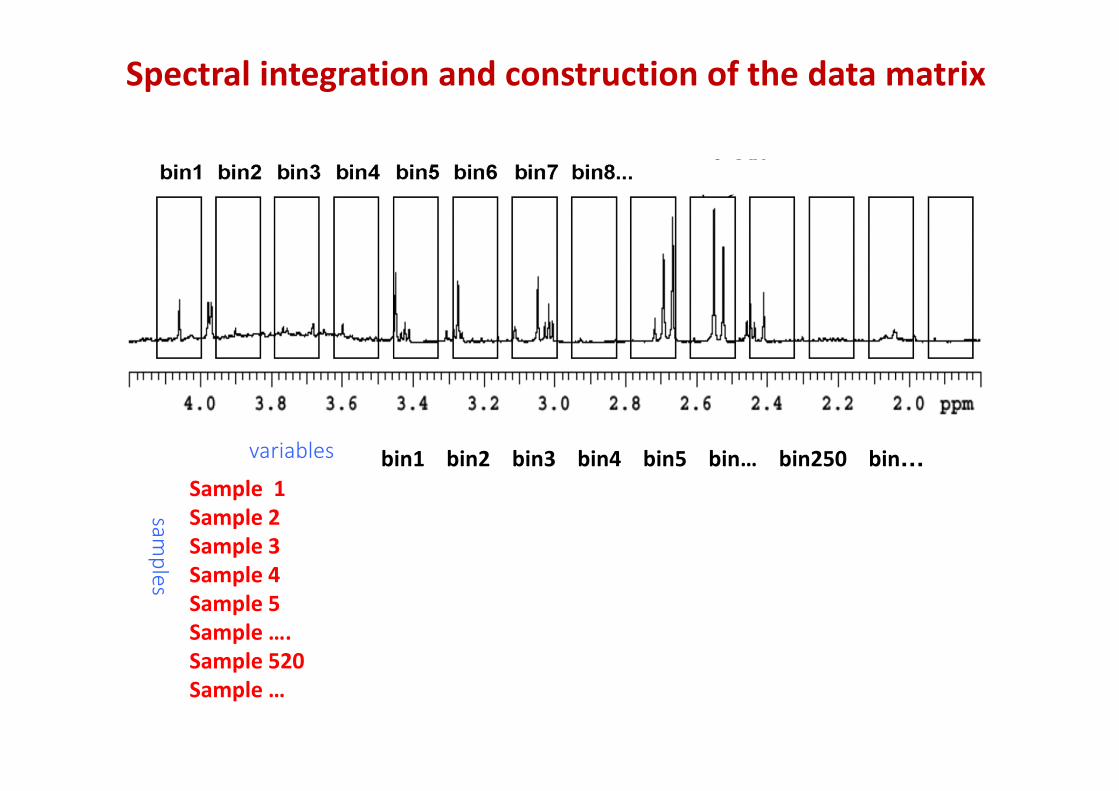
Spectral integration and construction of the data matrix
bin1 bin2 bin3 bin4 bin5 bin… bin250 bin…
Sample 1
Sample 2
Sample 3
Sample 4
Sample 5
Sample ….
Sample 520
Sample …
variables
samples
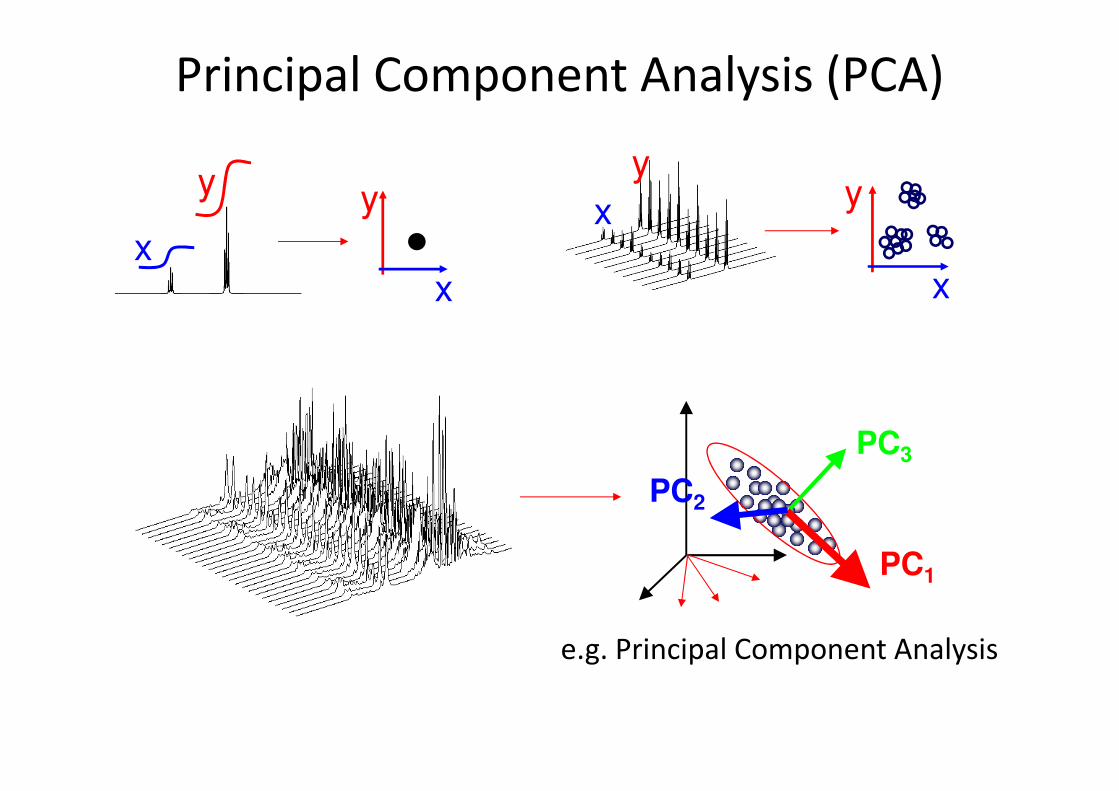
Principal Component Analysis (PCA)
x
y
x
yx
y
x
y
PC3
PC2
PC1
e.g. Principal Component Analysis
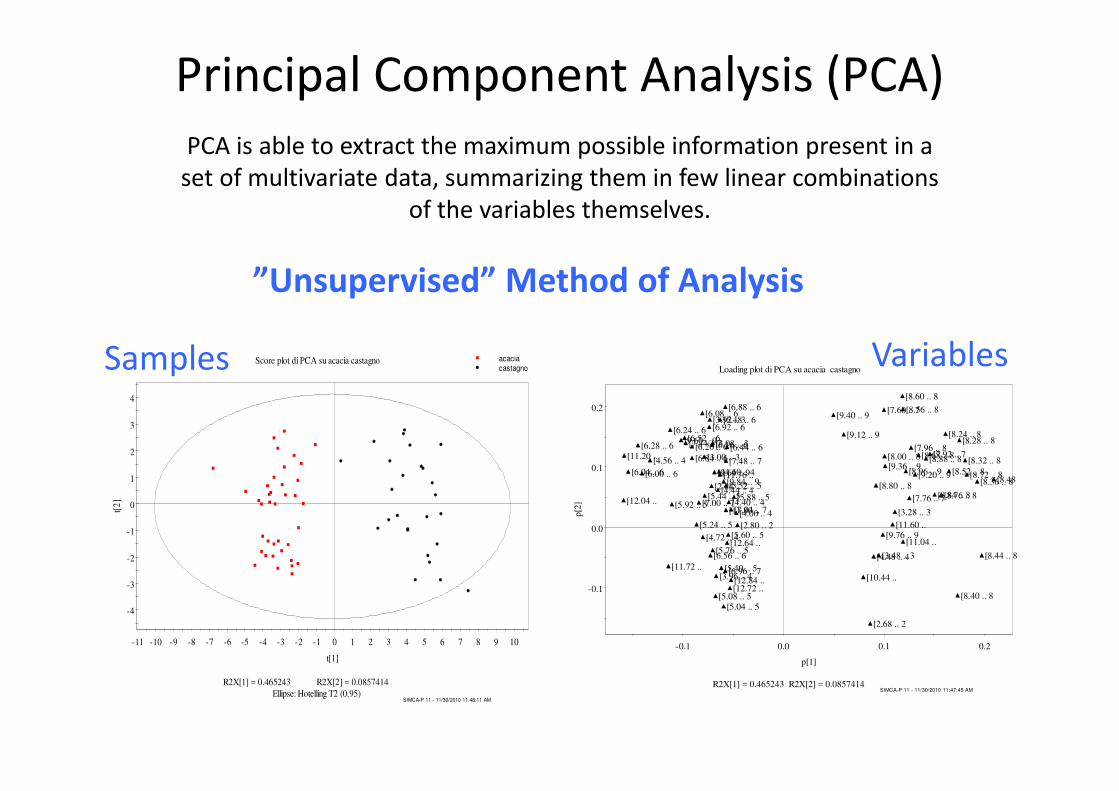
-0.1
0.0
0.1
0.2
-0.1 0.0 0.1 0.2
p[2
]
p[1]
Loading plot di PCA su acacia castagno
R2X[1] = 0.465243 R2X[2] = 0.0857414
[2.68 .. 2
[2.80 .. 2
[2.84 .. 2
[3.00 .. 3
[3.08 .. 3
[3.28 .. 3
[3.48 .. 3
[3.92 .. 3
[3.96 .. 4
[4.00 .. 4
[4.40 .. 4
[4.44 .. 4
[4.48 .. 4
[4.56 .. 4
[4.60 .. 4
[4.72 .. 4
[5.04 .. 5[5.08 .. 5
[5.24 .. 5
[5.40 .. 5
[5.44 .. 5[5.52 .. 5
[5.60 .. 5
[5.76 .. 5
[5.88 .. 5[5.92 .. 5
[6.00 .. 6[6.04 .. 6
[6.08 .. 6
[6.16 .. 6[6.20 .. 6
[6.24 .. 6
[6.28 .. 6 [6.44 .. 6
[6.48 .. 6
[6.52 .. 6
[6.56 .. 6
[6.84 .. 6
[6.88 .. 6
[6.92 .. 6
[6.96 .. 7
[7.00 .. 7[7.04 .. 7
[7.44 .. 7
[7.48 .. 7
[7.60 .. 7
[7.76 .. 7
[7.92 .. 7[7.96 .. 8
[8.00 .. 8
[8.24 .. 8[8.28 .. 8
[8.32 .. 8
[8.36 .. 8
[8.40 .. 8
[8.44 .. 8
[8.48 .. 8[8.52 .. 8
[8.56 .. 8
[8.60 .. 8
[8.68 .. 8
[8.72 .. 8
[8.76 .. 8[8.80 .. 8
[8.84 .. 8
[8.88 .. 8
[8.96 .. 9
[9.12 .. 9
[9.20 .. 9[9.36 .. 9
[9.40 .. 9
[9.60 .. 9
[9.64 .. 9
[9.76 .. 9
[9.84 .. 9
[10.44 ..
[11.04 ..
[11.20 ..
[11.60 ..
[11.72 ..
[11.76 ..
[11.80 .. [12.04 ..
[12.64 ..
[12.72 .. [12.84 ..
SIMCA-P 11 - 11/30/2010 11:47:45 AM
-4
-3
-2
-1
0
1
2
3
4
-11 -10 -9 -8 -7 -6 -5 -4 -3 -2 -1 0 1 2 3 4 5 6 7 8 9 10
t[2
]
t[1]
Score plot di PCA su acacia castagno
R2X[1] = 0.465243 R2X[2] = 0.0857414
Ellipse: Hotelling T2 (0.95)
acacia
castagno
SIMCA-P 11 - 11/30/2010 11:48:11 AM
Samples Variables
PCA is able to extract the maximum possible information present in a
set of multivariate data, summarizing them in few linear combinations
of the variables themselves.
”Unsupervised” Method of Analysis
Principal Component Analysis (PCA)
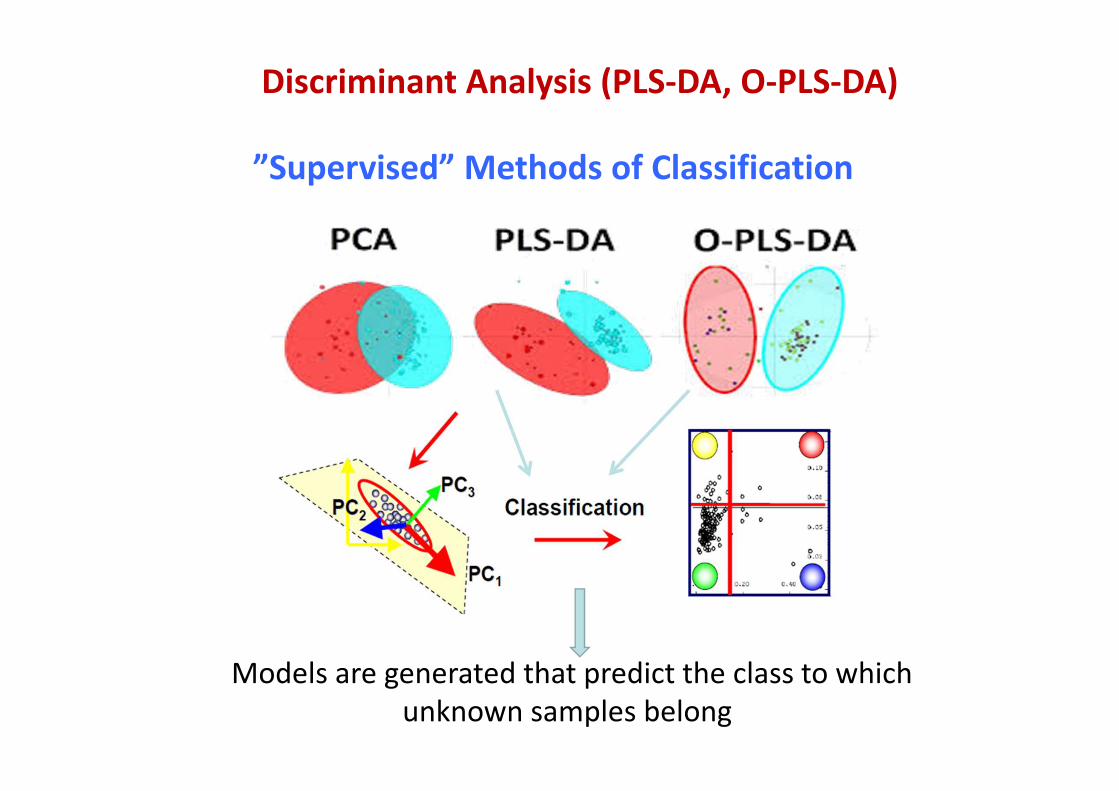
Discriminant Analysis (PLS-DA, O-PLS-DA)
Models are generated that predict the class to which
unknown samples belong
”Supervised” Methods of Classification

11 10 9 8 7 6 5 4 3 2 ppm
8.59.09.5 ppm
4.64.74.84.9 ppm
0.70.80.9 ppm
Spettro 1H NMR
(componenti minoritari)
Garda
Veneto
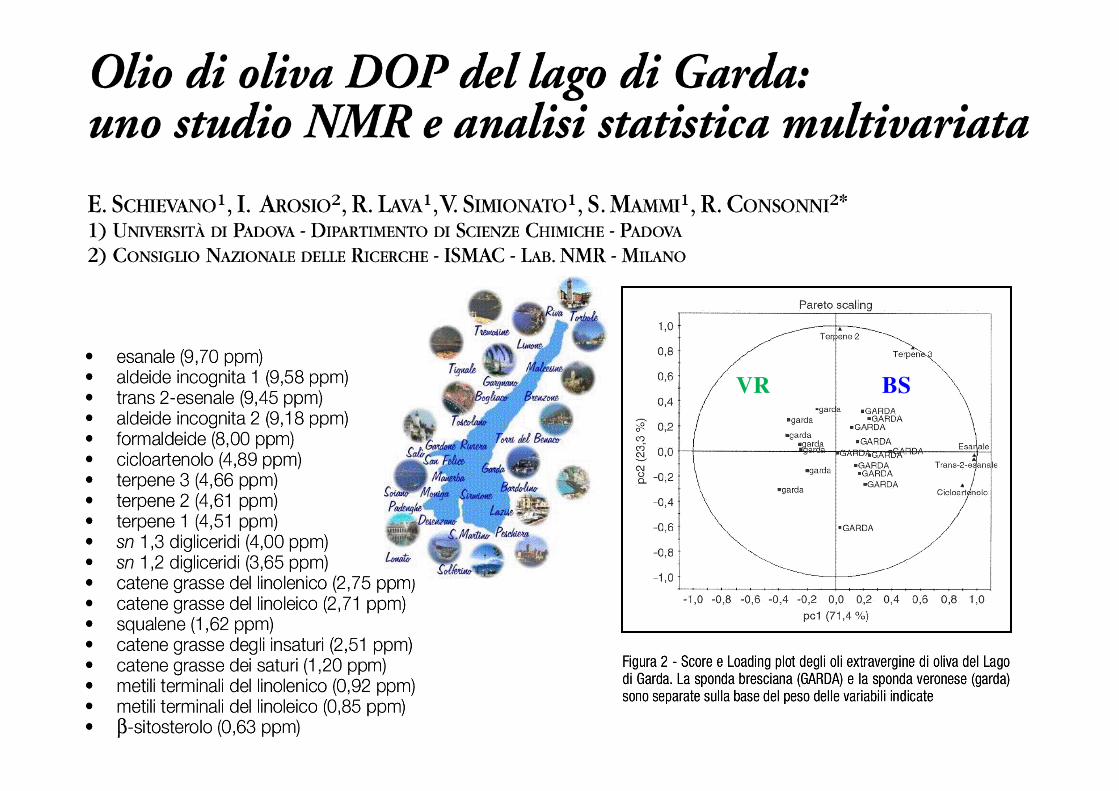
VR BS
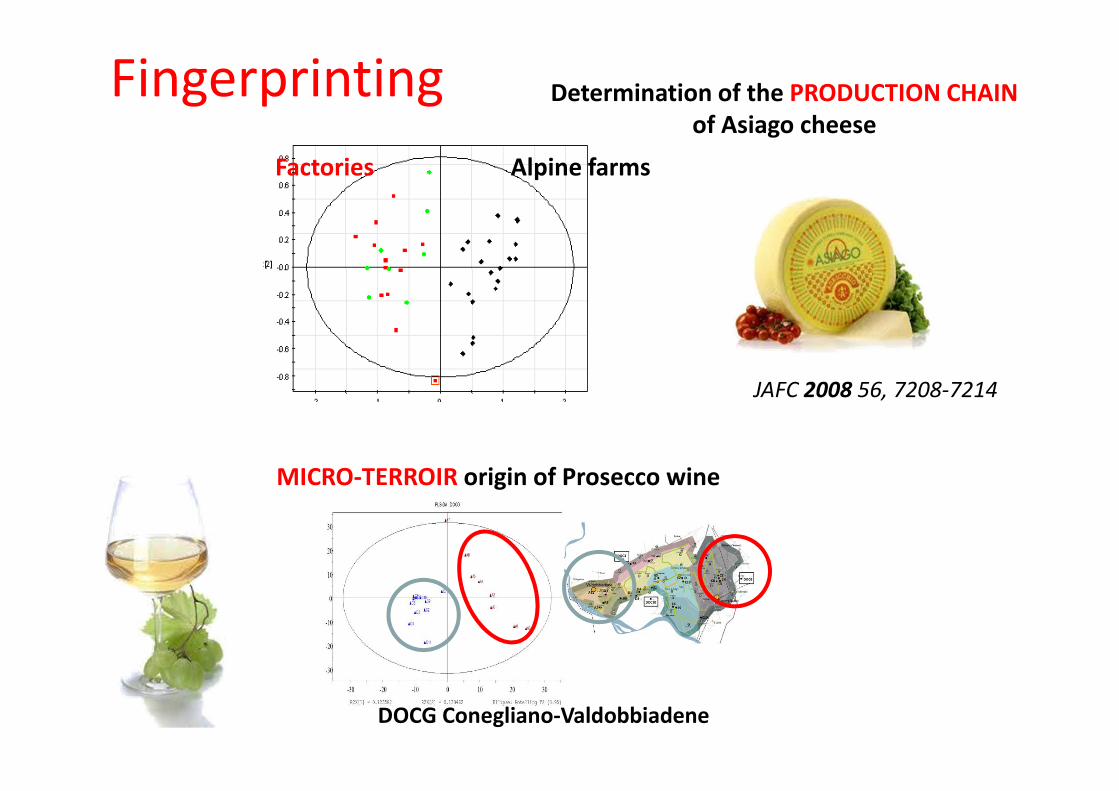
Fingerprinting
DOCG Conegliano-Valdobbiadene
MICRO-TERROIR origin of Prosecco wine
Alpine farmsFactories
Determination of the PRODUCTION CHAIN
of Asiago cheese
JAFC 2008 56, 7208-7214

Authentication of the botanical origin of honey
JAFC 2016, 64, 3645–3652

Fast
motion
Intermediate
motion
Slow
motion
CSF
White MatterGray Matter
Magnetic Resonance Imaging
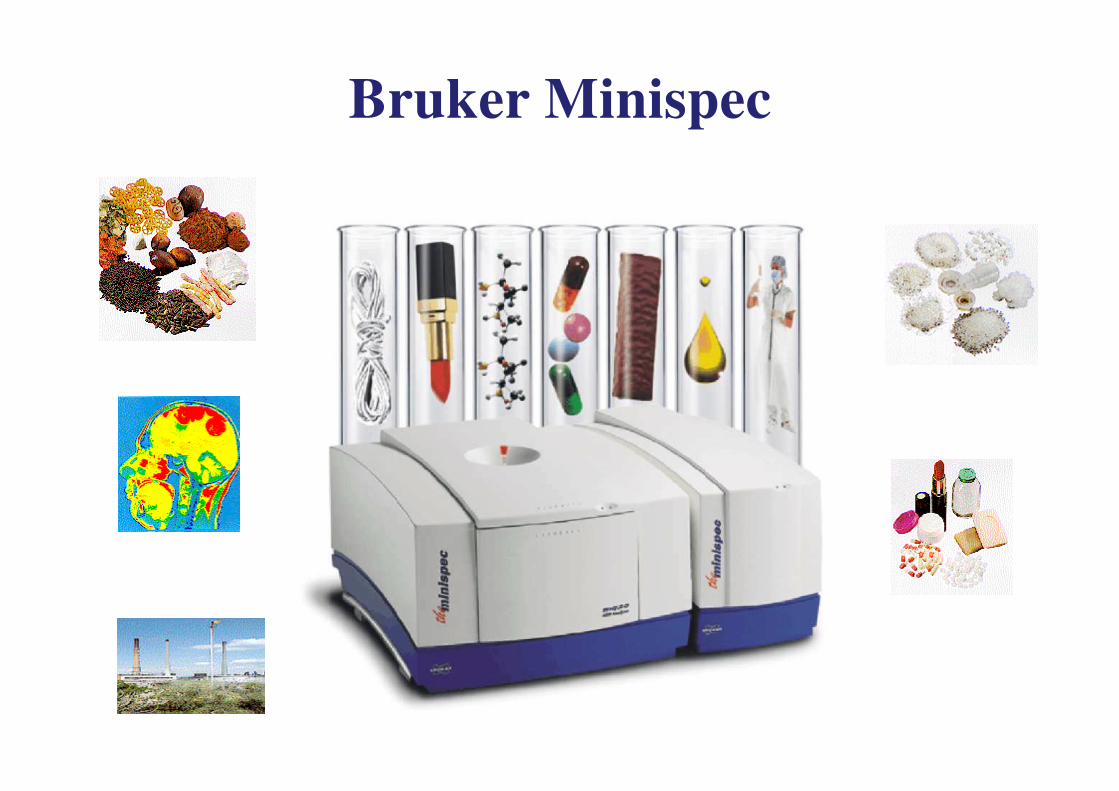
Bruker Minispec
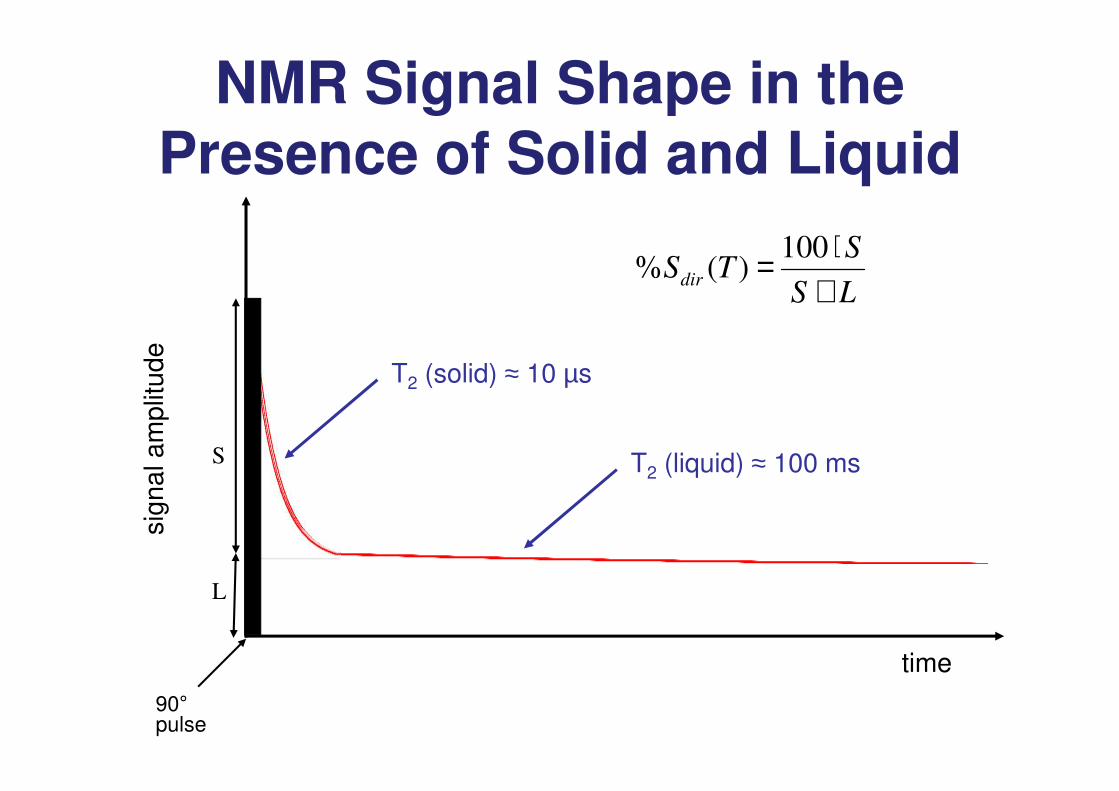
NMR Signal Shape in the Presence of Solid and Liquid
time
sig
na
l a
mp
litu
de
90°pulse
T2 (solid) ≈ 10 µs
T2 (liquid) ≈ 100 ms
LS
STS
dir +⋅= 100
)(%
S
L

Standard QC/QA Methods
AOCS Cd 16b-93 American Oil Chemists' Society standard method for
Solid Fat Content (SFC) by pulsed NMR
IUPAC Norm 2.150 International Union of Pure and Applied Chemistry
standard method for Solid Fat Content (SFC) by pulsed
NMR
ISO DIS/10565 International Standards Organization standard method
for oil and moisture in oilseeds by pulsed NMR
AOCS Ak 4-95 American Oil Chemists' Society standard method for oil
and moisture in oilseeds by pulsed NMR
ISO CD 10632 - OILSEED RESIDUES - Simultaneous Determination of
Oil and Water Contents - Method using pulsed NMR
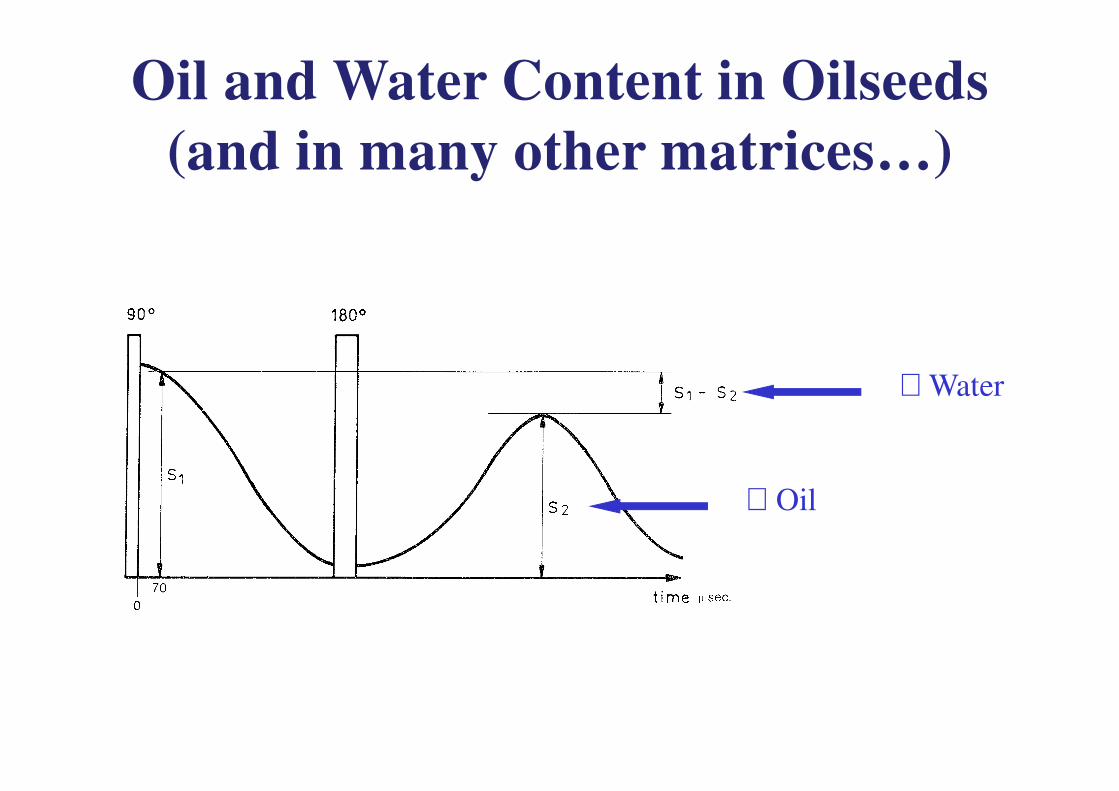
Oil and Water Content in Oilseeds
(and in many other matrices…)
∝ Water
∝ Oil
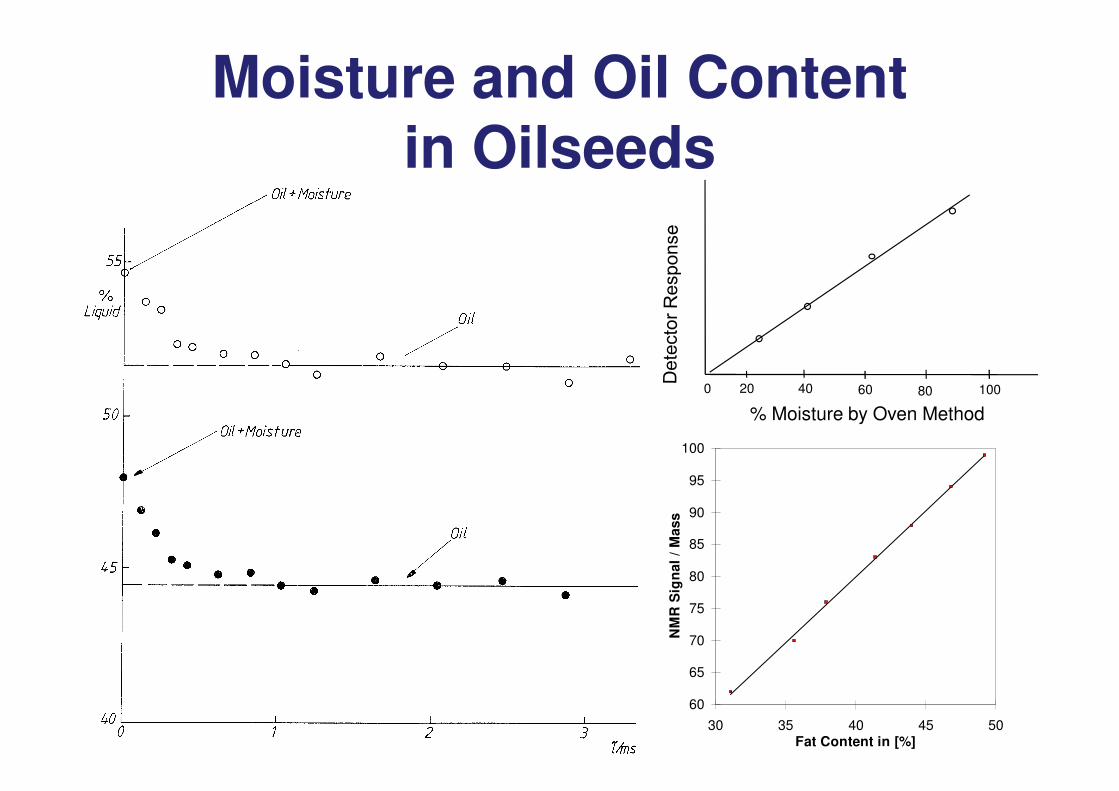
Moisture and Oil Content in Oilseeds
60
65
70
75
80
85
90
95
100
30 35 40 45 50Fat Content in [%]
NM
R S
ign
al
/ M
ass
20 40 60 80 1000
% Moisture by Oven Method
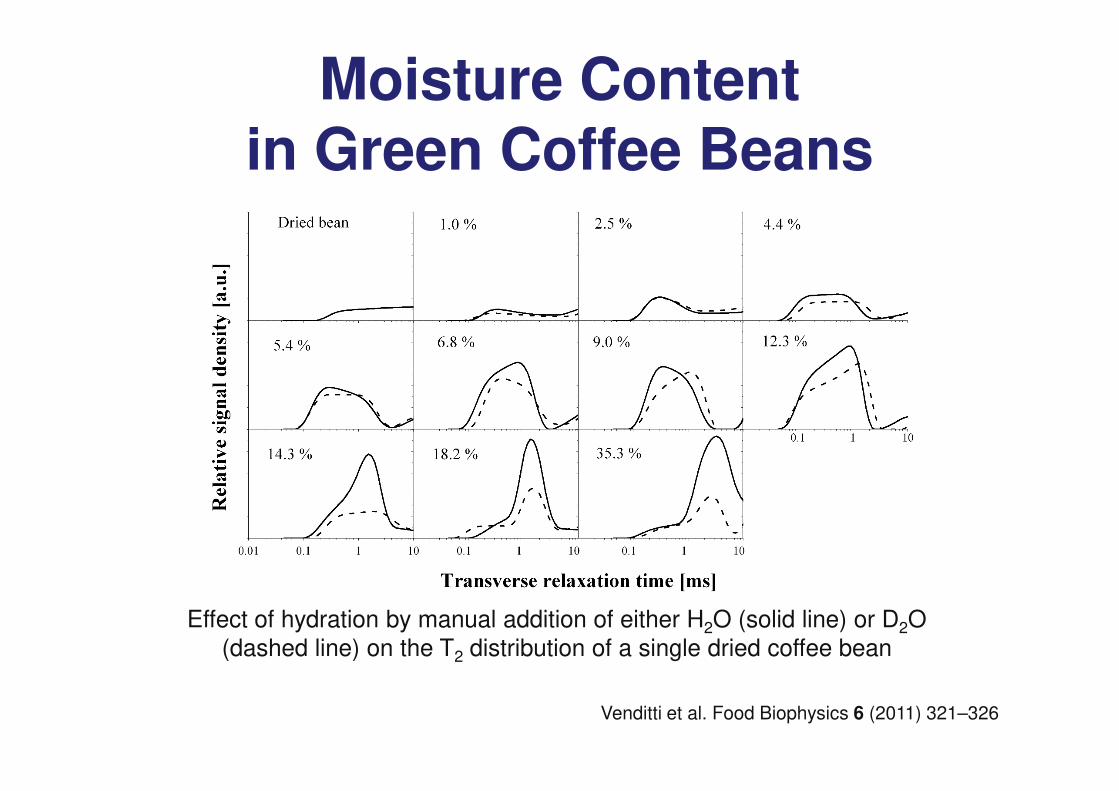
Moisture Content in Green Coffee Beans
Effect of hydration by manual addition of either H2O (solid line) or D2O (dashed line) on the T2 distribution of a single dried coffee bean
Venditti et al. Food Biophysics 6 (2011) 321–326

The Bruker ProFiler
Console NMR
preamplificatore
magneterisuonatori
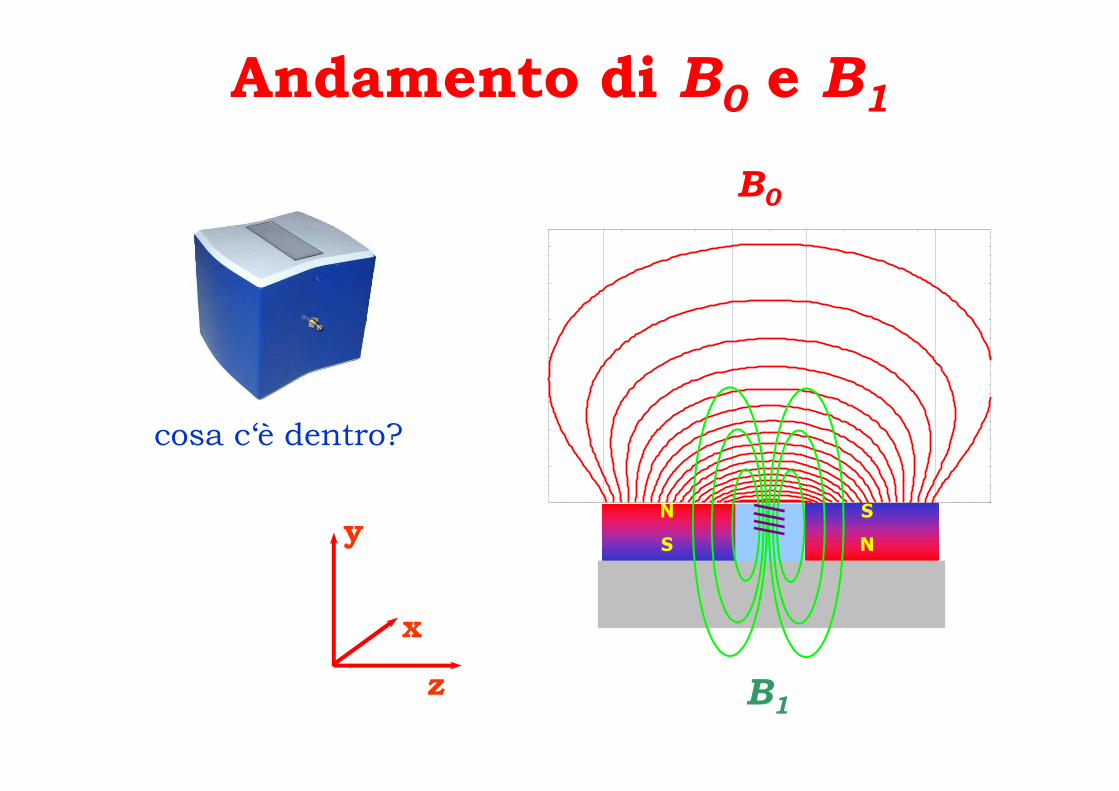
Andamento di B0
e B1
y
z
x
cosa c‘è dentro?
- 40 - 20 0 20 40 60
20
40
60
80
100
120
140
N
S
S
N
B0
B1
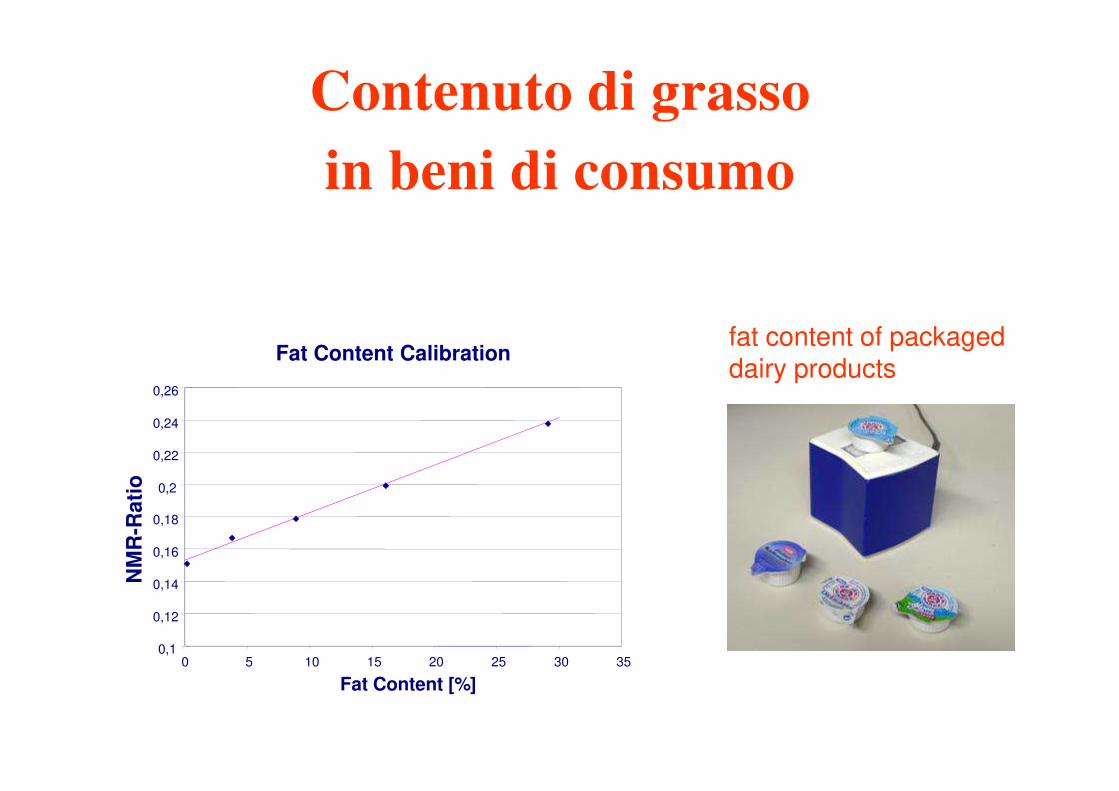
Contenuto di grasso
in beni di consumo
fat content of packaged dairy products
Fat Content Calibration
0,1
0,12
0,14
0,16
0,18
0,2
0,22
0,24
0,26
0 5 10 15 20 25 30 35
Fat Content [%]
NM
R-R
ati
o


Elisabetta Schievano
Roberto Lava
Veronica Simionato
Luca AldegheriKatia Guardini
Giampaolo Venditti
Elisa MorelatoChiara Facchin
Ivan Mazzaretto
Emmanuel Ndoum
Cristina MelerClaudia Finotello
Jalal Uddin
Federico Rastrelli
Alessandro BagnoGabriella FavaroFranco Magno
Gabriella PasiniGiulio Cozzi
Gregorio Peron
Stefano Dall’Acqua
Luisa Mannina
Roberto Ferrarini
Michele D’Ambrosio
Roberto Consonni
Luciano Navarini
Matteo Stocchero
Lucia Piana
Uni-PD
Uni-Roma1
Uni-VR
Uni-TN
CNR-MI
s.r.l. BO
Thank you for
your attention!!


