Sede Amministrativa: Università degli Studi di Padova Dipartimento di Biologia ___________________________________________________________________ SCUOLA DI DOTTORATO DI RICERCA IN: Bioscienze e Biotecnologie INDIRIZZO: Biologia Cellulare CICLO XXVIII PROFILING THE MOLECULAR MECHANISMS DRIVING THE FATE OF HUMAN B CELLS IN RESPONSE TO VACCINATION Direttore della Scuola: Ch.mo Prof. Paolo Bernardi Coordinatore d’indirizzo: Ch.mo Prof. Paolo Bernardi Supervisore: Ch.mo Prof. Cesare Montecucco Co-supervisore: Dr. Monia Bardelli Dottorando: Laura Bonoli
Transcript
Sede Amministrativa: Università degli Studi di Padova
expression of XBP1. However, although XBP1 appears to act downstream of BLIMP1 in
INTRODUCTION
| 21
the regulatory network [49], BLIMP1 is necessary, but not sufficient for XBP1 expression
[38]. Furthermore, BLIMP1 is not required for initiation of the PC differentiation
program as pre-plasmablasts form in the absence of BLIMP1 [50]. XBP1 acts
downstream of BLIMP1 and is a key regulator of PC development, but it is not absolutely
required for the formation of antibody-secreting cells [51]. Rather, XBP1 appears to act
predominantly to set up the cells to allow for the secretion of vast quantities of Ig [52],
inducing endoplasmic reticulum remodelling, activation of mechanistic target of
rapamycin (mTOR) [53] and autophagic pathways [54] and the induction of the unfolded
protein response [52]. Although much is known regarding the interconnections that
exist between the regulatory networks of these B cell lineage master regulators,
questions remain as to exactly what initiates each pathway. In addition, controversy still
surrounds the issue of PC longevity. Short-lived PCs play a critical role in the immune
response and undergo a ‘traditional’ differentiation program, exiting the cell cycle,
undergoing terminal differentiation followed by rapid cell death. However, while it is
clear that a long-lived PC population is maintained in the bone marrow [55], it is still not
clear how this population is maintained. Recent data suggest that active autophagy
might account for the longevity of these cells [56], protecting these cells from apoptosis,
possibly in combination with some degree of ongoing homeostatic proliferation [57].
IRF4 is a member of the IRF (interferon regulatory factor) superfamily of transcription
factors that shows relatively weak DNA binding on its own. Therefore, in order to exert
its diverse functions it binds DNA co-operatively with a host of other transcription
factors, including IRF8, PU.1 and Spi-B [58,59]. IRF4 plays an essential role in isotype-
switching, with IRF4-deficient mice failing to induce AID expression and undergo CSR
when stimulated in vitro [60,61]. IRF4 may regulate AID expression through co-operative
binding with BATF, a transcription factor essential for AID expression [62]. IRF4 is
induced rapidly upon BCR ligation [63,64] and is reported to be required for BCL6-
induction and entry into the GC reaction. However, it is not required for maintenance of
the GC [60]. In addition to establishing the GC reaction, IRF4-deficient mice also fail to
make mature PCs [60,61] and this defect is a result of failure to induce BLIMP1
expression [61]. However, it was also suggested that the failure to induce PC
differentiation is independent of BLIMP1 expression and instead is due to a loss in XBP1
expression [60]. The ability of IRF4 to initiate two distinct cell fate transitions, GC B cell
and PC differentiation, originates from its differing expression levels at these times. IRF4
is expressed at low levels in naive B cells but is up-regulated during PC differentiation
INTRODUCTION
22 |
[65]. It is thought that the strength of the BCR signaling, as determined by the affinity of
the BCR for antigen, determines the level of IRF4 induction. This, in turn, determines
whether the GC B cell program or the PC differentiation program is initiated: initially,
low concentrations of IRF4 activate AID and BCL6 expression. As the GC reaction
continues Ig affinity increases, leading to increased BCR signaling and elevated IRF4
expression, favoring BLIMP1 expression [63,66], BCL6 repression [67] and
extinguishment of the GC program. These divergent functions of IRF4 are mediated
through its ability to associate with different binding motifs. At lower concentrations,
IRF4 co-operates with PU.1 and BATF, facilitating binding to ETS-IRF or AP-1-IRF
composite motifs and coordinating the GC program. At high concentrations, resulting
from hypermutation-driven high-affinity BCR- antigen recognition, IRF4 favors binding to
interferon sequence response elements (ISREs), shifting the cells’ expression profile
towards the PC program [63].
IRF8 is another member of the IRF transcription factor superfamily, but unlike IRF4 is
expressed abundantly in centroblasts [68] and down-regulated in centrocytes [69]. IRF8
was proposed initially to regulate BCL6 and AID positively; IRF8 over-expression in
human B cells increased the abundance of BCL6 and AID transcripts, while siRNA-
mediated knock-down of IRF8 in a murine GC-derived B cell line had the opposite effect
[68]. However, more recently, IRF8-deficient mice have been shown to display only
minor reductions in AID and BCL6 expression and have a normal antibody response [70].
While the phenotype of IRF8-deficient B cells is relatively minor, knock-out of both IRF8
and its common binding partner PU.1 result in heightened PC differentiation and class-
switch recombination [65]. This mouse model showed that IRF8:PU.1 are together able
to help maintain the B cell program by promoting expression of PAX5 and BCL6 and
concurrently repressing BLIMP1.
Another critical component of the humoral immune response is cell death, which allows
autoimmunity prevention, drives affinity maturation and terminates the response once
the challenge has been met. Conversely, inhibition of apoptosis is essential for
immunological memory. Apoptosis induced by the loss of environmental signals such as
growth factor withdrawal or loss of BCR signaling is initiated by pro-apoptotic members
of the BCL2 family of proteins (including BIM, BAD, BIK and BAX), while it is prevented by
the anti-apoptotic BCL2 factors (BCL2, BCLXL and myeloid cell leukaemia 1 (MCL1)). Thus,
a B cell’s apoptotic potential is determined by the balance between pro-apoptotic and
anti-apoptotic signaling. Accordingly, B cells undergoing affinity maturation in the GC
INTRODUCTION
| 23
show low expression of a number of anti-apoptotic factors, such as BCL2, while express
pro-apoptotic factors such as FAS and BAX abundantly [71]. As such, GC B cells appear to
be destined to apoptosis unless rescued by BCR signaling. More recently, MCL1 has been
identified as the main anti-apoptotic regulator of GC B cells and MBCs [72]. Due to the
requirement for DNA recombination, mutation and rapid proliferation, B cells are prone
to lymphoma development at various stages of B cell ontogeny. Of these, a number are
derived from the GC stage, including follicular lymphoma, diffuse large B cell lymphoma,
Hodgkin’s lymphoma and Burkitt’s lymphoma. In many of these cases either
translocation of the BCL2 gene or up-regulation of one of the anti-apoptotic BCL2 family
members can be demonstrated and probably plays a role in the transformation process
[73].
It has become increasingly apparent that the different B cell expression programs are
controlled by a highly coordinated regulatory network. Within this network, multiple
points of positive and negative feedback ensure the mutually antagonistic expression of
the master regulators, augmented by an increasing number of secondary factors that
reinforce these networks and contribute towards sensing the progress of the GC
reaction. Initially, the B cell-specific expression pattern is established by PAX5, which not
only regulates the expression of proteins critical to B cell function but also drives the
expression of IRF4 (at a low level), IRF8 and BACH2. Together, these factors inhibit the
expression of the master regulators of PC differentiation, BLIMP1 and XBP1; PAX5
directly represses XBP1, while IRF8, in combination with PU.1, both maintains PAX5 and
inhibits BLIMP1. BLIMP1 is also suppressed actively by BACH2. Following activation of
the B cell via BCR engagement, BCL6 is activated by IRF4/PU.1. BCL6 controls not only
the establishment of the GC fate, initiating the diversification pathways and rapid
proliferation of the B cells, but also further represses BLIMP1. Although much has been
elucidated as to how these pathways repress B cell differentiation into PCs, it is less
clear how the path is set towards favoring terminal differentiation to PCs, essential for
the final success of the GC reaction. As SHM produces Igs of ever-increasing affinity, BCR
signal strength increases, in turn increasing IRF4 expression. Increased IRF4 expression
then starts to activate BLIMP1, which in turn represses BCL6 and PAX5. Once BLIMP1
accumulates, it represses multiple genes responsible for maintaining B cell identity,
including BCL6. This, in turn, allows the expression of genes responsible for PC identity,
driven in part by IRF4. Finally, suppression of PAX5 relieves repression of XBP1, allowing
establishment of the full secretory program. Although critical, the network described
INTRODUCTION
24 |
above appears not to be the whole story. The rapid proliferation of B cells is a necessary
part of the GC response, but it now seems likely that this process also plays an active
role in determining cell fate. It has been known for many years that a cell’s potential to
undergo CSR is determined (at least in part) by the number of divisions it has undergone
[74,75]. Later, it was shown that a B cell’s potential to undergo differentiation into an
antibody-secreting cell was also dependent upon division number [74]. Together, these
data suggest that B cells possess some form of division counting mechanism that
changes an individual cell potential to undergo cell division, apoptosis and
differentiation [30]. Further, recent studies suggest that individual naive B cells may
have a restricted potential with regard to the number and type of effector cells (PC,
MBCs and GC cells) into which their progeny can differentiate [76]. Clonal populations
that resisted apoptosis and divided more times were more likely to give rise to multiple
effector subsets. In addition, clones bearing higher-affinity antigen receptors underwent
higher levels of cell division and generated a greater ratio of PCs to MBCs than clones
bearing lower-affinity receptors [76]. Thus a combination of BCR signaling, cell division
and apoptosis appears to determine the response of an individual B cell following
antigen encounter. Much is now known about the molecular network regulating the GC
response and PC differentiation, both of which are controlled largely by the expression
of a small number of master regulators. However, for what concerns MBC, no
deterministic transcription factor has been found so far.
4.3. Generation of memory B cells
In T cell-dependent B cell responses, accumulating evidence shows that antigen-
activated proliferating B cells begin to follow one of three fates by differentiating into
extrafollicular short-lived PCs, GC-independent memory B cells or GC-dependent
memory B cells [77].
Affinity-dependent B cell selection occurs at the B cell–T cell border as a result of T cell
help, which could affect B cell fate decisions [78]. Among the various signals provided by
T cells, the CD40 signal alone can induce activated B cells to differentiate down the
memory pathway but not into GC cells [79]. In addition to the CD40 signal, cytokine
signaling is probably required for germinal center B cell differentiation. Indeed,
interleukin-21 (IL-21) was shown to upregulate the expression of B cell lymphoma 6
(BCL-6) in B cells, which is a crucial transcription factor for germinal center formation
and maintenance [80,81]. Hence the formation of durable Tfh cell–B cell conjugates to
provide adequate T cell help could enable B cells to differentiate into GC B cells.
INTRODUCTION
| 25
However, if the duration of conjugate formation is fairly short, B cells are more likely to
join the GC-independent MBC pool. Given that class switching but not somatic
hypermutation occurs during this early period, BCR specificities of the GC-independent
MBCs are likely to reflect those of the initial responding B cells. Therefore, the GC-
independent MBCs may enable the host to maintain a broad range of antigen-specific B
cells possibly providing protection against pathogens that bear related but distinct
antigens and epitopes.
As reported above, for what concerns GC-dependent MBC the precise mechanism of
formation is still unclear. One hypothesis is that there is a master regulator of
transcription that directs the cells towards a memory B cell fate, but so far no single
deterministic transcription factor for MBCs has been elucidated. An alternative idea is
that MBCs differentiate stochastically from GC B cells and that a survival advantage is
sufficient for MBC differentiation [82].
It was previously assumed that MBCs are only formed during T cell-dependent immune
responses and therefore that conventional B2 cells are the exclusive participants in MBC
generation. However, recent data show that B1 cells can also generate MBCs during T
cell-independent immune responses [83,84]. B1 cells are the most abundant B cells in
the peritoneal cavity but they are also present at a low but detectable frequency in the
spleen [85]. Although T cell-independent MBCs can be generated, it seems that their
recall response is quantitative, rather than qualitative. Thus it is unclear whether T cell-
independent MBCs have an intrinsic advantage compared with their naive B cell
counterparts to respond more rapidly and more robustly to the antigen.
4.4. Heterogeneity of memory B cells
During the primary immune response, several types of MBCs are generated, suggesting
the idea that these have distinct functions [86]. Two decades ago, it was hypothesized
that there are two distinct types of MBCs (IgM+ and IgG+ cells) which are activated and
function in a distinct manner during reinfection [87]. Two groups have recently
addressed this question and they have reached a similar conclusion that upon antigen
re-challenge, IgG+ MBCs preferentially differentiate into PB, whereas IgM+ MBCs
proliferate more and enter the GC reaction [88,89]. However, it seems that there is
functional heterogeneity even within the IgM+ or IgG+ MBC pools, and it cannot be
excluded that IgG+ MBCs can re-enter germinal centers or that IgM+ MBCs might produce
a PB response. A more recent study has proposed that other markers (CD80 and
programmed cell death 1 ligand 2 (PDL2)) are more functionally relevant to MBC subsets;
INTRODUCTION
26 |
CD80− PDL2− MBCs enter the GC reaction, whereas CD80+ PDL2+ MBCs promptly
differentiate into PBs upon restimulation [90]. The above-mentioned studies mainly
used MBCs expressing IgG1 or expressing mixtures of IgG1, IgG2a and IgG2b. However, a
recent study shows the need to functionally characterize each isotype of MBC [91].
Transcription factors that are induced in B cells by cytokines are important for regulating
subsequent B cell behaviour in the primary response; for example, interferon-γ (IFNγ)-
induced T-bet (also known as TBX21) expression is known to be important for IgG2a
class switching. Interestingly, such transcription factors are also important for the
survival of immunoglobulin class-specific MBC [91]. Expression of T-bet or retinoic acid
receptor-related orphan receptor-α (RORα) in IgG2a+ or IgA+ MBCs, respectively, is
higher than in naive B cells, and these transcription factors are crucial for memory cell
survival, probably by controlling the transcription of genes that encode cell-surface BCR
components [91]. As each subclass of immunoglobulin has unique biological activities as
a result of its Fc portion, targeting particular transcription factors for developing
antibody isotype- skewing vaccines could be an important strategy for
immunotherapeutic applications. In summary, these recent studies of MBCs expressing
IgM, IgG2a and IgA have shown that the origin, the function and the longevity of MBCs
could differ between cells expressing different antibody isotypes. Therefore, questions
arise about how such heterogeneity is induced and whether different types of MBCs are
coordinately activated upon secondary infection.
4.5. Peculiar characteristics of memory B cells
Key functional features of MBCs are their longevity and their rapid and robust responses
to antigen re-exposure, which are the basis of vaccine success. Haematopoiesis is a well-
known example of a biological system with long-term functions. In this system, the long-
term maintenance of homeostasis depends on the co-existence of somatic stem cells
and more committed progenitor cells [92]. The stem cells ensure the efficient
replacement of more committed cells, but at the same time maintain themselves
through a process of self-renewal. The more committed progenitor cells can be quickly
differentiated into more mature cells following exogenous stimulation. It was postulated
that such a stem cell-based mechanism might be similarly used by the humoral memory
system, which requires bi-functionality to efficiently make effector cells upon re-
encountering pathogens and simultaneously continue to maintain the responsive
memory state. As IgG+ MBCs seem to have a greater propensity to differentiate towards
PCs than IgM+ MBCs do, it could be suggested that the IgM+ MBC compartment contains
INTRODUCTION
| 27
more stem cell-like cells, whereas class-switched MBCs, such as IgG+ MBCs, correspond
to committed progenitor cells. This proposal requires further study but would be similar
to the situation for memory CD8+ T cells, for which substantial evidence of a stem cell-
based model has recently been provided [93].
To determine which types of cells and molecules are required for MBC survival, previous
studies have used IgG+ MBCs as a target. Those can persist in the absence of T cells or
input from precursor cells, but experiments in mice have suggested that there is a
requirement for FDCs for the maintenance of IgG+ MBCs [94]. In these mice, the primary
IgG response was unaffected, but the secondary antibody response was significantly
decreased. Notably, the impaired memory response corresponded with the reduced
frequency of antigen-specific MBCs. Inducible deletion of phospholipase Cγ2 (PLCγ2)
after the generation of IgG1+ MBCs substantially decreased the size of the memory
compartment, which suggests a requirement for BCR signaling for IgG1+ MBC survival
[95]. In terms of a requirement for antigen, genetic studies showed that cognate antigen
was not necessarily required after the generation of IgG+ MBCs, which implicates a
tonic-like BCR signal in the maintenance of IgG+ MBCs [96]. As a result, factors that
participate in expression of the BCR components (class-specific immunoglobulin heavy
and light chains, Igα and Igβ) and tonic BCR signaling molecules could be potential
determinants of memory B cell survival. The differential persistence of IgM+ and IgG+
MBCs was recently shown; Ag-specific IgM+ MBCs persisted for 500 days after priming,
whereas the number of IgG+ MBCs declined by many fold during this time period [89].
This could be explained by differences in the self-renewal activity of IgM+ and IgG+ MBCs
(as discussed above) and/or by the existence of differential B cell survival mechanisms.
Consistent with the existence of differential B cell survival mechanisms, blocking the
receptors for B cell-activating factor (BAFF; also known as TNFSF13B) and a proliferation-
inducing ligand (APRIL; also known as TNFSF13) did not affect the survival of IgG+ MBCs
in vivo but had a marked effect on naive IgM+ B cells [97]. Therefore, the differential
usage of BAFF and/or APRIL might be one cause of differential survival between IgM+
and IgG+ MBCs in mice, although this requires further clarification and may not apply to
human B cells. However, in humans, vaccinations and infections are known to elicit
stable populations of IgG+ MBCs [98]. Thus, it would be interesting to test the possibility
of heterogeneity between IgG1+ MBCs in terms of their self-renewal and their survival
ability. In T cell-dependent primary B cell responses, it is well known that the production
of high-affinity class-switched antibodies requires Tfh cells and FDCs. Thus, it is worth
INTRODUCTION
28 |
considering both B cell-intrinsic and B cell-extrinsic mechanisms to account for the
robust responsiveness of the memory compartment. MBCs rapidly differentiate into PBs
that produce class-switched antibodies that are capable of clearing the infection far
more quickly than naive B cells. To explain the rapid response of IgG1+ MBCs compared
with IgM+ naive B cells, two non-mutually exclusive models have been traditionally
assumed. In the first one, the unique IgG1 cytoplasmic domain structure of 28 highly
conserved amino acid residues (compared with the IgM cytoplasmic tail, which consists
of three amino acids) is thought to be the primary factor accounting for differences in
responsiveness, while in the second model, other changes such as alterations in
transcription factor levels that take place during priming are thought to explain the
differences. In support of the first model, several in vitro biochemical studies have
shown differential signaling activity of IgM and IgG1 BCRs. To assess the contribution of
the two models, a mouse IgG+ ‘naive’ B cell line was recently established by nuclear
transfer from an IgG1+ MBC, thus enabling for the first time a direct comparative
analysis of naive-type IgG1+ B cells and antigen-experienced memory-type IgG1+ B cells.
Antigen-experienced, but not naive, IgG1+ B cells rapidly differentiated into PCs, which
indicates that stimulation history (a BCR-extrinsic factor) is important in determining the
response [99]. Furthermore, the transcription factor BTB and CNC homologue 2 (BACH2),
which is known to repress differentiation towards PCs, was expressed at a lower level in
IgG1+ MBCs than in IgG1+ naive B cells, thus favoring the differentiation of IgG1+ MBCs to
PCs over germinal center entry. Due to data showing that before the induction of
BLIMP1 expression (and so PC differentiation) there are several intermediate states
between activated B cells and PCs, we propose that IgG1+ MBCs could be into such an
intermediate state by the downregulation of BACH2 [50]. Given that the BACH2 level of
IgM+ MBCs was more similar to that of naive B cells, IgM+ MBCs are probably also more
similar to naive B cells in terms of their differentiation state and their ability to enter the
germinal center pathway. These data shows the importance of stimulation history for
the robust responsiveness of IgG+ MBCs, but it does not exclude a role for the IgG1
cytoplasmic domain.
4.6. B cell receptor formation and maturation
B cells recognize and respond to foreign antigens through specialized polymorphic
membrane receptors: the B cell receptor (BCR). Diversification of the antibody
repertoire is essential for the normal operation of the human adaptive immune system.
Three molecular mechanisms contribute to the diversity of the immune repertoire of B
INTRODUCTION
| 29
cells: V(D)J recombination, class-switch recombination (CSR) and somatic hypermutation
(SHM). These three mechanisms involve DNA damage, modification and the cellular
DNA-repair machinery. The chromosomal organization of the genes that encode for the
BCR is highly conserved between the receptor-chain loci, as well as between species
(Chart 5).
The variable antigen-recognition domains of these receptors are encoded by many
scattered gene segments of three types (variable (V), diversity (D) and joining (J)) which
are somatically rearranged, in appropriate cell lineages, before their expression [100]. So,
V(D)J recombination generates the diversity of B-cell primary immune repertoires [101–
Chart 5: Chromosomal organization and recombination of the human immunoglobulin heavy chain locus and schematic structure of immunoglobulins [108,162].
INTRODUCTION
30 |
103]. During the initial phase of V(D)J recombination, the lymphoid-specific
recombinase-activating gene 1 (RAG1)/RAG2 factors, together with ubiquitous DNA
architectural proteins (high mobility group, HMG, proteins), recognize and bind to
recombination signal sequences (RSSs) that flank all variable (V) and joining (J) segments
and introduce a DNA double-strand break at the border of the RSS. On the chromosome,
coding ends are left as hairpin-sealed structures, whereas signal ends, which are excised
from the chromosome, are blunt and 5' phosphorylated. The subsequent steps are taken
care of by the DNA-repair machinery of the non-homologous end-joining (NHEJ)
apparatus[104]. The DNA-double-strand break is first identified by the DNA-dependent
protein kinase (DNA-PK) complex (formed by the Ku70–Ku80 heterodimer and the DNA-
PK catalytic subunit, DNA-PKcs). Before re-ligation, the hairpins at the coding ends are
first opened, presumably by the Artemis–DNA-PKcs complex. The XRCC4–DNA-ligase IV
complex carries out the ligation step. The terminal deoxynucleotidyl transferase (TDT)
further increases the diversity of the coding joint by adding non-templated nucleotides
(N).
In the case of B cells, two additional mechanisms, which are triggered after antigen
recognition, further optimize the antibody response [105]. Class-switch recombination
(CSR) allows a previously rearranged IgH variable domain to be expressed in association
with a different constant (C) region, leading to the production of different isotypes (IgG,
IgA or IgE) (which mediate antigen elimination by different routes) without changing
antibody specificity. The variable domains of immunoglobulins can also increase their
affinity for antigen through the accumulation of somatic hypermutations (SHMs) within
Chart 6: Molecular mechanisms involved in VDJ recombination [162] .
INTRODUCTION
| 31
the V gene segment. These two B-cell specific antibody-maturation processes take place
after antigenic stimulation, in the germinal centers of peripheral lymphoid organs,
whereas V(D)J recombination occurs in the bone marrow (Chart 6). CSR involves
recombination between two different switch (S) regions that are located upstream from
each C region of IgH, with deletion of the intervening DNA. Replacement of the Cµ
region by a C region of another class of immunoglobulin (Cγ1–4, Cα1–2 or Cε) results in
the production of different isotypes (IgG1–4, IgA1–2 or IgE) with the same V region, and
therefore, the same specificity and affinity for the antigen. The nature of the produced
isotype determines its activity (half-life, ability to bind Fc receptors or to activate
complement) and the location to which it is delivered (such as IgA in the mucosa) [106].
SHM introduces mutations in the V region and its flanking regions with high frequency.
These mutations, which are essentially missense mutations and more rarely deletions or
insertions, occur in the complementarity-determining regions (CDRs) and target
specifically the Arg-Gly-Tyr-Trp motifs. Normally, SHM is eventually followed by the
positive selection of B cells that express a BCR with high affinity for antigen, whereas B
cells that express a BCR with low affinity are deleted by apoptosis or recirculating in the
GC to undergo further rounds of modification. This selection process occurs in close
contact with follicular dendritic cells [107].
The rapidly emerging technology of B cell receptor BCR sequencing enables
determination of the antibody repertoire [108]. BCR repertoire analysis can enhance our
understanding of the effect of pathogen exposure and immune status on antibody
repertoire, and facilitate identification of new vaccine targets. For example, BCR
sequencing of circulating B cells in various human populations showed that both age and
chronic viral infection altered the B cell repertoire [109]. Also, immunoglobulin
sequencing of B cells isolated from recently immunized individuals identified vaccine-
specific BCR sequences [110,111].
4.7. Gene expression studies and combination with BCR repertoire analysis
Gene expression profiling studies are traditionally performed using whole-transcriptome
microarrays or RNA sequencing. For the past decade, microarrays capable of
simultaneously measuring the expression of large numbers of genes in specific cell
populations have been considered the gold standard for transcriptomic analyses. More
recently, next-generation sequencing approaches that allow for rapid genome-wide
sequencing have gained popularity.
INTRODUCTION
32 |
Typically, transcriptomic studies are performed on whole blood or isolated cell
populations, and differentially expressed genes are compared during the course of
infection or vaccination to highlight key mechanisms involved in protection [112–115].
Among those, Querec et al studied the immune mechanisms driving protection for the
yellow fever vaccine YF-17D and identified transcriptomic signatures in PBMC from
vaccinated individuals that could predict the magnitude of the CD8+ T cell immune
response [113]. Another study showed that the immunogenicity of the inactivated
trivalent seasonal influenza vaccine could be predicted by a gene signature in PBMCs
[112]. These examples all utilized redundant transcriptomic analysis, where the full
transcriptome was analyzed. This approach remains expensive, requires a further
validation step for genes of interest (traditionally RT-qPCR), and requires a relatively
large amount of starting material, which is problematic for rare cell populations. Also,
for some applications, a targeted panel of genes rather than the complete transcriptome
is sufficient to address a given question. Hence, there has been a growing interest in the
development and application of high-throughput multiplex gene expression systems,
such as the Fluidigm systems, which focus on a specific panel of target genes. Recent
technological advances in the field of transcriptomics, such as those described above,
can also be applied to single cell gene profiling [116] . Gene expression studies at the
single cell level have thus far highlighted the fact that individual cells from an apparently
homogenous population (such as effector or memory cells) can display high
heterogeneity at the mRNA level [117]. For example, using the multiplex high-
throughput RT-qPCR Fluidigm system for single cell gene expression profiling, Arsenio et
al revealed new insights into the fate of CD8+ T cells effector and memory subsets
during bacterial infection that were masked when the analysis was performed on pooled
cells [118].
Considering what has been described so far in this introduction, it is clear that each step
of B cell maturation is the result of a complex interplay between transcriptional
regulation and BCR signaling. Thus it is becoming increasingly important to characterize
B cells at both levels simultaneously, in order to get the most information possible from
each sample, especially for rare human B cell populations. This is possible by combining
gene expression studies with Ig repertoire analysis. As reported above, recent
technology advancement allows performing this kind of analysis even at single cell level.
Combination of gene expression and Ig repertoire analysis at single cell level could be
used to further investigate MBC heterogeneity. Indeed Ig repertoire studies allow for
INTRODUCTION
| 33
the identification of Ig clonal expansion elicited by vaccination. Different MBC clonal
families being at different maturation stages (in terms of accumulated BCR modifications
and affinity for the antigen) could be characterized by a peculiar gene expression
signature. The identification of such signature may become a biomarker for mature MBC
subsets and be used to follow them during a vaccination response. A first attempt of
gene expression analysis/BCR sequencing combination was performed by Weinstein et
al, where single Ag-specific and Ag-nonspecific mouse B cells were used for gene
expression profiling and BCR sequencing, finding correlations between the two[119]. A
broader study is the one by McHeyzer-Williams et al, where they performed a deep and
accurate analysis of murine GC dynamics during recall responses at single cell level[120].
Most of the studies investigating gene expression profiling and B cell function were
initially performed in murine models and generally there is good correspondence with
humans. However this is not always the case, and human lymphocyte biology cannot
always be easily extrapolated from animals studies [121]. Gaining this kind of
information in humans is fundamental to better understand humoral B cell immunity,
but it is also crucial knowledge for next-generation vaccine design. Knowing what
determines the formation of particular MBC responses (different Ig isotype and thus
different effector functions) could drive the definition of new adjuvants strategies that
help in eliciting the appropriate immune response to the pathogen of interest or to
address specific age-related response impairments. For instance, this is the case of Tbet
and Rorα that, as mentioned earlier, were indicated as responsible of specific Ig class
expression in MBC, being potential targets for isotype-skewing vaccines. Combination of
gene expression and Ig repertoire analysis could be used to further investigate MBC
heterogeneity. Ig repertoire studies allow identification of clonal expansion elicited by
vaccination. Moreover the identification of biomarkers characterizing specific B cell
populations could be used to identify such populations when assessing the vaccine
efficacy in clinical trials. In addition this could lead to the detection of new B cell subsets
with possible vaccine efficacy predictive potential.
INTRODUCTION
34 |
5. OBJECTIVE
OBJECTIVE
| 37
A successful vaccine-induced humoral immune response relies on long lasting protective
antibodies with appropriate isotype and high affinity for the immunizing antigen. To
achieve this, antigen-activated B cells enter a process of BCR maturation and isotype
switch selection that results in the production of short-lived antibody-secreting
plasmablasts and long-term survival memory B cells. These outcomes are achieved
within transient structures called germinal centers, residing in the follicles of secondary
lymphoid organs. The molecular mechanism driving the fate of a human B cell to
differentiate into a plasmablast or a memory B cell is poorly understood and many
questions about memory B cells development remain unanswered, especially in humans.
The goal of this study is to further characterize the molecular dynamics of late human B
cell differentiation in response to vaccination, with a particular focus on memory B cells.
We want to address this questions performing gene expression profiling at single cell
level, thus investigating true population heterogeneity. Besides, comparing gene
expression patterns induced by vaccination with the profile of steady-state circulating
populations, we aim at identifying signatures of recent antigen stimulation. Additionally,
combining gene expression analysis with B cell receptor sequence analysis, we explore
possible correlations between expression signatures and BCR maturation, in order to
identify mature subpopulations of memory B cells. Ultimately this work aims to identify
putative biomarkers of efficacious B cell responses induced by vaccination.
OBJECTIVE
38 |
6. MATERIALS AND METHODS
MATERIALS AND METHODS
| 41
6.1. Human cells
Two anonymous healthy donors participating to the seasonal Influenza vaccination
campaign were selected for the study. Blood and plasma samples were collected at day
8 and day 21 after one dose of undisclosed influenza vaccine upon approval of the
informed consent. An additional sample from an anonymous healthy blood bank donor
was collected after written informed consent was provided and ethical approval granted.
All peripheral blood mononuclear cells (PBMCs) samples were isolated right after the
bleed and diluted 1:2 in HBSS. PBMCs were isolated by conventional centrifugation over
a Ficoll gradient and resuspended in PBS.
6.2. Antigen labelling
H1-California (Protein Sciences) and HSA (Sigma-Aldrich) were chemically labeled with
Alexa Fluor 647 succinimidyl ester (Molecular Probes, Invitrogen) following the
manufacturer's instructions. Each protein antigen was incubated with the dye at a molar
ratio of 1:10 for 1 hour at room temperature and then loaded into a Zeba desalting spin
column (Thermo Scientific) to remove the unbound dye. The degree of labeling was
determined by measuring the absorbance of conjugated protein at the relevant
wavelength for each fluorochrome by spectrophotometry. Protein concentrations were
calculated with the Bradford Protein Assay (Giotto Biotech).
6.3. Flow cytometry analysis and sorting
Fresh PBMCs were divided in tubes containing approximately 7x10⁶ cells. First they were
stained with 100µl of 1:500 Live/Dead Aqua (Invitrogen) for 20min in the dark and
washed with PBS. Then 50 µl of PBS containing 20% rabbit serum were added for further
20 min at 4°C to saturate Fc receptors. After washing with PBS, PBMCs were stained
with 50µl of a pre-titrated monoclonal antibodies mix diluted in PBS-1%FBS for 1h at 4°C
in the dark. PBMCs from day8 after vaccination were stained with anti-CD19 APC (Clone
SJ25C1, Becton Dickinson, Franklin Lakes, NJ, US), anti CD20 PrCPCy5.5 (Clone L27,
Becton Dickinson, Franklin Lakes, NJ, US), anti CD27-PE (Clone L128, Becton Dickinson,
Franklin Lakes, NJ, US), anti CD38-A700 (Clone HIT2, ExBio, Prague, CZ), anti IgG-V450
(Clone G18-145, Becton Dickinson, Franklin Lakes, NJ, US) and anti IgM-FITC (Clone G20-
127, Becton Dickinson, Franklin Lakes, NJ, US), to identify Plasmablasts (PB) and Naïve B
cells (NAIVE). PBMCs from day22 after vaccination were stained with CD20 PrCPCy5.5
(Clone L27, Becton Dickinson, Franklin Lakes, NJ, US), anti CD27-PE (Clone L128, Becton
Dickinson, Franklin Lakes, NJ, US), anti IgG-V450 (Clone G18-145, Becton Dickinson,
MATERIALS AND METHODS
42 |
Franklin Lakes, NJ, US), anti IgD-A700 (Clone IA6-2, Becton Dickinson, Franklin Lakes, NJ,
US) and Ag-Alexa647, to identify antigen specific Memory B cells (Ag+MBC). After
washing with 1,5 ml of PBS-1% FBS, cells were resuspended in 500µl of PBS-EDTA 5mM
and stored on ice before sorting at BD FACSAria™. PB
(CD19+/CD20dim/CD27++/CD38++), Ag-spec MBC (CD20+/CD27+/Ag+) and NAIVE
(CD19+/CD27-) populations were sorted as single cells in 96 well plates containing 5µl of
lysis buffer, consisting of 1mg/ml Ultrapure BSA (Ambion) and 1U/well Ribolock (Thermo)
diluted in PCR grade water (Life Sciences). Lysates plates were quickly put on dry ice and
then stored at -80°C.
6.4. cDNA synthesis and pre-amplification
Plates of lysates were thawed on ice and immediately used to perform reverse
transcription through the SuperscriptIII Reverse Transcriptase Kit (Life technologies). 5µl
of lysates present in each well were mixed with non-specific primers (0.25µl of 100µM
oligodT and 0.25µl of 100µM random hexamers, QIAGEN), 0.5µl of 10mM dNTPs (Life
Technologies) and 1µl of PCR grade water (Life Technologies). The plate was then
incubated at 65°C for 5 min. A mixture of 2µl of 5X RT buffer, 0.5µl of DTT, 2.5U of
SuperscriptIII and 0.5U of RNaseOUT (Life Technologies) was added to each well, after
the plate had been at least 1 min on ice. This final mix was put in the thermocycler and
incubated 5 min at 25°C, 60 min at 50°C, 15 min at 55°C, 15 min at 70°C and then put on
ice again. To verify if the quality of the material was suitable for further steps, a test
qPCR was performed mixing 1µl of cDNA with Taqman Universal Master Mix II (Life
Technologies), 0.5µl of 20X B2M Taqman Assay (Life Technologies) and 3,5µl of PCR
grade water. The qPCR plate was put in the qPCR machine (Lightcycler480II) and
incubated 2 min at 50°C and 10min at 95°C to allow activation of the enzyme and then
cycled for 40 cycles denaturing 15s at 95°C and annealing/extending 1min at 60°C. If an
acceptable amount of wells resulted positive then the cDNA was pre-amplified to
increase the amount of specific cDNA, using all gene-specific primers in a short multiplex
amplification reaction. In Subject A (SbjA), 5µl of cDNA were mixed with 12.5µl of 2X
Preamplification mastermix (Life Technologies), 1.3µl of 0.860µM previously prepared
Taqman assay mix (containing all target genes assays), 1.3µl of 0.86µM VH-κ-λ forward
primer mix, 1.3µl of 4.5µM CH-κ-λ reverse primer mix and 3.6µl of PCR grade water. 5µl
of the pre-amplified product was then diluted 1:8 in PCR grade water for gene
expression analysis, while the remainder was used undiluted for repertoire analysis. In
Subject B (SbjB) and the healthy donor the pre-amplification protocol was slightly
MATERIALS AND METHODS
| 43
different due to the different number of genes: 5µl of cDNA were mixed with 12.5µl of
2X Preamplification mastermix (Life Technologies), 7µl of 0.16µM previously prepared
Taqman assay mix (containing all target genes assays), 0.25µl of 4.5µM VH-κ-λ forward
primer mix and 0.25µl of 4.5µM CH-κ-λ reverse primer mix. The plate underwent the
following PCR program: 10 min at 95°C, 18 cycles of 15s at 95°C and 4 min at 57°C. 1µl of
the pre-amplified product was then diluted 1:8 in PCR grade water for gene expression
analysis, while the remainder was used undiluted for repertoire analysis. The sequences
of primers and the Taqman Assay IDs are shown in Table 1-2.
6.5. Single cell qPCR
Gene expression data in SbjA was obtained performing one qPCR amplification per
target gene separately for each plate of single cells. The qPCR reaction mix for each well
is prepared combining 1µl of diluted pre-amplified cDNA with 5µl of 2X Taqman
Universal Master Mix II (Life Technologies), 0.5µl of 20X Taqman assay, and 3.5µl of PCR
grade water in qPCR specific 96 well plates. The plate was put in the qPCR machine
(Lightcycler480II, Roche) and incubated 2 min at 50°C and 10min at 95°C to allow
activation of the enzyme and then cycled for 40 cycles denaturing 15s at 95°C and
annealing/extending 1 min at 60°C. Raw data were collected using the Lightcycler 480 II
software and analysed as reported below.
Gene expression data in SbjB and the healthy donor was obtained using the Biomark™
HD system (Fluidigm). The sample mix was prepared combining 2.7µl of diluted pre-
amplified cDNA with 0.30µl of 20X Sample Loading Reagent (Fluidigm) and 3µl of
Taqman Universal Master Mix II (Life Technologies). The assay mix was prepared mixing
3µl of each of the 96 20X Taqman Assays with 3µl of 2X Assay Loading Reagent
(Fluidigm). Samples and assays were loaded on the 96.96 Dynamic Array™ IFC after
priming, and then run on the Biomark™ HD qPCR machine. ROX has been used as
passive reference. Expression data has been retrieved using the Biomark “Data
Collection” software and Biomark “Real Time PCR Analysis” software using Linear
Derivative baseline correction and “Auto Detectors” Cq threshold method. Further
analysis methods are reported below. The Taqman assay ID are shown in Table 1.
6.6. Single cell Ig PCR and sequencing
The undiluted pre-amplified cDNA was used to amplify the immunoglobulins VH regions
with the Q5 High-Fidelity DNA polymerase (New England BioLabs). 4µl of product were
mixed with 5µl of 5X Reaction Buffer, 5µl of 5X GC Enhancer, 0.5µl of 10mM dNTPs (Life
MATERIALS AND METHODS
44 |
Technologies), 1.25µl of 10µM VH forward primer mix, 1.25µl of 10µM CH reverse
primer mix and 7.75µl of PCR grade water. The PCR program used was as follows: 30s at
98°C, 5 cycles of 10s at 98°C, 1min at 57°C and 1min at 72°C and 45 cycles of 10s at 98°C,
1min at 60°C and 1min at 72°C, and 7min at 72°C. The PCR products were visualized on a
2% agarose gel stained with GelRed (Biotium) to check for the presence of 350-450bp
VH products. The PCR products were purified with Agencourt Ampure beads (Beckman
Coulter) and finally sequenced with the ABI 3730xl 96 capillary DNA analyzer (Applied
Biosystems). Two or more sequencing reactions were performed for each PCR product
by using the same forward and reverse primer mixes as the Ig PCR (or single primers
when needed). The sequences of primers and the Taqman Assay IDs are shown in Table
1-2.
6.7. Quantification of antibodies in human plasma
These experiments were performed using the Gyrolab® system, a technology that
performs miniaturized immunoassay in a high-throughput manner allowing measuring
the antigen-antibody bindings. The fluorescence intensity signal of each data-point is
automatically provided by the instrument through the Gyrolab® evaluator software and
it is proportional to the quantity of antigen specific antibodies present in the plasma
sample. For total Ab quantification, plasma samples (diluted 1:2 during PBMC isolation)
were diluted 1:250 (total 1:500), 1:500 (total 1:1000) and 1:1000 (total 1:2000) in
RexxipH™ Buffer. For Ag-specific Ab quantification, plasma samples were diluted 1:25
(total 1:50) in RexxipH™, except for H3N2 IgA that were diluted 1:12,5 (total 1:25). They
were run using the quantification method to define the concentration of total or Ag-
specific IgG-M-A Ab present in the plasma samples. For capturing we used: Goat Anti-
Human IgG-biotin #109-065-003 Jackson, Goat anti-Human IgM-biotin #109-065-043
Jackson, Goat anti-Human IgA-biotin #109-065-011 Jackson. Seasonal Flu Ag 2013/14
(H1N1California-biotin 248ug/mL, H3N2Texas-biotin 286ug/mL and B Massachusetts-
biotin 250ug/mL). The concentration in the assay was 100ug/mL. For detection we used
anti-Human IgG A-647 (Fc Specific Jackson), anti-Human IgM A-647 (Fc Specific Jackson)
and anti-Human IgA A-647 (Fc Specific Jackson). The concentration in the assay was
25nM.
6.8. Data analysis
Sorting was performed on BD FACSAria™ and data exported with FACSDiva™ software,
Fig. 4 Gene expression analysis of all SbjB B cell populations. (A) Single cell gene
expression values (log2(30-Ct), 96 genes) of n=210 total B cells from SbjB at days 8 and
day22 after vaccination were used for unsupervised hierarchical clustering (heatmap
with dendogram of single B cells in columns and genes in rows) and (B) Linear
Discriminant Analysis (dot plot shows the position of every cell on the space defined by
the first two linear discriminant components LD1 and LD2). (C) Violin plots depicting
expression distribution of significant differentially expressed genes (ANOVA p<0.05)
resulting from Ag+MBC, PB and NAIVE population comparison, ranked by p-value from
top-left to bottom-right. For clarity purposes, protein IDs instead of gene IDs are used.
FIGURES AND TABLES
74 |
Figure 5
Fig. 5 comparison of Ag+MBC-NAIVE gene expression profiles in SbjB. (A) Linear
Discriminant Analysis of n=65 Ag+MBC and n=70 NAIVE single cell gene expression values
(log2(30-Ct), 96 genes) (histogram shows the distribution of cells on the space defined by
the first linear discriminant component LD1). (B) Violin plots depicting expression
distribution of significant differentially expressed genes (Tukey test, p<0.05) resulting
from Ag+MBC versus NAIVE comparison, ranked by p-value from top-left to bottom-right.
For clarity purposes, protein IDs instead of gene IDs are used.
FIGURES AND TABLES
| 75
Figure 6
Fig. 6 Subpopulations identification in Ag+MBC of SbjB. (A) Ag+MBC clustering
dendogram where the red line indicates the threshold distance (0.51) set to partition
the population in two subsets based on gene expression patterns. (B) Principal
Component Analysis showing the distribution and intersection of the identified clusters
of Ag+MBC.
FIGURES AND TABLES
76 |
Figure 7
Heatmap of Expression (Log2)
1:n
r
1:n
r
t betBADTCF7CD73CD40ATF3STAT4PIK3CACamKIVSTAT1PDL1PRKAR2BADORA2ABCL6LTASPI1SATB1BCL2CD80FCER2BACH2CD21CCR7PIK3CDBAFF RITPR1IL10RAHIF1aKLF9CXCR4PAX5SPIBCXCR5EBI2IRF8CD22FOXP1IL4RIL13RA1AKT3CXCR3CD3EUHRF1AKT1IL21RRORaIL12RB1PRKCZKLF2CD138JUNBMPR1ARUNX3FCGR2BSTAT3DOCK8IRF2GNAI2IL17RAMTORBATFKI-67STAT5IFNgR2MTA3CD19NFKB1AKT2ZBTB32IGBP1CD39CD79AB2MCD86MCL1XBP1CD38POU2AF1STAT2CD81TACIIL2RBATF6IRF4CD27BCMABLIMP1
1:nc
1:a
nn
ota
tio
n_
wid
th
A7
-PB
B8
-PB
D1
1-P
BE
12
-PB
C1
0-P
BB
7-P
BE
9-P
BD
12
-PB
D1
0-P
BA
9-P
BB
9-P
BG
12
-PB
H1
1-P
BB
10
-PB
C1
1-P
BG
9-P
BB
11
-PB
C9
-PB
H7
-PB
G1
0-P
BH
12
-PB
G1
1-P
BE
7-P
BA
11
-PB
C1
2-P
BH
8-P
BC
8-P
BF
9-P
BD
9-P
BG
7-P
BF
7-P
BA
4-M
BC
F1
2-P
BE
11
-PB
C7
-PB
F1
1-P
BE
10
-PB
A8
-PB
A1
0-P
BD
7-P
BH
9-P
BG
8-P
BH
5-M
BC
G6
-MB
CD
6-M
BC
H6
-MB
CE
3-M
BC
B3
-MB
CH
4-M
BC
H1
0-P
BF
1-M
BC
G4
-MB
CE
2-M
BC
C3
-MB
CD
3-M
BC
E8
-PB
B4
-MB
CF
3-M
BC
C4
-MB
CF
2-M
BC
F6
-MB
CH
1-M
BC
A2
-MB
CH
2-M
BC
F5
-MB
CE
6-M
BC
B6
-MB
CC
2-M
BC
C1
-MB
CC
6-M
BC
E4
-MB
CG
1-M
BC
E1
-MB
CB
5-M
BC
A5
-MB
CD
4-M
BC
C5
-MB
CF
4-M
BC
G2
-MB
CA
3-M
BC
H3
-MB
CA
6-M
BC
B2
-MB
CE
5-M
BC
G5
-MB
CG
3-M
BC
D2
-MB
CD
1-M
BC
0 2 4 6 8 10 12
Expression (log2)
Sample Group
MBC
PB
Gene Group
activation
apoptosis
ATP
BCR
Ca
cell cycle
CTRL
cyt receptor
homing
hypermutation
kinase
migration
ox stress
phenotype
TF
TF
A PB (43 cells) MBC (45 cells)
FIGURES AND TABLES
| 77
Fig. 7 Vaccinee (SbjB) versus healthy donor comparison of MBC populations. (A) Single
cell gene expression values (log2(30-Ct), 96 genes) of n=88 total B cells from the healthy
donor were used for unsupervised hierarchical clustering (heatmap with dendogram of
single B cells in columns and genes in rows). (B) Linear Discriminant Analysis showing
that MBC (grey) and PB (black) from healthy donor overlap with the respective vaccinee
populations (green Ag+MBC, blue PB). (C) Linear Discriminant Analysis of SbjB Ag+MBC
and healthy donor MBC single cell gene expression values (log2(30-Ct), 96 genes)
(histogram shows the distribution of cells on the space defined by the first linear
discriminant component LD1). (D) Violin plots depicting expression distribution of
significant differentially expressed genes (Tukey test, p<0.05) resulting from SbjB
Ag+MBC versus healthy donor MBC comparison, ranked by p-value from top-left to
bottom-right. For clarity purposes, protein ID instead of gene ID is used.
FIGURES AND TABLES
78 |
Figure 8
FIGURES AND TABLES
| 79
Fig. 8 Ig Repertoire analysis and correlations with gene expression data. (A) Ig
clonotype analysis performed on SbjB and healthy donor populations, with circles
indicating clonotype size and numbers inside circles indicating the number of clonotypes
of that particular size. (B) Ig isotype distribution over Ag+MBC, PB and NAIVE populations
in SbjB. (C) Spearmann correlation study of VH full gene mutation rate and gene
expression on SbjB Ag+MBC (top) and PB (bottom); dots represent ρ values for each
gene, orange color identifies significant correlations (p<0.05). (D) Association of Rorα
(left) and Tbet (right) expression with Ig isotype (ANOVA, ****p<0.0001). For clarity
purposes, protein IDs instead of gene IDs are used.
FIGURES AND TABLES
80 |
Supplementary Figure 1
Supplementary Fig. 1 Quantification of total and Ag-specific antibodies in vaccinees
and healthy donors plasma. Histograms reporting total Ig (left) and Ag-specific (right)
titers in plasma of 6 healthy donor (top row) and 4 vaccinees at Day8 (middle row) and
Day22 (bottom row) after vaccination for IgG, IgM and IgA isotypes. Red arrows indicate
subjects discussed in this work; red squares indicate Ag-specific titers of SbjB. These
results were obtained performing high-throughput ELISA on the Gyrolab Workstation.
FIGURES AND TABLES
| 81
FIGURES AND TABLES
82 |
Table 1 (continues on next page)
FIGURES AND TABLES
| 83
Table 1 (continues from previous page)
Table 1: List of IDs, Taqman Assay codes and categories of the genes (and respective
proteins) analyzed in this study.
FIGURES AND TABLES
84 |
Table 2
Table 2: Immunoglobulin-specific primers used for PCR amplification. Primers specific
for the V region of all Ig chains were introduced in the pre-amplification reaction mix
(‘Preamp’ ID prefix). VH specific primers were used in the Ig PCR and sequencing
procedure (‘Ig PCR’ ID prefix).
10. ACKNOWLEDGMENTS
ACKNOWLEDGMENTS
| 87
I would like to thank Monia Bardelli for day-by-day supervision and support during my
Ph.D., Giuseppe Del Giudice and Oretta Finco for feedback and insights during these
three years, and all the Translational Medicine function members for their help,
collaboration and friendship.
I also thank Prof. Cesare Montecucco, Prof. Paolo Bernardi and University of Padova, as
well as the GSK Sciences Academy, for giving me this chance and assisting my Ph.D.
activities.
Thanks to Prof. Alessandra Renieri and the UOC Genetica Medica AOUS for recruitment
of subjects and collection of the samples used in this study.
Special thanks also to Alessandro Muzzi and Nicola Pacchiani for their help in the
statistical analysis, and to the FACS Facility and Sequencing teams for the experimental
support.
ACKNOWLEDGMENTS
88 |
11. BIBLIOGRAPHY
BIBLIOGRAPHY
| 91
[1] Kondo M. Lymphoid and myeloid lineage commitment in multipotent hematopoietic progenitors. Immunol Rev 2010;238:37–46. doi:10.1111/j.1600-065X.2010.00963.x.
[2] Pelanda R, Torres RM. Central B-cell tolerance: where selection begins. Cold Spring Harb Perspect Biol 2012;4:a007146. doi:10.1101/cshperspect.a007146.
[3] Mårtensson I-L, Almqvist N, Grimsholm O, Bernardi AI. The pre-B cell receptor checkpoint. FEBS Lett 2010;584:2572–9. doi:10.1016/j.febslet.2010.04.057.
[4] LeBien TW, Tedder TF. B lymphocytes: how they develop and function. Blood 2008;112:1570–80. doi:10.1182/blood-2008-02-078071.
[5] Loder BF, Mutschler B, Ray RJ, Paige CJ, Sideras P, Torres R, et al. B Cell Development in the Spleen Takes Place in Discrete Steps and Is Determined by the Quality of B Cell Receptor-Derived Signals. J Exp Med 1999;190:75–90. doi:10.1084/jem.190.1.75.
[6] Chung JB, Silverman M, Monroe JG. Transitional B cells: step by step towards immune competence. Trends Immunol 2003;24:342–8. doi:10.1016/S1471-4906(03)00119-4.
[7] Cerutti A, Cols M, Puga I. Marginal zone B cells: virtues of innate-like antibody-producing lymphocytes. Nat Rev Immunol 2013;13:118–32. doi:10.1038/nri3383.
[8] De Silva NS, Klein U. Dynamics of B cells in germinal centres. Nat Rev Immunol 2015;15:137–48. doi:10.1038/nri3804.
[10] Willard-Mack C. Normal Structure, Function, and Histology of Lymph Nodes. Toxicol Pathol 2006;34:409–24. doi:10.1080/01926230600867727.
[11] Pereira JP, Kelly LM, Cyster JG. Finding the right niche: B-cell migration in the early phases of T-dependent antibody responses. Int Immunol 2010;22:413–9. doi:10.1093/intimm/dxq047.
[12] Link A, Vogt TK, Favre S, Britschgi MR, Acha-Orbea H, Hinz B, et al. Fibroblastic reticular cells in lymph nodes regulate the homeostasis of naive T cells. Nat Immunol 2007;8:1255–65. doi:10.1038/ni1513.
[13] Crawford A, Macleod M, Schumacher T, Corlett L, Gray D. Primary T cell expansion and differentiation in vivo requires antigen presentation by B cells. J Immunol 2006;176:3498–506.
[14] Reif K, Ekland EH, Ohl L, Nakano H, Lipp M, Förster R, et al. Balanced responsiveness to
BIBLIOGRAPHY
92 |
chemoattractants from adjacent zones determines B-cell position. Nature 2002;416:94–9. doi:10.1038/416094a.
[15] Chevrier S, Emslie D, Shi W, Kratina T, Wellard C, Karnowski A, et al. The BTB-ZF transcription factor Zbtb20 is driven by Irf4 to promote plasma cell differentiation and longevity. J Exp Med 2014;211:827–40. doi:10.1084/jem.20131831.
[16] Ansel KM, McHeyzer-Williams LJ, Ngo VN, McHeyzer-Williams MG, Cyster JG. In vivo-activated CD4 T cells upregulate CXC chemokine receptor 5 and reprogram their response to lymphoid chemokines. J Exp Med 1999;190:1123–34.
[17] Hardtke S, Ohl L, Förster R. Balanced expression of CXCR5 and CCR7 on follicular T helper cells determines their transient positioning to lymph node follicles and is essential for efficient B-cell help. Blood 2005;106:1924–31. doi:10.1182/blood-2004-11-4494.
[19] Kerfoot SM, Yaari G, Patel JR, Johnson KL, Gonzalez DG, Kleinstein SH, et al. Germinal center B cell and T follicular helper cell development initiates in the interfollicular zone. Immunity 2011;34:947–60. doi:10.1016/j.immuni.2011.03.024.
[20] Jacob J, Kelsoe G. In situ studies of the primary immune response to (4-hydroxy-3-nitrophenyl)acetyl. II. A common clonal origin for periarteriolar lymphoid sheath-associated foci and germinal centers. J Exp Med 1992;176:679–87.
[21] Kitano M, Moriyama S, Ando Y, Hikida M, Mori Y, Kurosaki T, et al. Bcl6 Protein Expression Shapes Pre-Germinal Center B Cell Dynamics and Follicular Helper T Cell Heterogeneity. Immunity 2011;34:961–72. doi:10.1016/j.immuni.2011.03.025.
[22] Mueller SN, Germain RN. Stromal cell contributions to the homeostasis and functionality of the immune system. Nat Rev Immunol 2009;9:618–29. doi:10.1038/nri2588.
[23] Allen CDC, Ansel KM, Low C, Lesley R, Tamamura H, Fujii N, et al. Germinal center dark and light zone organization is mediated by CXCR4 and CXCR5. Nat Immunol 2004;5:943–52. doi:10.1038/ni1100.
[24] Tarlinton DM, Smith KG. Dissecting affinity maturation: a model explaining selection of antibody-forming cells and memory B cells in the germinal centre. Immunol Today 2000;21:436–41.
[25] Tarlinton DM. Evolution in miniature: selection, survival and distribution of antigen reactive cells in the germinal centre. Immunol Cell Biol 2008;86:133–8. doi:10.1038/sj.icb.7100148.
[26] Victora GD, Mesin L. Clonal and cellular dynamics in germinal centers. Curr Opin Immunol
BIBLIOGRAPHY
| 93
2014;28:90–6. doi:10.1016/j.coi.2014.02.010.
[27] Vikstrom I, Tarlinton DM. B cell memory and the role of apoptosis in its formation. Mol Immunol 2011;48:1301–6. doi:10.1016/j.molimm.2010.10.026.
[28] Peron S, Laffleur B, Denis-Lagache N, Cook-Moreau J, Tinguely A, Delpy L, et al. AID-Driven Deletion Causes Immunoglobulin Heavy Chain Locus Suicide Recombination in B Cells. Science (80- ) 2012;336:931–4. doi:10.1126/science.1218692.
[29] Schwickert TA, Lindquist RL, Shakhar G, Livshits G, Skokos D, Kosco-Vilbois MH, et al. In vivo imaging of germinal centres reveals a dynamic open structure. Nature 2007;446:83–7. doi:10.1038/nature05573.
[30] Nutt SL, Hodgkin PD, Tarlinton DM, Corcoran LM. The generation of antibody-secreting plasma cells. Nat Rev Immunol 2015;15:160–71. doi:10.1038/nri3795.
[31] McHeyzer-Williams M, Okitsu S, Wang N, McHeyzer-Williams L. Molecular programming of B cell memory. Nat Rev Immunol 2012;12:24–34. doi:10.1038/nri3128.
[32] Revilla-i-domingo R, Bilic I, Vilagos B, Tagoh H, Ebert A, Tamir IM, et al. The B-cell identity factor Pax5 regulates distinct transcriptional programmes in early and late B lymphopoiesis. EMBO J 2012;31:3130–46. doi:10.1038/emboj.2012.155.
[33] Nutt SL, Urbánek P, Rolink A, Busslinger M. Essential functions of Pax5 (BSAP) in pro-B cell development: difference between fetal and adult B lymphopoiesis and reduced V-to-DJ recombination at the IgH locus. Genes Dev 1997;11:476–91.
[34] Horcher M, Souabni A, Busslinger M. Pax5/BSAP maintains the identity of B cells in late B lymphopoiesis. Immunity 2001;14:779–90.
[35] Fuxa M, Skok J, Souabni A, Salvagiotto G, Roldan E, Busslinger M. Pax5 induces V-to-DJ rearrangements and locus contraction of the immunoglobulin heavy-chain gene. Genes Dev 2004;18:411–22. doi:10.1101/gad.291504.
[36] Hsu L-Y. Pax5 Activates Immunoglobulin Heavy Chain V to DJ Rearrangement in Transgenic Thymocytes. J Exp Med 2004;199:825–30. doi:10.1084/jem.20032249.
[37] Delogu A, Schebesta A, Sun Q, Aschenbrenner K, Perlot T, Busslinger M. Gene repression by Pax5 in B cells is essential for blood cell homeostasis and is reversed in plasma cells. Immunity 2006;24:269–81. doi:10.1016/j.immuni.2006.01.012.
[38] Lin K-I, Angelin-Duclos C, Kuo TC, Calame K. Blimp-1-dependent repression of Pax-5 is required for differentiation of B cells to immunoglobulin M-secreting plasma cells. Mol Cell Biol 2002;22:4771–80.
[39] Nera K-P, Kohonen P, Narvi E, Peippo A, Mustonen L, Terho P, et al. Loss of Pax5
[40] Yasuda T, Hayakawa F, Kurahashi S, Sugimoto K, Minami Y, Tomita A, et al. B cell receptor-ERK1/2 signal cancels PAX5-dependent repression of BLIMP1 through PAX5 phosphorylation: a mechanism of antigen-triggering plasma cell differentiation. J Immunol 2012;188:6127–34. doi:10.4049/jimmunol.1103039.
[41] Basso K, Schneider C, Shen Q, Holmes AB, Setty M, Leslie C, et al. BCL6 positively regulates AID and germinal center gene expression via repression of miR-155. J Exp Med 2012;209:2455–65. doi:10.1084/jem.20121387.
[42] Baumjohann D, Okada T, Ansel KM. Cutting Edge: Distinct Waves of BCL6 Expression during T Follicular Helper Cell Development. J Immunol 2011;187:2089–92. doi:10.4049/jimmunol.1101393.
[43] Basso K, Saito M, Sumazin P, Margolin AA, Wang K, Lim W-K, et al. Integrated biochemical and computational approach identifies BCL6 direct target genes controlling multiple pathways in normal germinal center B cells. Blood 2010;115:975–84. doi:10.1182/blood-2009-06-227017.
[44] Huang C, Geng H, Boss I, Wang L, Melnick A. Cooperative transcriptional repression by BCL6 and BACH2 in germinal center B-cell differentiation. Blood 2014;123:1012–20. doi:10.1182/blood-2013-07-518605.
[45] Tunyaplin C, Shaffer AL, Angelin-Duclos CD, Yu X, Staudt LM, Calame KL. Direct repression of prdm1 by Bcl-6 inhibits plasmacytic differentiation. J Immunol 2004;173:1158–65.
[46] Angelin-Duclos C, Cattoretti G, Lin KI, Calame K. Commitment of B lymphocytes to a plasma cell fate is associated with Blimp-1 expression in vivo. J Immunol 2000;165:5462–71.
[47] Kallies A, Hasbold J, Tarlinton DM, Dietrich W, Corcoran LM, Hodgkin PD, et al. Plasma cell ontogeny defined by quantitative changes in blimp-1 expression. J Exp Med 2004;200:967–77. doi:10.1084/jem.20040973.
[48] Shaffer AL, Lin KI, Kuo TC, Yu X, Hurt EM, Rosenwald A, et al. Blimp-1 orchestrates plasma cell differentiation by extinguishing the mature B cell gene expression program. Immunity 2002;17:51–62.
[49] Shaffer AL, Shapiro-Shelef M, Iwakoshi NN, Lee A-H, Qian S-B, Zhao H, et al. XBP1, downstream of Blimp-1, expands the secretory apparatus and other organelles, and increases protein synthesis in plasma cell differentiation. Immunity 2004;21:81–93. doi:10.1016/j.immuni.2004.06.010.
[50] Kallies A, Hasbold J, Fairfax K, Pridans C, Emslie D, McKenzie BS, et al. Initiation of Plasma-Cell Differentiation Is Independent of the Transcription Factor Blimp-1. Immunity
BIBLIOGRAPHY
| 95
2007;26:555–66. doi:10.1016/j.immuni.2007.04.007.
[51] Todd DJ, McHeyzer-Williams LJ, Kowal C, Lee A-H, Volpe BT, Diamond B, et al. XBP1 governs late events in plasma cell differentiation and is not required for antigen-specific memory B cell development. J Exp Med 2009;206:2151–9. doi:10.1084/jem.20090738.
[52] Taubenheim N, Tarlinton DM, Crawford S, Corcoran LM, Hodgkin PD, Nutt SL. High rate of antibody secretion is not integral to plasma cell differentiation as revealed by XBP-1 deficiency. J Immunol 2012;189:3328–38. doi:10.4049/jimmunol.1201042.
[53] Benhamron S, Pattanayak SP, Berger M, Tirosh B. mTOR Activation Promotes Plasma Cell Differentiation and Bypasses XBP-1 for Immunoglobulin Secretion. Mol Cell Biol 2015;35:153–66. doi:10.1128/MCB.01187-14.
[54] Pengo N, Scolari M, Oliva L, Milan E, Mainoldi F, Raimondi A, et al. Plasma cells require autophagy for sustainable immunoglobulin production. Nat Immunol 2013;14:298–305. doi:10.1038/ni.2524.
[55] Manz RA, Thiel A, Radbruch A. Lifetime of plasma cells in the bone marrow. Nature 1997;388:133–4. doi:10.1038/40540.
[56] Halliley JL, Tipton CM, Liesveld J, Rosenberg AF, Darce J, Gregoretti I V, et al. Long-Lived Plasma Cells Are Contained within the CD19(-)CD38(hi)CD138(+) Subset in Human Bone Marrow. Immunity 2015;43:132–45. doi:10.1016/j.immuni.2015.06.016.
[57] Tooze RM. A Replicative Self-Renewal Model for Long-Lived Plasma Cells: Questioning Irreversible Cell Cycle Exit. Front Immunol 2013;4:460. doi:10.3389/fimmu.2013.00460.
[58] Lu R. IRF-4,8 orchestrate the pre-B-to-B transition in lymphocyte development. Genes Dev 2003;17:1703–8. doi:10.1101/gad.1104803.
[59] Rao S, Matsumura A, Yoon J, Simon MC. SPI-B activates transcription via a unique proline, serine, and threonine domain and exhibits DNA binding affinity differences from PU.1. J Biol Chem 1999;274:11115–24.
[60] Klein U, Casola S, Cattoretti G, Shen Q, Lia M, Mo T, et al. Transcription factor IRF4 controls plasma cell differentiation and class-switch recombination. Nat Immunol 2006;7:773–82. doi:10.1038/ni1357.
[61] Sciammas R, Shaffer AL, Schatz JH, Zhao H, Staudt LM, Singh H. Graded Expression of Interferon Regulatory Factor-4 Coordinates Isotype Switching with Plasma Cell Differentiation. Immunity 2006;25:225–36. doi:10.1016/j.immuni.2006.07.009.
[62] Ise W, Kohyama M, Schraml BU, Zhang T, Schwer B, Basu U, et al. The transcription factor BATF controls the global regulators of class-switch recombination in both B cells and T cells. Nat Immunol 2011;12:536–43. doi:10.1038/ni.2037.
BIBLIOGRAPHY
96 |
[63] Ochiai K, Maienschein-Cline M, Simonetti G, Chen J, Rosenthal R, Brink R, et al. Transcriptional regulation of germinal center B and plasma cell fates by dynamical control of IRF4. Immunity 2013;38:918–29. doi:10.1016/j.immuni.2013.04.009.
[64] Matsuyama T, Grossman A, Mittrücker HW, Siderovski DP, Kiefer F, Kawakami T, et al. Molecular cloning of LSIRF, a lymphoid-specific member of the interferon regulatory factor family that binds the interferon-stimulated response element (ISRE). Nucleic Acids Res 1995;23:2127–36.
[65] Willis SN, Good-Jacobson KL, Curtis J, Light A, Tellier J, Shi W, et al. Transcription Factor IRF4 Regulates Germinal Center Cell Formation through a B Cell-Intrinsic Mechanism. J Immunol 2014;192:3200–6. doi:10.4049/jimmunol.1303216.
[66] Sciammas R, Li Y, Warmflash A, Song Y, Dinner AR, Singh H. An incoherent regulatory network architecture that orchestrates B cell diversification in response to antigen signaling. Mol Syst Biol 2011;7:495. doi:10.1038/msb.2011.25.
[67] Saito M, Gao J, Basso K, Kitagawa Y, Smith PM, Bhagat G, et al. A Signaling Pathway Mediating Downregulation of BCL6 in Germinal Center B Cells Is Blocked by BCL6 Gene Alterations in B Cell Lymphoma. Cancer Cell 2007;12:280–92. doi:10.1016/j.ccr.2007.08.011.
[68] Lee CH, Melchers M, Wang H, Torrey TA, Slota R, Qi C-F, et al. Regulation of the germinal center gene program by interferon (IFN) regulatory factor 8/IFN consensus sequence-binding protein. J Exp Med 2006;203:63–72. doi:10.1084/jem.20051450.
[69] Cattoretti G, Shaknovich R, Smith PM, Jäck H-M, Murty V V, Alobeid B. Stages of germinal center transit are defined by B cell transcription factor coexpression and relative abundance. J Immunol 2006;177:6930–9.
[70] Feng J, Wang H, Shin D-M, Masiuk M, Qi C-F, Morse HC. IFN regulatory factor 8 restricts the size of the marginal zone and follicular B cell pools. J Immunol 2011;186:1458–66. doi:10.4049/jimmunol.1001950.
[71] Klein U, Tu Y, Stolovitzky GA, Keller JL, Haddad J, Miljkovic V, et al. Transcriptional analysis of the B cell germinal center reaction. Proc Natl Acad Sci U S A 2003;100:2639–44. doi:10.1073/pnas.0437996100.
[72] Vikstrom I, Carotta S, Lüthje K, Peperzak V, Jost PJ, Glaser S, et al. Mcl-1 is essential for germinal center formation and B cell memory. Science 2010;330:1095–9. doi:10.1126/science.1191793.
[73] Schuetz JM, Johnson NA, Morin RD, Scott DW, Tan K, Ben-Nierah S, et al. BCL2 mutations in diffuse large B-cell lymphoma. Leukemia 2012;26:1383–90. doi:10.1038/leu.2011.378.
[74] Hasbold J, Corcoran LM, Tarlinton DM, Tangye SG, Hodgkin PD. Evidence from the generation of immunoglobulin G–secreting cells that stochastic mechanisms regulate
[75] Tangye SG, Avery DT, Hodgkin PD. A division-linked mechanism for the rapid generation of Ig-secreting cells from human memory B cells. J Immunol 2003;170:261–9.
[76] Taylor JJ, Pape KA, Steach HR, Jenkins MK. Apoptosis and antigen affinity limit effector cell differentiation of a single naïve B cell 2015;347:11214–8.
[77] Takemori T, Kaji T, Takahashi Y, Shimoda M, Rajewsky K. Generation of memory B cells inside and outside germinal centers. Eur J Immunol 2014;44:1258–64. doi:10.1002/eji.201343716.
[78] Allen CDC, Okada T, Tang HL, Cyster JG. Imaging of germinal center selection events during affinity maturation. Science 2007;315:528–31. doi:10.1126/science.1136736.
[79] Taylor JJ, Pape KA, Jenkins MK. A germinal center-independent pathway generates unswitched memory B cells early in the primary response. J Exp Med 2012;209:597–606. doi:10.1084/jem.20111696.
[80] Linterman MA, Beaton L, Yu D, Ramiscal RR, Srivastava M, Hogan JJ, et al. IL-21 acts directly on B cells to regulate Bcl-6 expression and germinal center responses. J Exp Med 2010;207:353–63. doi:10.1084/jem.20091738.
[81] Dent AL, Shaffer AL, Yu X, Allman D, Staudt LM. Control of inflammation, cytokine expression, and germinal center formation by BCL-6. Science 1997;276:589–92.
[82] Fischer SF, Bouillet P, O’Donnell K, Light A, Tarlinton DM, Strasser A. Proapoptotic BH3-only protein Bim is essential for developmentally programmed death of germinal center-derived memory B cells and antibody-forming cells. Blood 2007;110:3978–84. doi:10.1182/blood-2007-05-091306.
[83] Jacob J, Kelsoe G, Rajewsky K, Weiss U. Intraclonal generation of antibody mutants in germinal centres. Nature 1991;354:389–92. doi:10.1038/354389a0.
[85] Montecino-Rodriguez E, Dorshkind K. B-1 B cell development in the fetus and adult. Immunity 2012;36:13–21. doi:10.1016/j.immuni.2011.11.017.
[86] Tarlinton D, Good-Jacobson K. Diversity among memory B cells: origin, consequences, and utility. Science 2013;341:1205–11. doi:10.1126/science.1241146.
[87] Berek C. The development of B cells and the B-cell repertoire in the microenvironment of the germinal center. Immunol Rev 1992;126:5–19.
BIBLIOGRAPHY
98 |
[88] Dogan I, Bertocci B, Vilmont V, Delbos F, Mégret J, Storck S, et al. Multiple layers of B cell memory with different effector functions. Nat Immunol 2009;10:1292–9. doi:10.1038/ni.1814.
[89] Pape KA, Taylor JJ, Maul RW, Gearhart PJ, Jenkins MK. Different B cell populations mediate early and late memory during an endogenous immune response. Science 2011;331:1203–7. doi:10.1126/science.1201730.
[90] Zuccarino-Catania G V, Sadanand S, Weisel FJ, Tomayko MM, Meng H, Kleinstein SH, et al. CD80 and PD-L2 define functionally distinct memory B cell subsets that are independent of antibody isotype. Nat Immunol 2014;15:631–7. doi:10.1038/ni.2914.
[91] Wang NS, McHeyzer-Williams LJ, Okitsu SL, Burris TP, Reiner SL, McHeyzer-Williams MG. Divergent transcriptional programming of class-specific B cell memory by T-bet and RORα. Nat Immunol 2012;13:604–11. doi:10.1038/ni.2294.
[92] Luckey CJ, Bhattacharya D, Goldrath AW, Weissman IL, Benoist C, Mathis D. Memory T and memory B cells share a transcriptional program of self-renewal with long-term hematopoietic stem cells 2006.
[93] Graef P, Buchholz VR, Stemberger C, Flossdorf M, Henkel L, Schiemann M, et al. Serial transfer of single-cell-derived immunocompetence reveals stemness of CD8(+) central memory T cells. Immunity 2014;41:116–26. doi:10.1016/j.immuni.2014.05.018.
[94] Barrington RA, Pozdnyakova O, Zafari MR, Benjamin CD, Carroll MC. B lymphocyte memory: role of stromal cell complement and FcgammaRIIB receptors. J Exp Med 2002;196:1189–99.
[95] Hikida M, Casola S, Takahashi N, Kaji T, Takemori T, Rajewsky K, et al. PLC-gamma2 is essential for formation and maintenance of memory B cells. J Exp Med 2009;206:681–9. doi:10.1084/jem.20082100.
[96] Maruyama M, Lam KP, Rajewsky K. Memory B-cell persistence is independent of persisting immunizing antigen. Nature 2000;407:636–42. doi:10.1038/35036600.
[97] Benson MJ, Dillon SR, Castigli E, Geha RS, Xu S, Lam K-P, et al. Cutting edge: the dependence of plasma cells and independence of memory B cells on BAFF and APRIL. J Immunol 2008;180:3655–9.
[98] Yu X, Tsibane T, McGraw PA, House FS, Keefer CJ, Hicar MD, et al. Neutralizing antibodies derived from the B cells of 1918 influenza pandemic survivors. Nature 2008;455:532–6. doi:10.1038/nature07231.
[99] Kometani K, Nakagawa R, Shinnakasu R, Kaji T, Rybouchkin A, Moriyama S, et al. Repression of the Transcription Factor Bach2 Contributes to Predisposition of IgG1 Memory B Cells toward Plasma Cell Differentiation. Immunity 2013;39:136–47.
BIBLIOGRAPHY
| 99
doi:10.1016/j.immuni.2013.06.011.
[100] Tonegawa S. Somatic generation of antibody diversity. Nature 1983;302:575–81. doi:10.1038/302575a0.
[101] Bassing CH, Swat W, Alt FW. The mechanism and regulation of chromosomal V(D)J recombination. Cell 2002;109 Suppl:S45–55.
[102] Gellert M. V(D)J recombination: RAG proteins, repair factors, and regulation. Annu Rev Biochem 2002;71:101–32. doi:10.1146/annurev.biochem.71.090501.150203.
[103] Brandt VL, Roth DB. A recombinase diversified: new functions of the RAG proteins. Curr Opin Immunol 2002;14:224–9.
[104] Haber JE. Partners and pathwaysrepairing a double-strand break. Trends Genet 2000;16:259–64.
[105] Honjo T, Kinoshita K, Muramatsu M. Molecular mechanism of class switch recombination: linkage with somatic hypermutation. Annu Rev Immunol 2002;20:165–96. doi:10.1146/annurev.immunol.20.090501.112049.
[106] Manis JP, Dudley D, Kaylor L, Alt FW. IgH class switch recombination to IgG1 in DNA-PKcs-deficient B cells. Immunity 2002;16:607–17.
[107] Jacobs H, Bross L. Towards an understanding of somatic hypermutation. Curr Opin Immunol 2001;13:208–18.
[108] Georgiou G, Ippolito GC, Beausang J, Busse CE, Wardemann H, Quake SR. The promise and challenge of high-throughput sequencing of the antibody repertoire. Nat Biotechnol 2014;32:158–68. doi:10.1038/nbt.2782.
[109] Wang C, Liu Y, Xu LT, Jackson KJL, Roskin KM, Pham TD, et al. Effects of aging, cytomegalovirus infection, and EBV infection on human B cell repertoires. J Immunol 2014;192:603–11. doi:10.4049/jimmunol.1301384.
[110] Trück J, Ramasamy MN, Galson JD, Rance R, Parkhill J, Lunter G, et al. Identification of antigen-specific B cell receptor sequences using public repertoire analysis. J Immunol 2015;194:252–61. doi:10.4049/jimmunol.1401405.
[111] Jackson KJL, Liu Y, Roskin KM, Glanville J, Hoh R a, Seo K, et al. Human responses to influenza vaccination show seroconversion signatures and convergent antibody rearrangements. Cell Host Microbe 2014;16:105–14. doi:10.1016/j.chom.2014.05.013.
[112] Nakaya HI, Wrammert J, Lee EK, Racioppi L, Marie-Kunze S, Haining WN, et al. Systems biology of vaccination for seasonal influenza in humans. Nat Immunol 2011;12:786–95. doi:10.1038/ni.2067.
BIBLIOGRAPHY
100 |
[113] Querec TD, Akondy RS, Lee EK, Cao W, Nakaya HI, Teuwen D, et al. Systems biology approach predicts immunogenicity of the yellow fever vaccine in humans. Nat Immunol 2009;10:116–25. doi:10.1038/ni.1688.
[114] Kennedy RB, Oberg AL, Ovsyannikova IG, Haralambieva IH, Grill D, Poland GA. Transcriptomic profiles of high and low antibody responders to smallpox vaccine. Genes Immun 14:277–85. doi:10.1038/gene.2013.14.
[115] Obermoser G, Presnell S, Domico K, Xu H, Wang Y, Anguiano E, et al. Systems Scale Interactive Exploration Reveals Quantitative and Qualitative Differences in Response to Influenza and Pneumococcal Vaccines. Immunity 2013;38:831–44. doi:10.1016/j.immuni.2012.12.008.
[116] Dominguez MH, Chattopadhyay PK, Ma S, Lamoreaux L, McDavid A, Finak G, et al. Highly multiplexed quantitation of gene expression on single cells. J Immunol Methods 2013;391:133–45. doi:10.1016/j.jim.2013.03.002.
[117] Feinerman O, Jentsch G, Tkach KE, Coward JW, Hathorn MM, Sneddon MW, et al. Single-cell quantification of IL-2 response by effector and regulatory T cells reveals critical plasticity in immune response. Mol Syst Biol 2010;6:437. doi:10.1038/msb.2010.90.
[118] Arsenio J, Kakaradov B, Metz PJ, Kim SH, Yeo GW, Chang JT. Early specification of CD8(+) T lymphocyte fates during adaptive immunity revealed by single-cell gene-expression analyses. Nat Immunol 2014;15. doi:10.1038/ni.2842.
[119] Weinstein JA, Zeng X, Chien Y, Quake SR. Correlation of Gene Expression and Genome Mutation in Single B-Cells 2013;8:6–10. doi:10.1371/journal.pone.0067624.
[121] Mestas J, Hughes CCW. Of mice and not men: differences between mouse and human immunology. J Immunol 2004;172:2731–8.
[122] Kepler TB. Reconstructing a B-cell clonal lineage. I. Statistical inference of unobserved ancestors. F1000Research 2013;2:103. doi:10.12688/f1000research.2-103.v1.
[123] Flynn JM, Spusta SC, Rosen CJ, Melov S. Single cell gene expression profiling of cortical osteoblast lineage cells. Bone 2013;53:174–81. doi:10.1016/j.bone.2012.11.043.
[124] Carotta S, Willis SN, Hasbold J, Inouye M, Pang SHM, Emslie D, et al. The transcription factors IRF8 and PU.1 negatively regulate plasma cell differentiation. J Exp Med 2014;211:2169–81. doi:10.1084/jem.20140425.
BIBLIOGRAPHY
| 101
[125] Hu H, Wang B, Borde M, Nardone J, Maika S, Allred L, et al. Foxp1 is an essential transcriptional regulator of B cell development. Nat Immunol 2006;7:819–26. doi:10.1038/ni1358.
[126] Sagardoy A, Martinez-Ferrandis JI, Roa S, Bunting KL, Aznar MA, Elemento O, et al. Downregulation of FOXP1 is required during germinal center B-cell function. Blood 2013;121:4311–20. doi:10.1182/blood-2012-10-462846.
[127] Corcoran LM, Hasbold J, Dietrich W, Hawkins E, Kallies A, Nutt SL, et al. Differential requirement for OBF-1 during antibody-secreting cell differentiation. J Exp Med 2005;201:1385–96. doi:10.1084/jem.20042325.
[128] Nelson N, Kanno Y, Hong C, Contursi C, Fujita T, Fowlkes BJ, et al. Expression of IFN regulatory factor family proteins in lymphocytes. Induction of Stat-1 and IFN consensus sequence binding protein expression by T cell activation. J Immunol 1996;156:3711–20.
[129] Calame K. Transcription factors that regulate memory in humoral responses 2006;211:269–79.
[130] Kuo TC, Calame KL. B lymphocyte-induced maturation protein (Blimp)-1, IFN regulatory factor (IRF)-1, and IRF-2 can bind to the same regulatory sites. J Immunol 2004;173:5556–63.
[131] Good KL, Tangye SG. Decreased expression of Kru ¨ ppel-like factors in memory B cells induces the rapid response typical of secondary antibody responses 2010.
[132] Hart GT, Hogquist K a, Jameson SC. Krüppel-like factors in lymphocyte biology. J Immunol 2012;188:521–6. doi:10.4049/jimmunol.1101530.
[133] Deenick EK, Avery DT, Chan A, Berglund LJ, Ives ML, Moens L, et al. Naive and memory human B cells have distinct requirements for STAT3 activation to differentiate into antibody-secreting plasma cells. J Exp Med 2013;210:2739–53. doi:10.1084/jem.20130323.
[134] Gatto D, Brink R. B cell localization: regulation by EBI2 and its oxysterol ligand. Trends Immunol 2013;34:336–41. doi:10.1016/j.it.2013.01.007.
[135] Han S-B, Moratz C, Huang N-N, Kelsall B, Cho H, Shi C-S, et al. Rgs1 and Gnai2 regulate the entrance of B lymphocytes into lymph nodes and B cell motility within lymph node follicles. Immunity 2005;22:343–54. doi:10.1016/j.immuni.2005.01.017.
[136] Zhang S, Pruitt M, Tran D, Du Bois W, Zhang K, Patel R, et al. B cell-specific deficiencies in mTOR limit humoral immune responses. J Immunol 2013;191:1692–703. doi:10.4049/jimmunol.1201767.
[137] Keating R, Hertz T, Wehenkel M, Harris TL, Edwards BA, McClaren JL, et al. The kinase mTOR modulates the antibody response to provide cross-protective immunity to lethal
BIBLIOGRAPHY
102 |
infection with influenza virus. Nat Immunol 2013;14:1266–76. doi:10.1038/ni.2741.
[138] Limon JJ, Fruman DA. Akt and mTOR in B Cell Activation and Differentiation. Front Immunol 2012;3:228. doi:10.3389/fimmu.2012.00228.
[139] Limon JJ, So L, Jellbauer S, Chiu H, Corado J, Sykes SM, et al. mTOR kinase inhibitors promote antibody class switching via mTORC2 inhibition. Proc Natl Acad Sci U S A 2014;111:E5076–85. doi:10.1073/pnas.1407104111.
[140] Cai S, Lee CC, Kohwi-Shigematsu T. SATB1 packages densely looped, transcriptionally active chromatin for coordinated expression of cytokine genes. Nat Genet 2006;38:1278–88. doi:10.1038/ng1913.
[141] Will B, Vogler TO, Bartholdy B, Garrett-Bakelman F, Mayer J, Barreyro L, et al. Satb1 regulates the self-renewal of hematopoietic stem cells by promoting quiescence and repressing differentiation commitment. Nat Immunol 2013;14:437–45. doi:10.1038/ni.2572.
[142] Tomayko MM, Steinel NC, Anderson SM, Shlomchik MJ. Cutting edge: Hierarchy of maturity of murine memory B cell subsets. J Immunol 2010;185:7146–50. doi:10.4049/jimmunol.1002163.
[143] Anderson SM, Tomayko MM, Ahuja A, Haberman AM, Shlomchik MJ. New markers for murine memory B cells that define mutated and unmutated subsets. J Exp Med 2007;204:2103–14. doi:10.1084/jem.20062571.
[144] Bemark M, Bergqvist P, Stensson A, Holmberg A, Mattsson J, Lycke NY. A unique role of the cholera toxin A1-DD adjuvant for long-term plasma and memory B cell development. J Immunol 2011;186:1399–410. doi:10.4049/jimmunol.1002881.
[145] Onodera T, Takahashi Y, Yokoi Y, Ato M, Kodama Y, Hachimura S, et al. Memory B cells in the lung participate in protective humoral immune responses to pulmonary influenza virus reinfection. Proc Natl Acad Sci U S A 2012;109:2485–90. doi:10.1073/pnas.1115369109.
[146] Yates JL, Racine R, McBride KM, Winslow GM. T cell-dependent IgM memory B cells generated during bacterial infection are required for IgG responses to antigen challenge. J Immunol 2013;191:1240–9. doi:10.4049/jimmunol.1300062.
[147] Seifert M, Przekopowitz M, Taudien S, Lollies A, Ronge V, Drees B, et al. Functional capacities of human IgM memory B cells in early inflammatory responses and secondary germinal center reactions. Proc Natl Acad Sci U S A 2015;112:E546–55. doi:10.1073/pnas.1416276112.
[148] Tomayko MM, Anderson SM, Brayton CE, Sadanand S, Steinel NC, Behrens TW, et al. Systematic Comparison of Gene Expression between Murine Memory and Naive B Cells Demonstrates That Memory B Cells Have Unique Signaling Capabilities 1 2008.
BIBLIOGRAPHY
| 103
[149] Shin D-M, Lee C-H, Morse HC. IRF8 governs expression of genes involved in innate and adaptive immunity in human and mouse germinal center B cells. PLoS One 2011;6:e27384. doi:10.1371/journal.pone.0027384.
[150] Schmidlin H, Diehl S a, Nagasawa M, Scheeren F a, Schotte R, Uittenbogaart CH, et al. Spi-B inhibits human plasma cell differentiation by repressing BLIMP1 and XBP-1 expression. Blood 2008;112:1804–12. doi:10.1182/blood-2008-01-136440.
[151] Giesecke C, Frölich D, Reiter K, Mei HE, Wirries I, Kuhly R, et al. Tissue distribution and dependence of responsiveness of human antigen-specific memory B cells. J Immunol 2014;192:3091–100. doi:10.4049/jimmunol.1302783.
[152] Haze K, Yoshida H, Yanagi H, Yura T, Mori K. Mammalian Transcription Factor ATF6 Is Synthesized as a Transmembrane Protein and Activated by Proteolysis in Response to Endoplasmic Reticulum Stress. Mol Biol Cell 1999;10:3787–99. doi:10.1091/mbc.10.11.3787.
[153] Bommiasamy H, Back SH, Fagone P, Lee K, Meshinchi S, Vink E, et al. ATF6 induces XBP1-independent expansion of the endoplasmic reticulum. J Cell Sci 2009;122:1626–36. doi:10.1242/jcs.045625.
[154] Ravindran R, Khan N, Nakaya HI, Li S, Loebbermann J, Maddur MS, et al. Vaccine activation of the nutrient sensor GCN2 in dendritic cells enhances antigen presentation. Science 2014;343:313–7. doi:10.1126/science.1246829.
[155] Dorner T, Shock A, Goldenberg DM, Lipsky PE. The mechanistic impact of CD22 engagement with epratuzumab on B cell function: Implications for the treatment of systemic lupus erythematosus. Autoimmun Rev 2015;14:1079–86. doi:10.1016/j.autrev.2015.07.013.
[156] Onodera T, Poe JC, Tedder TF, Tsubata T. CD22 regulates time course of both B cell division and antibody response. J Immunol 2008;180:907–13. doi:10.4049/jimmunol.180.2.907.
[157] Banchereau J, Brière F, Liu YJ, Rousset F. Molecular control of B lymphocyte growth and differentiation. Stem Cells 1994;12:278–88. doi:10.1002/stem.5530120304.
[158] Wouters BG, Koritzinsky M. Hypoxia signalling through mTOR and the unfolded protein response in cancer. Nat Rev Cancer 2008;8:851–64. doi:10.1038/nrc2501.
[160] Cerutti A, Rescigno M. The biology of intestinal immunoglobulin A responses. Immunity 2008;28:740–50. doi:10.1016/j.immuni.2008.05.001.
BIBLIOGRAPHY
104 |
[161] Karp G. Cell and Molecular Biology: Concepts and Experiments. John Wiley & Sons; 2009.
[162] de Villartay J-P, Fischer A, Durandy A. The mechanisms of immune diversification and their disorders. Nat Rev Immunol 2003;3:962–72. doi:10.1038/nri1247.


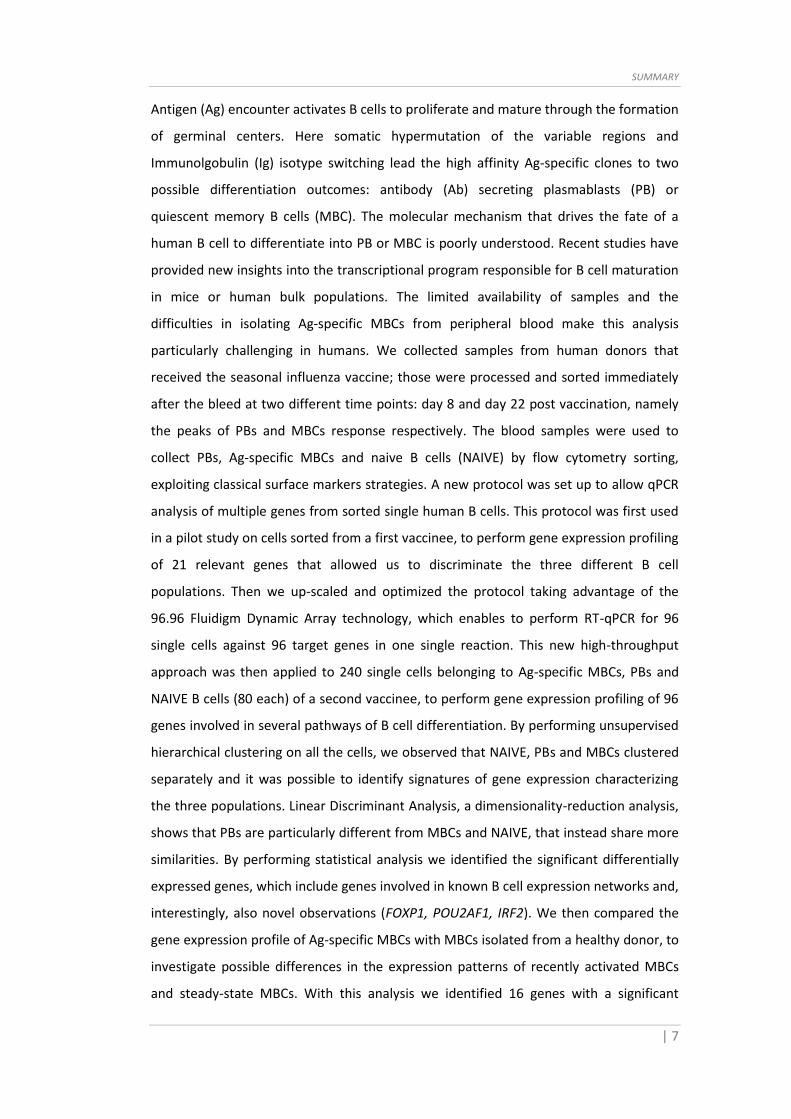


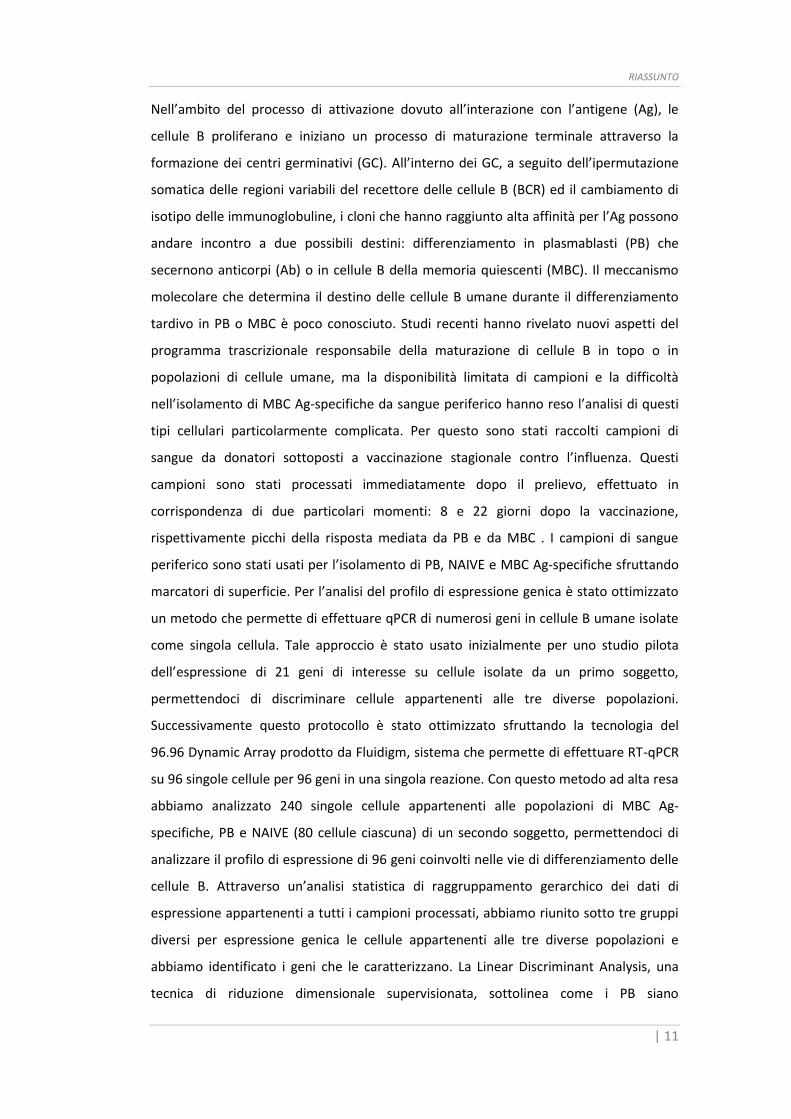
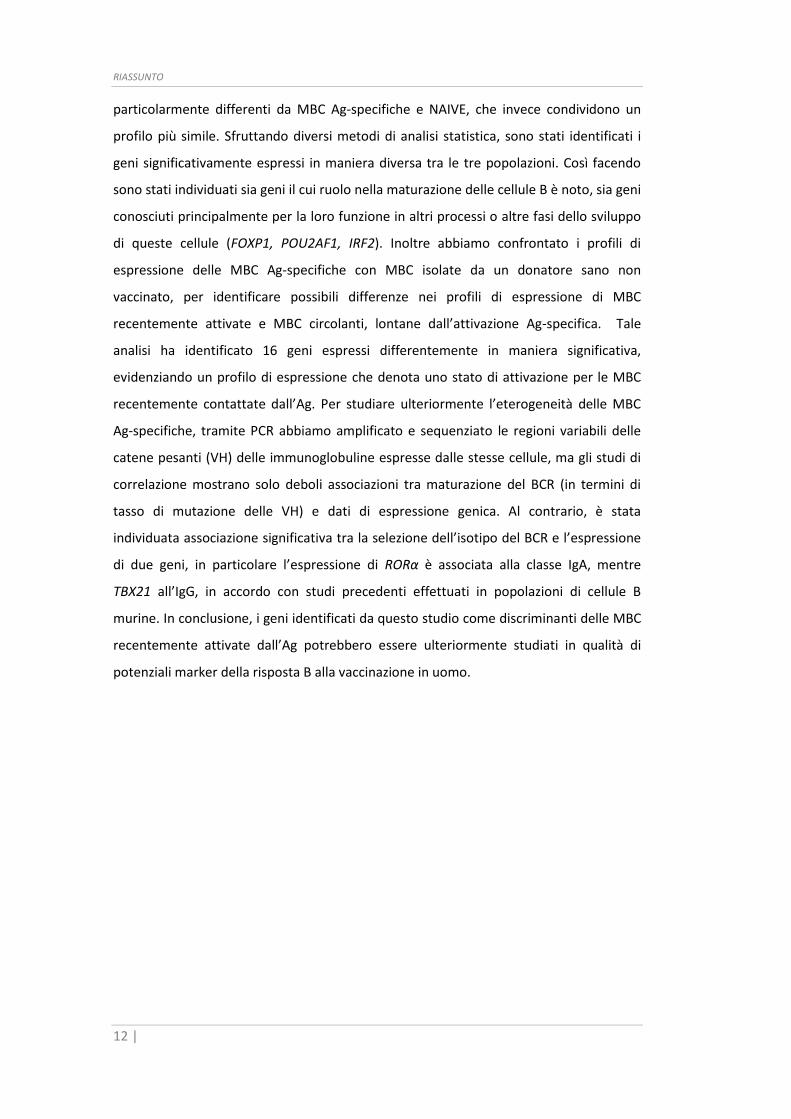


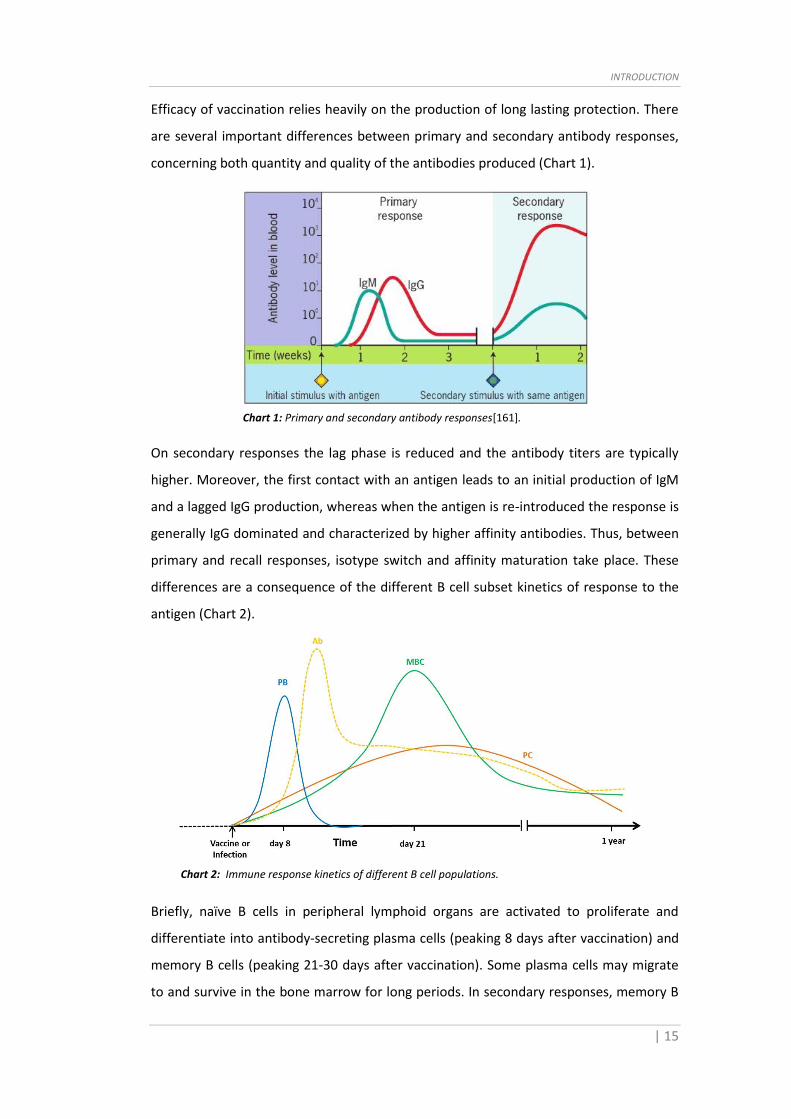
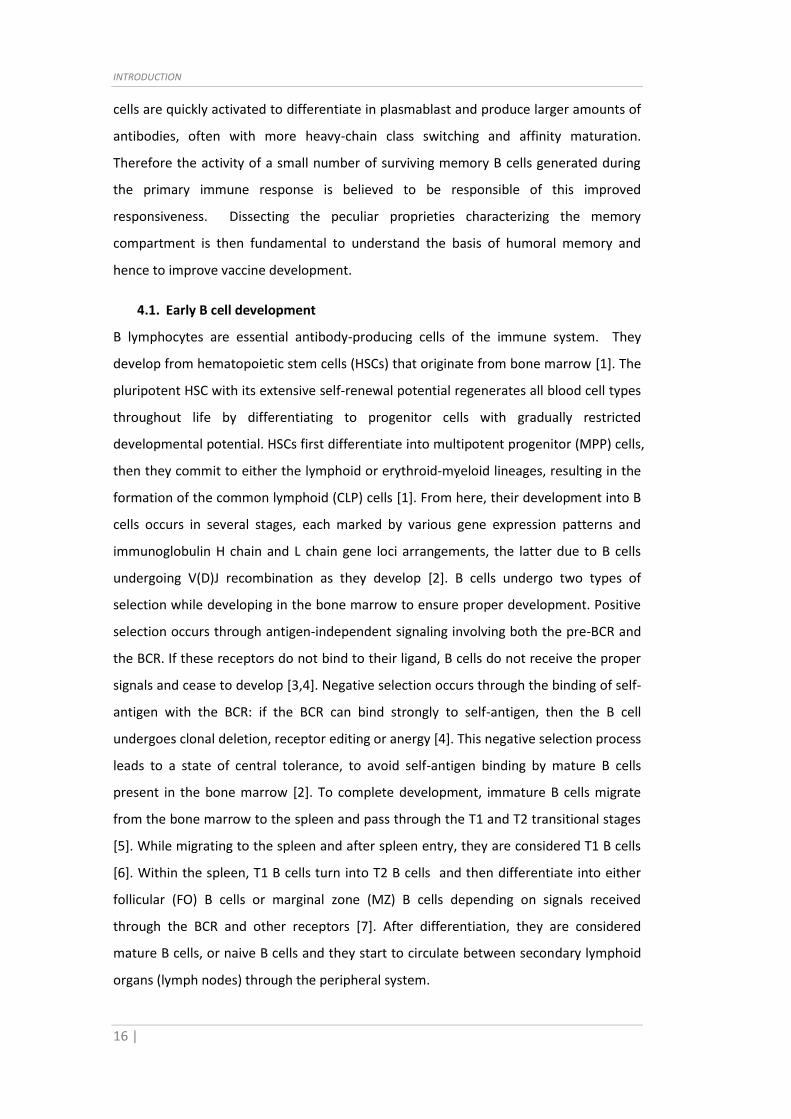
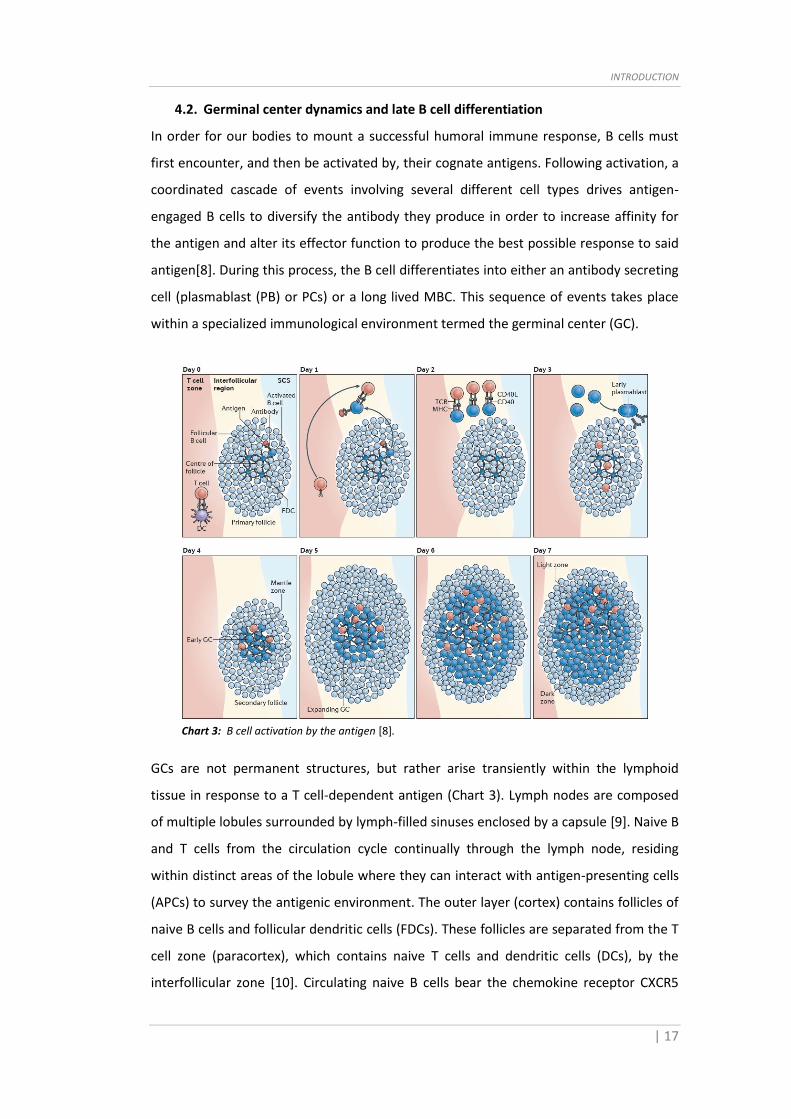
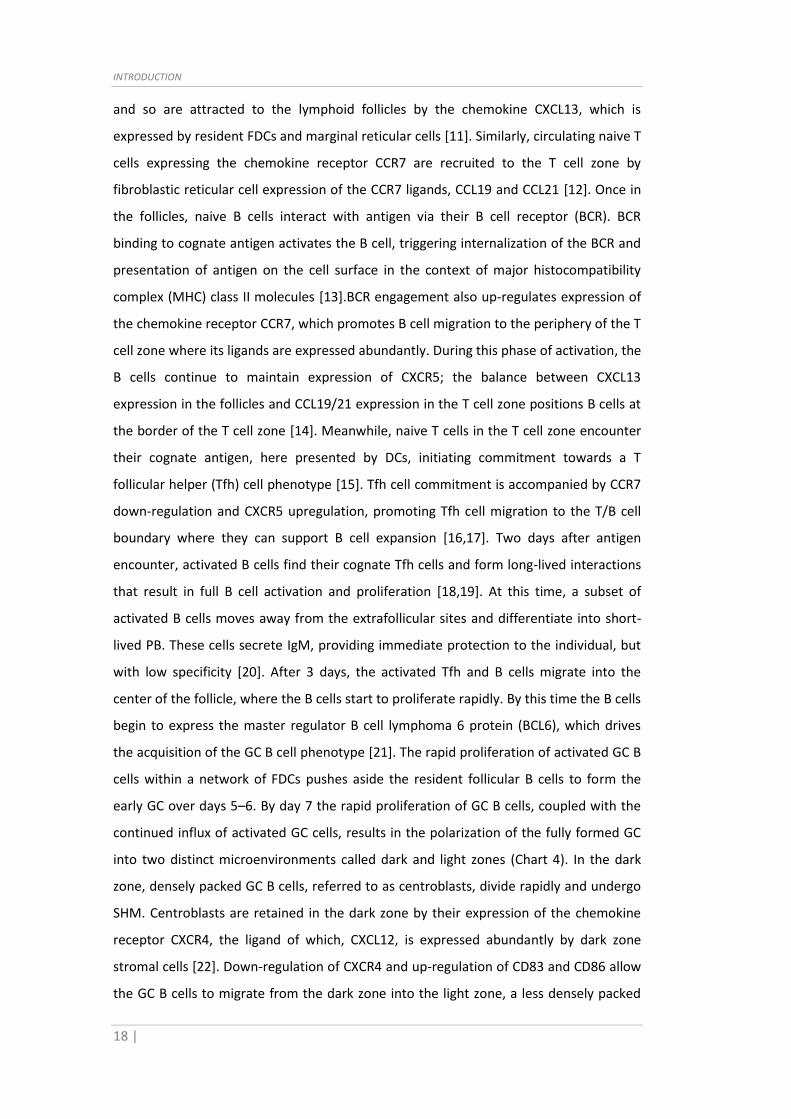
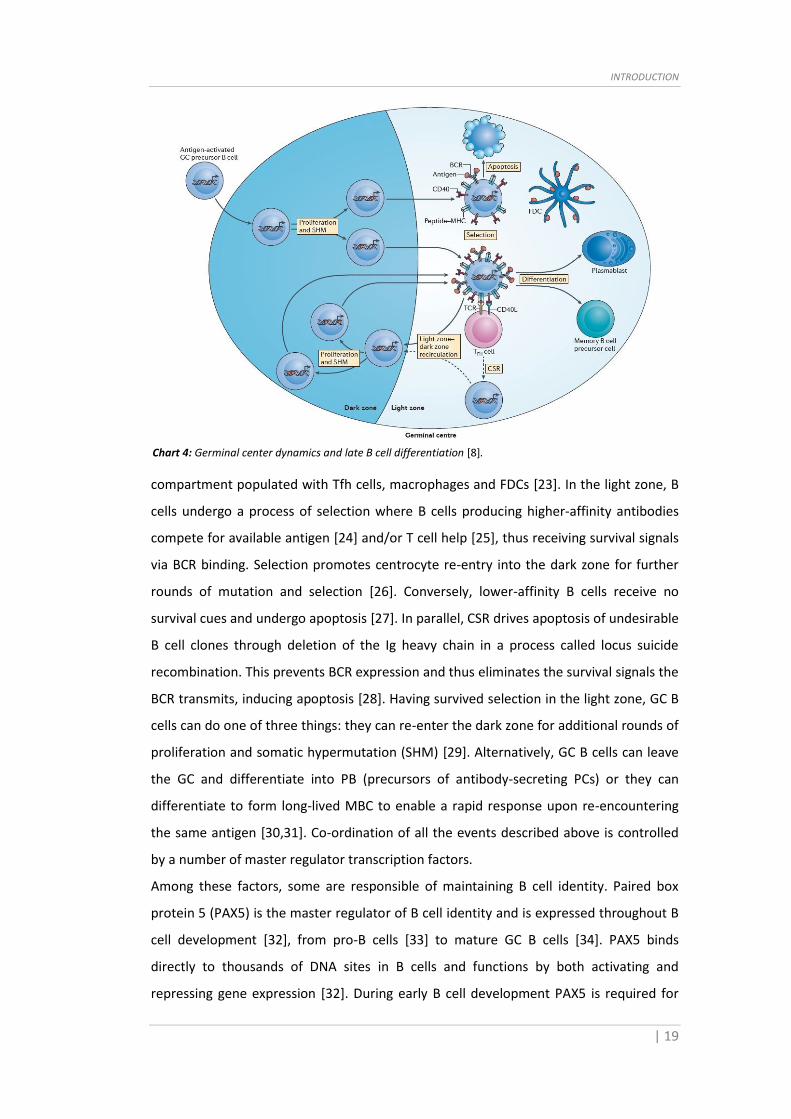
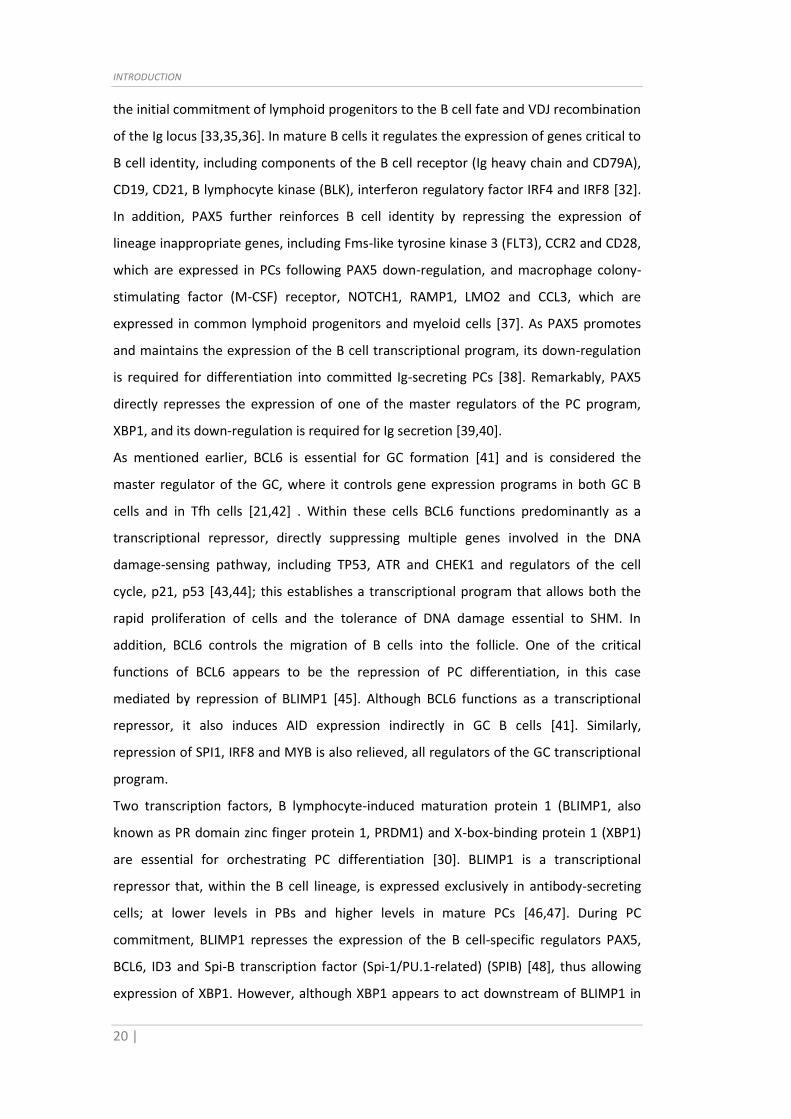
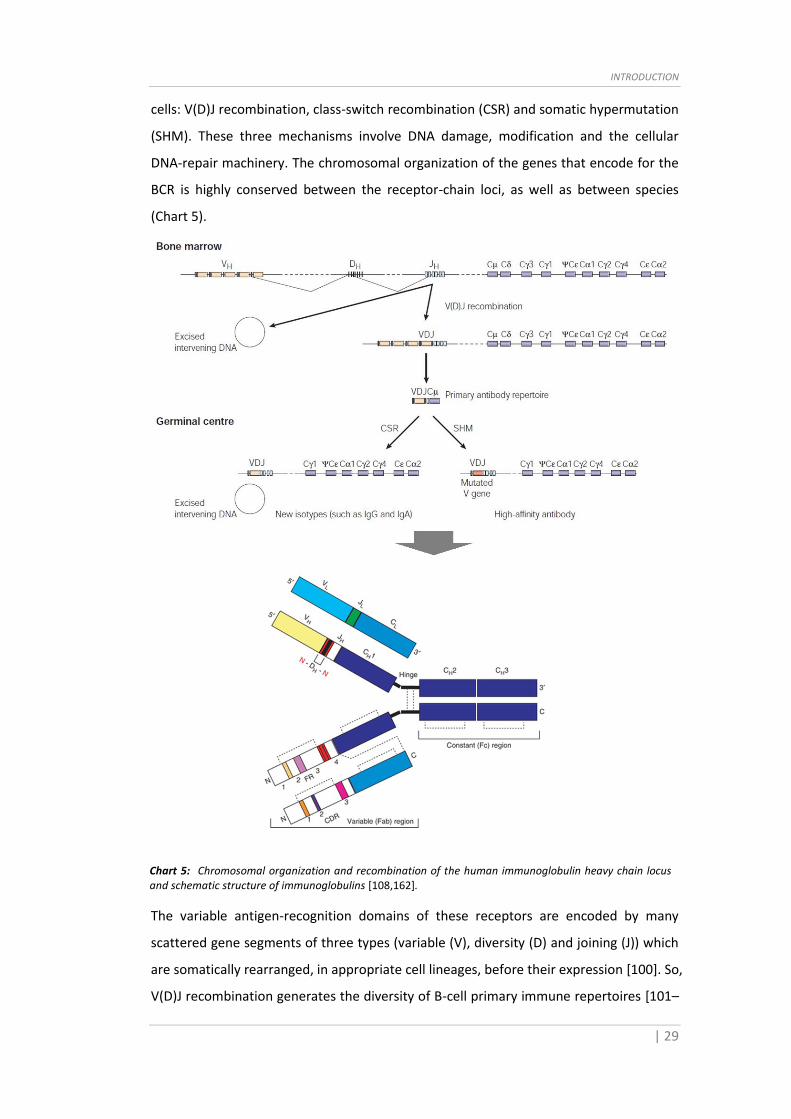
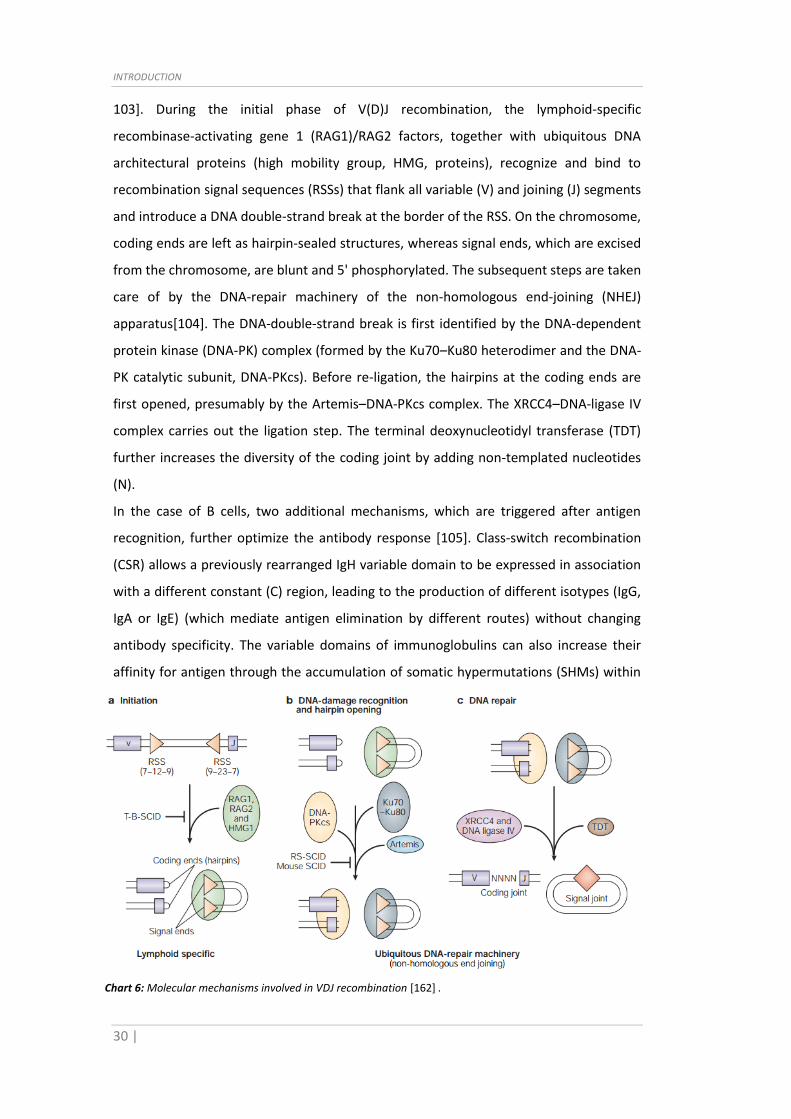


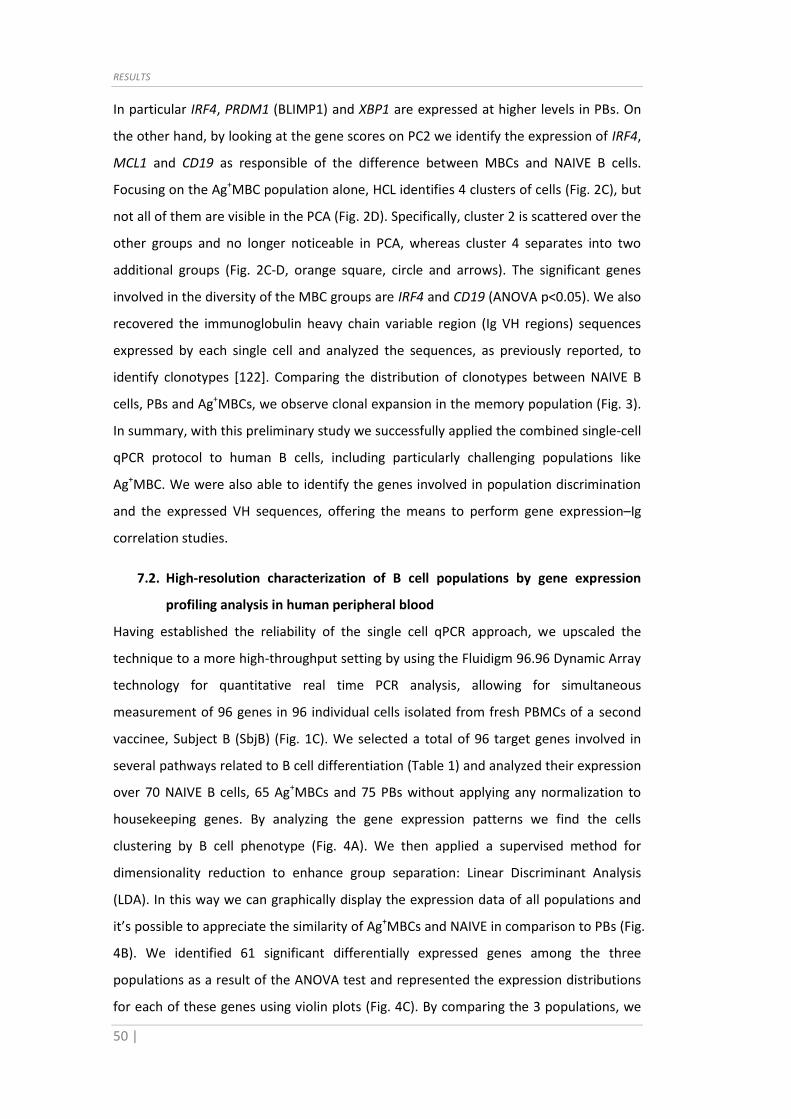
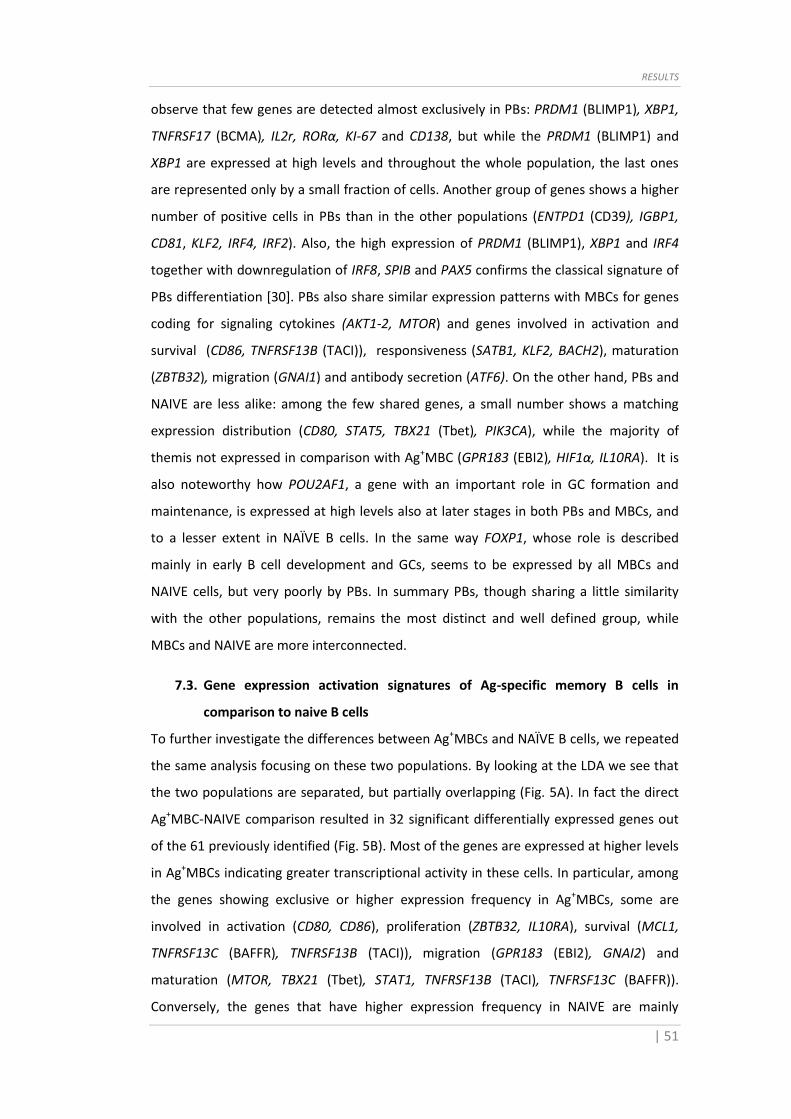
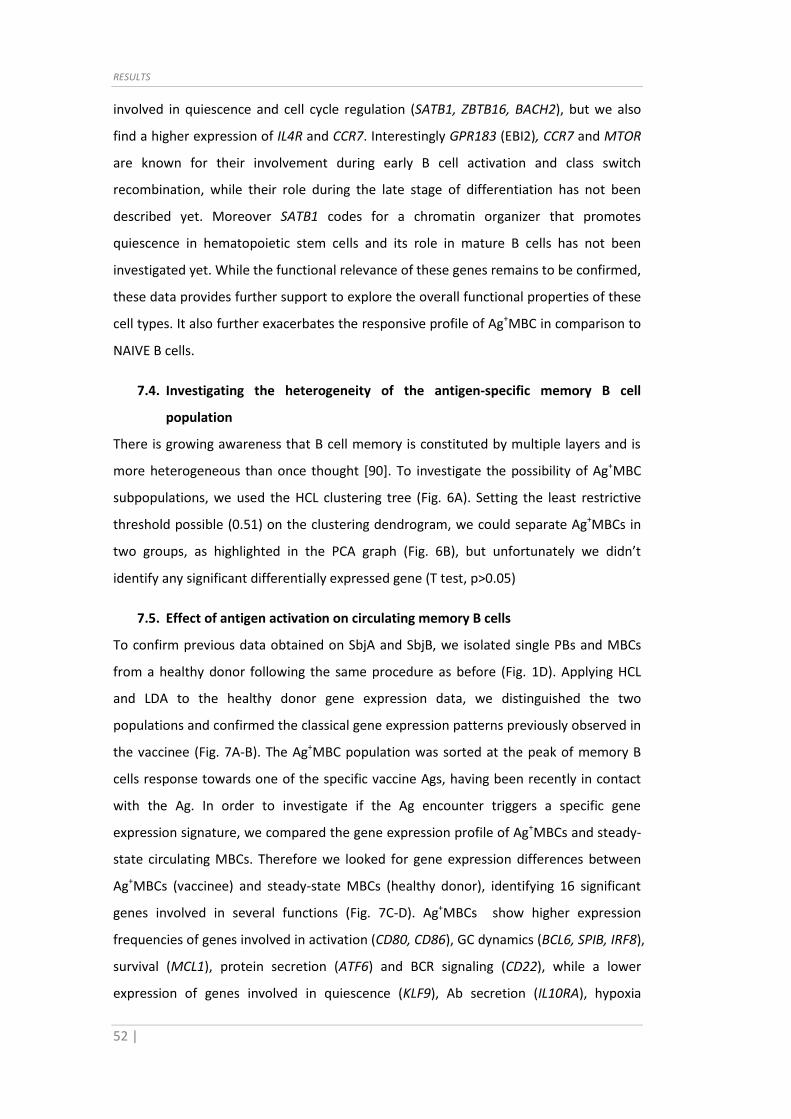
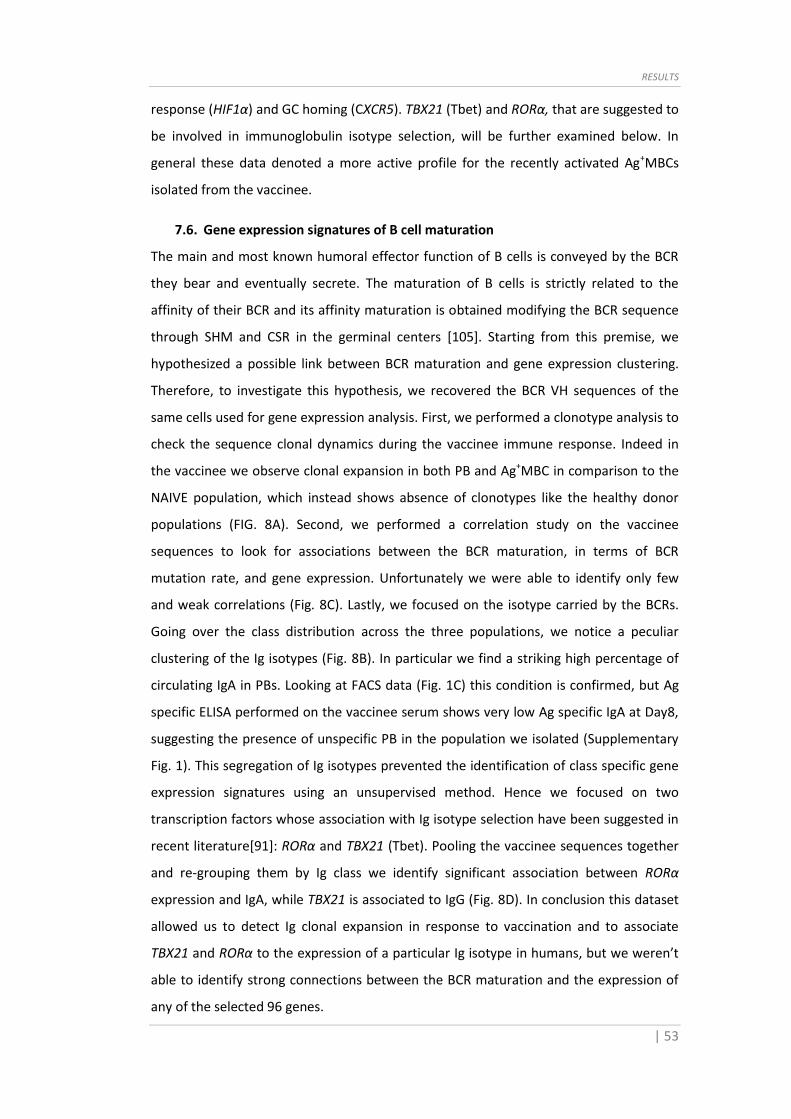


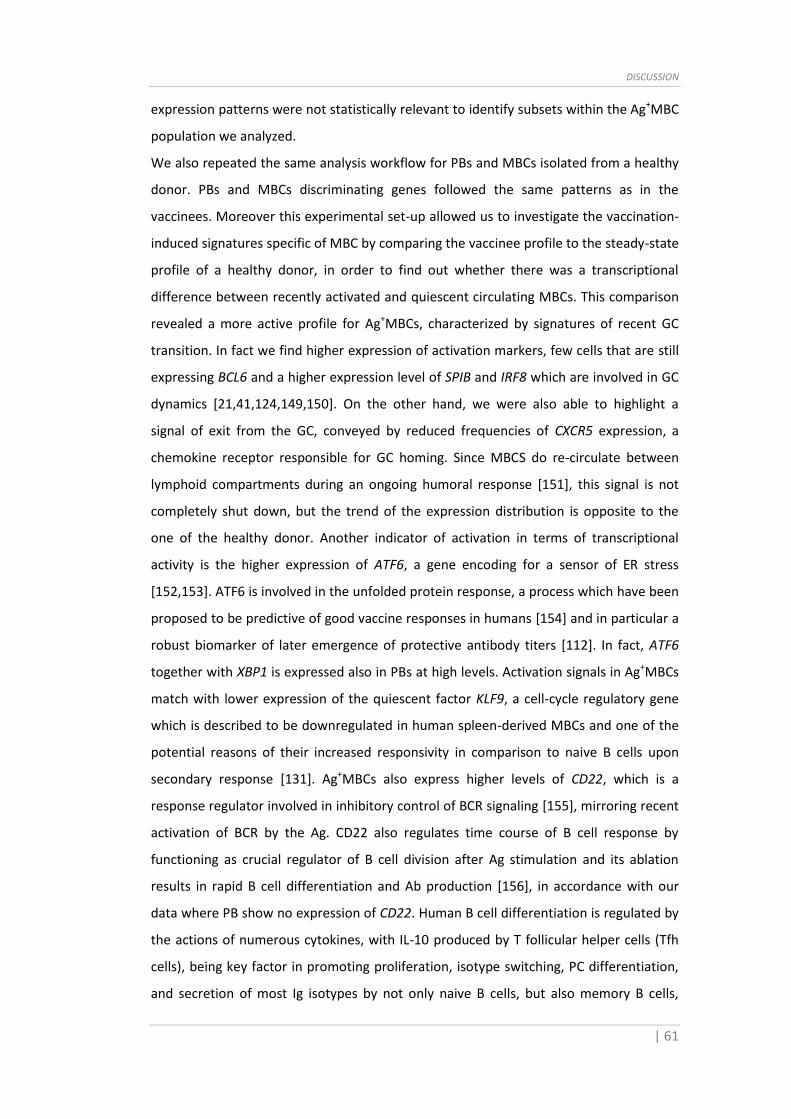
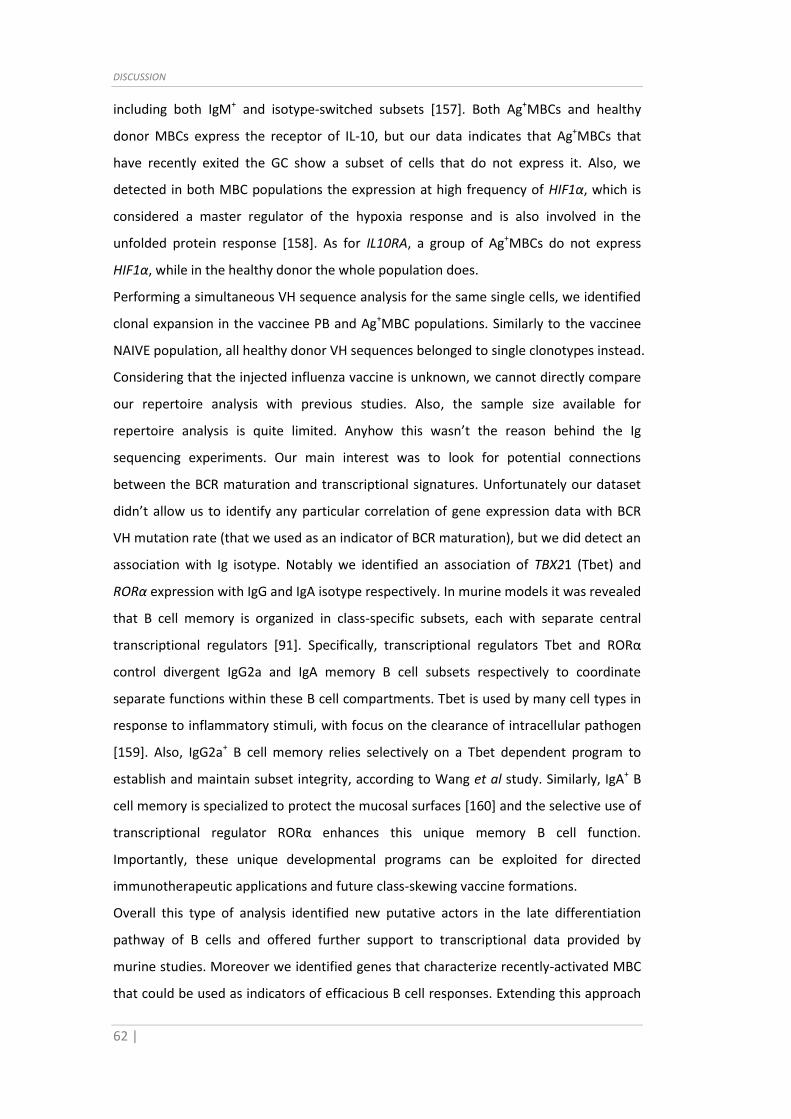


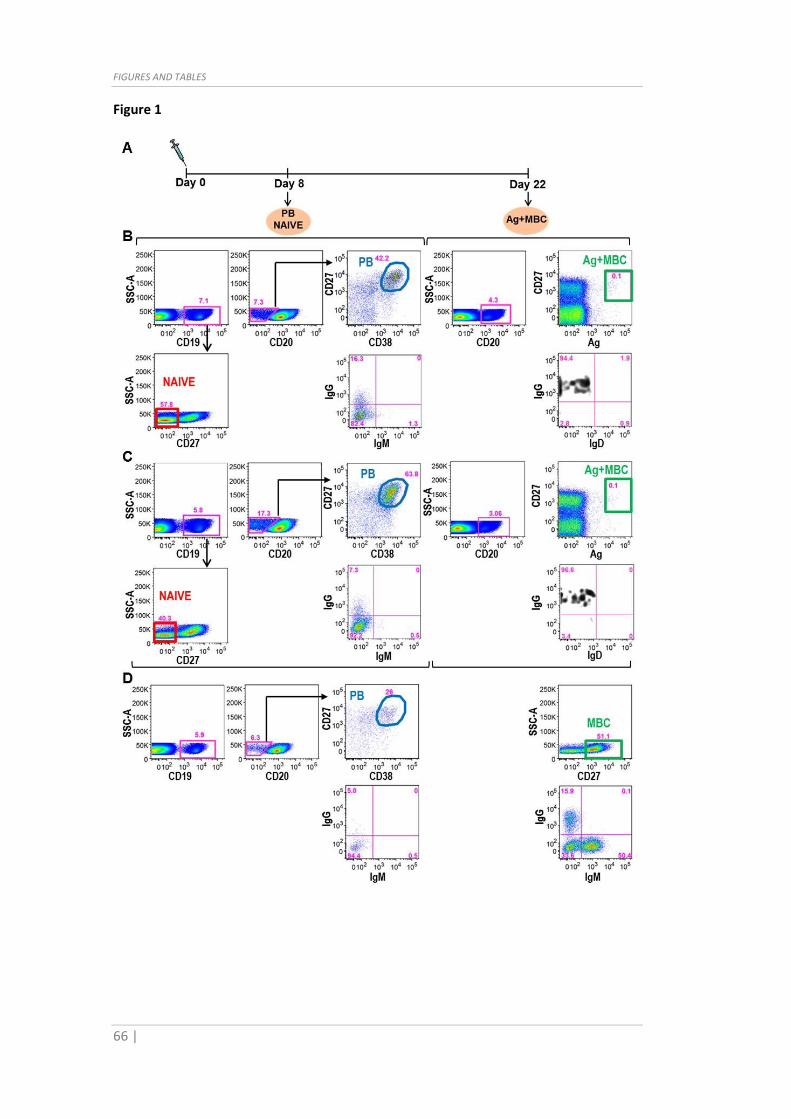
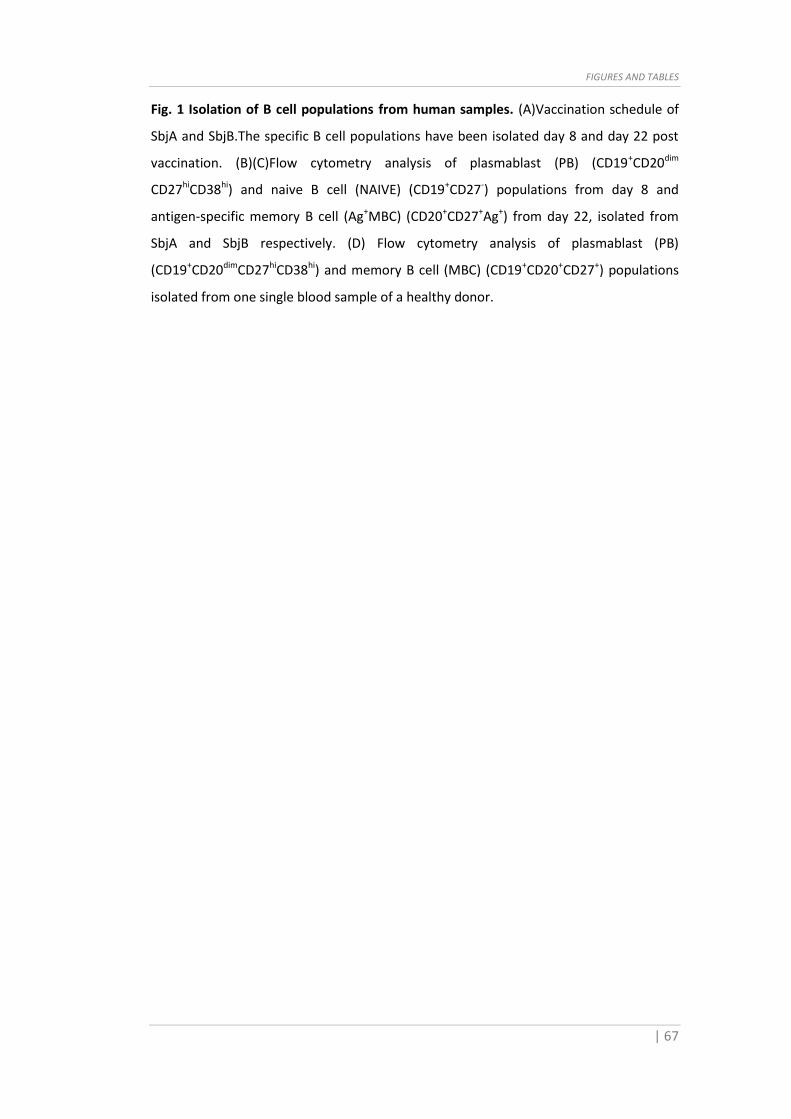
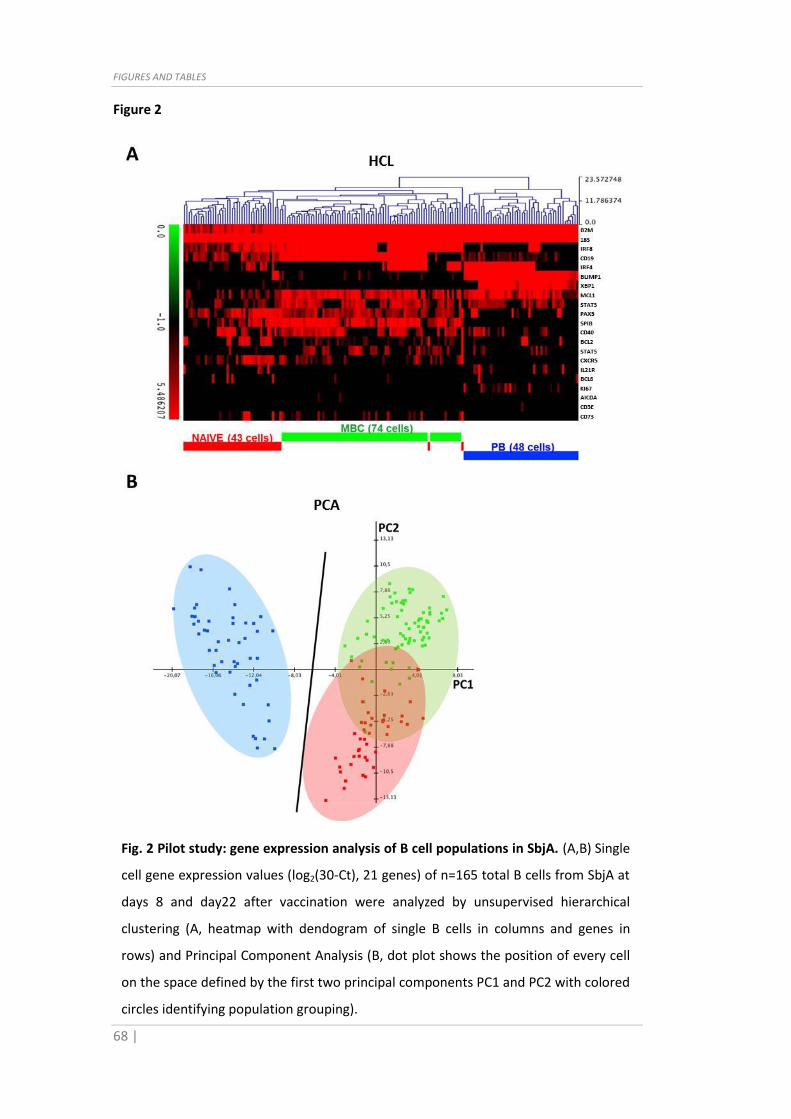
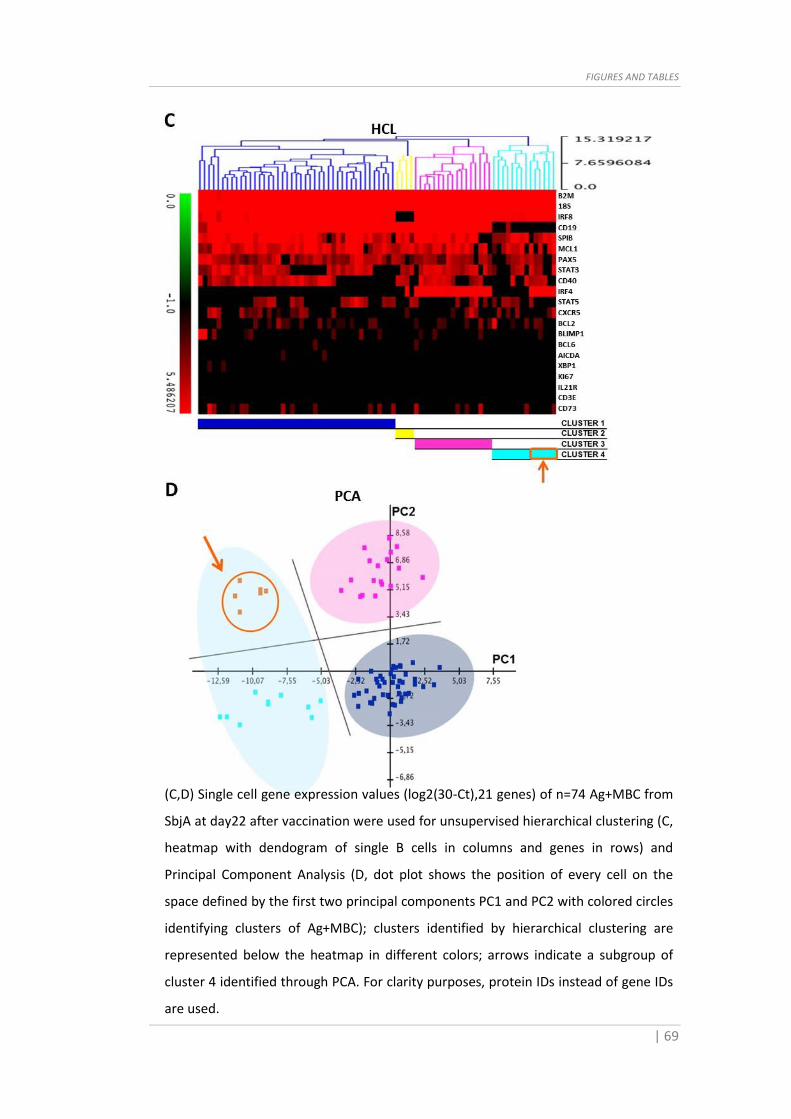
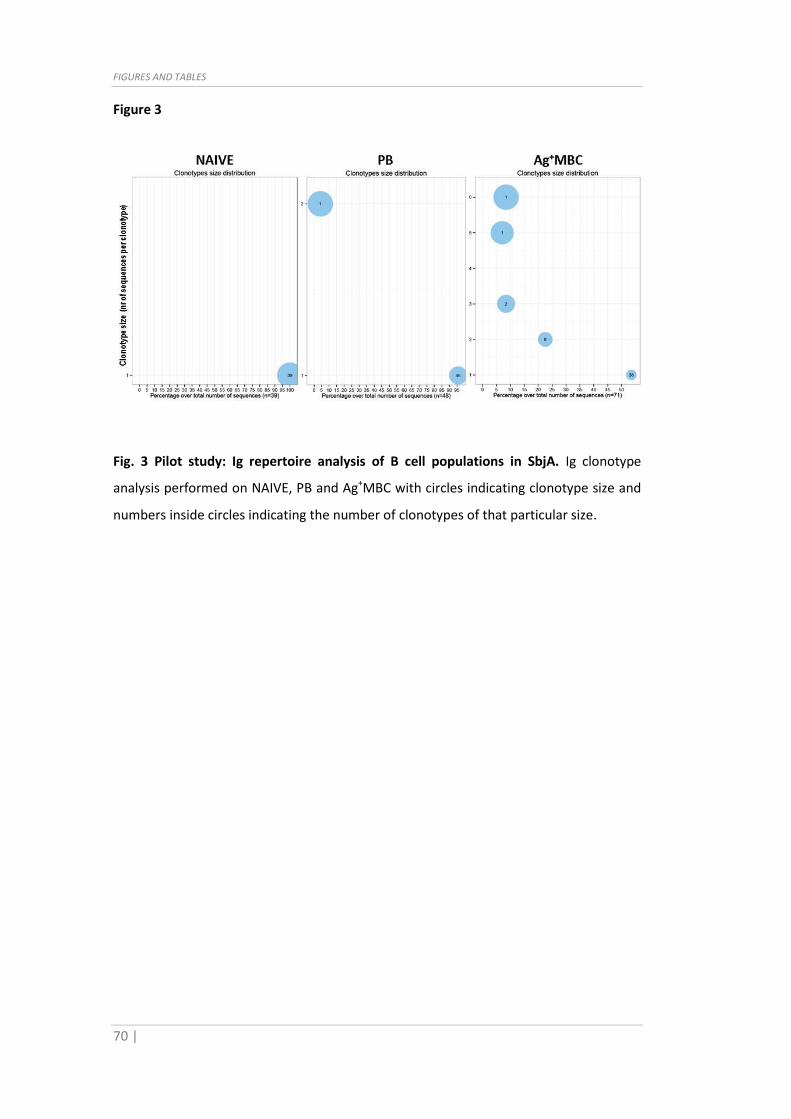

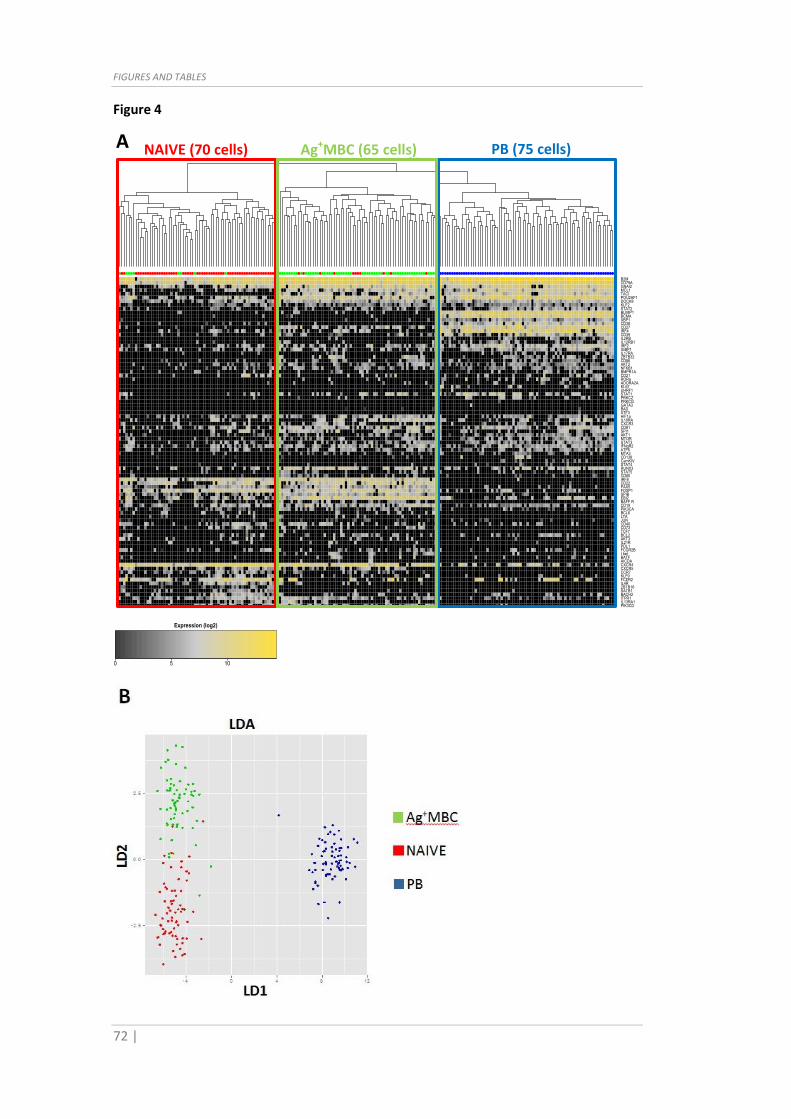
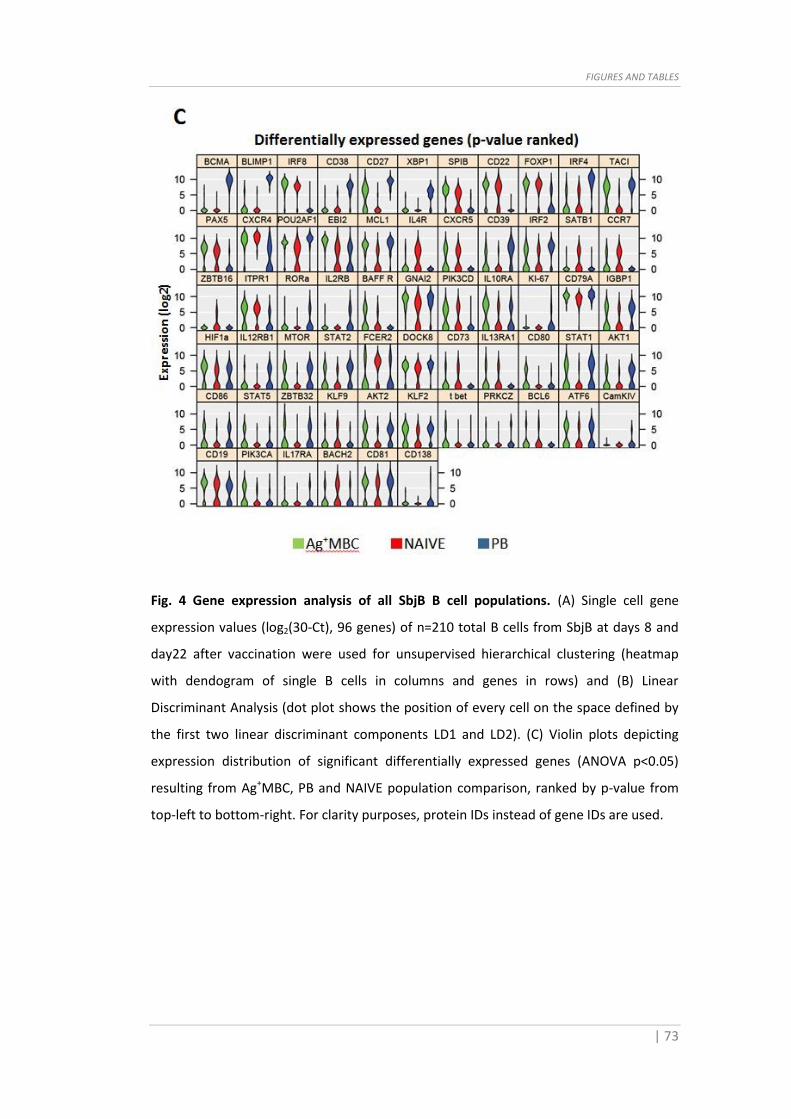
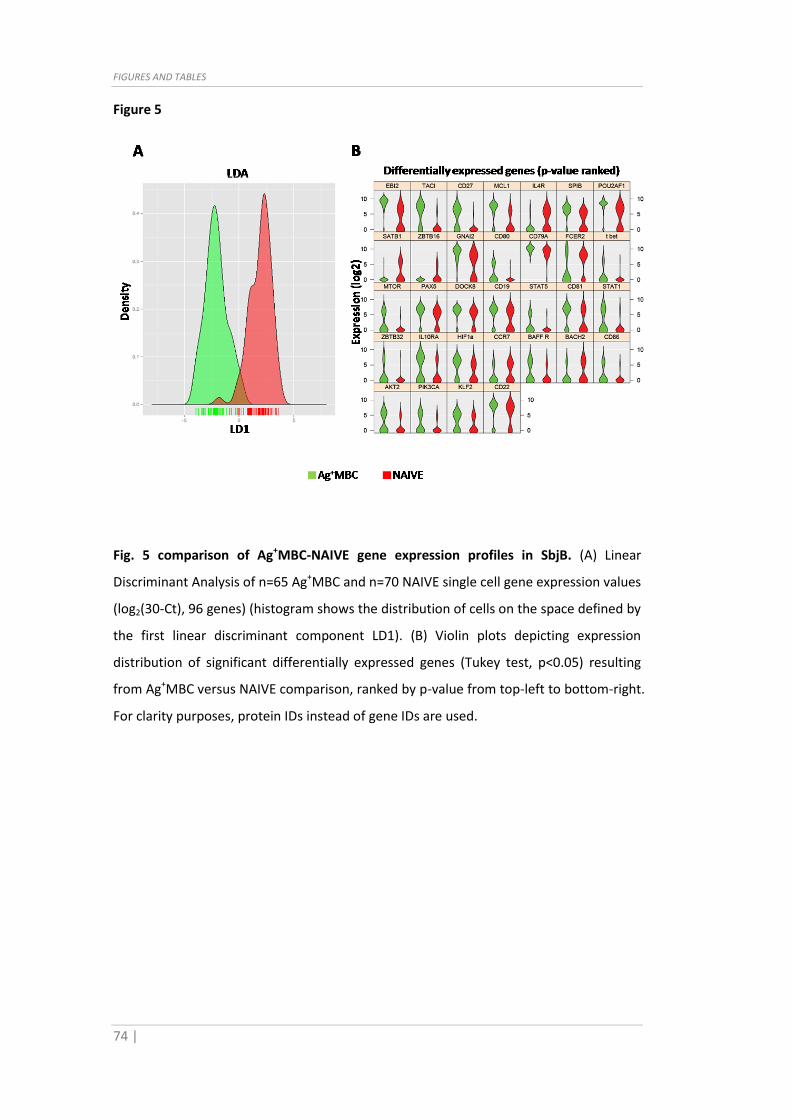
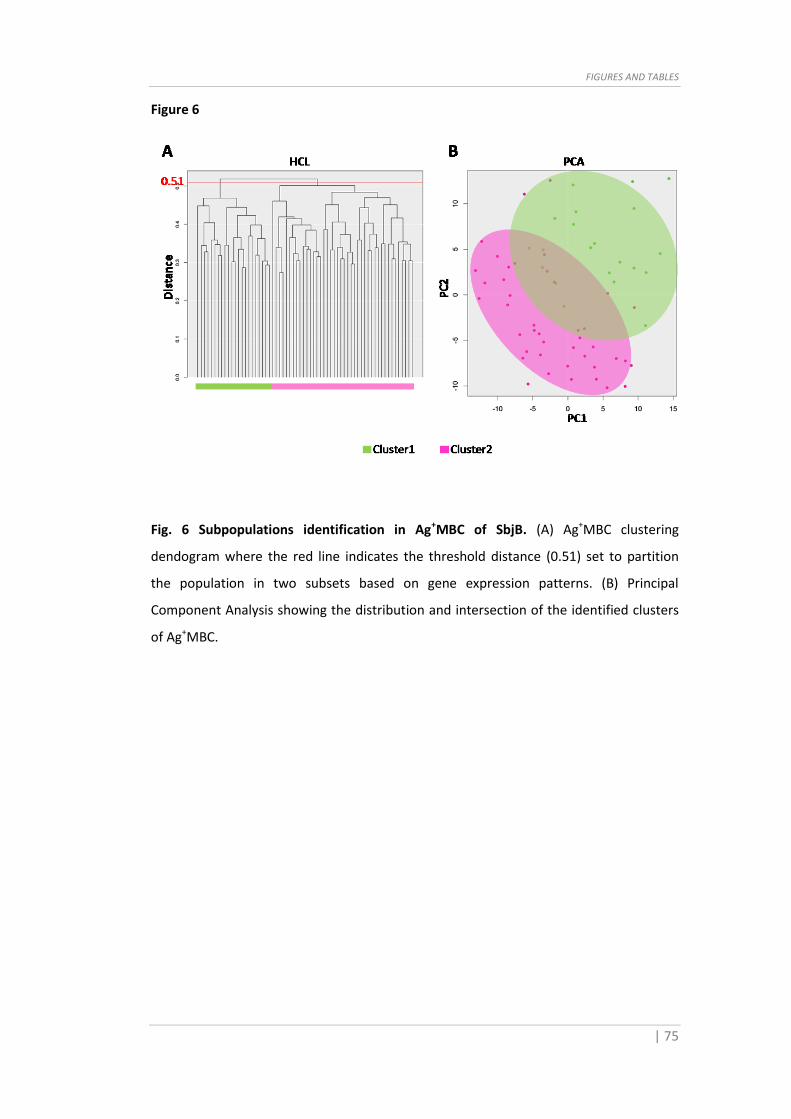
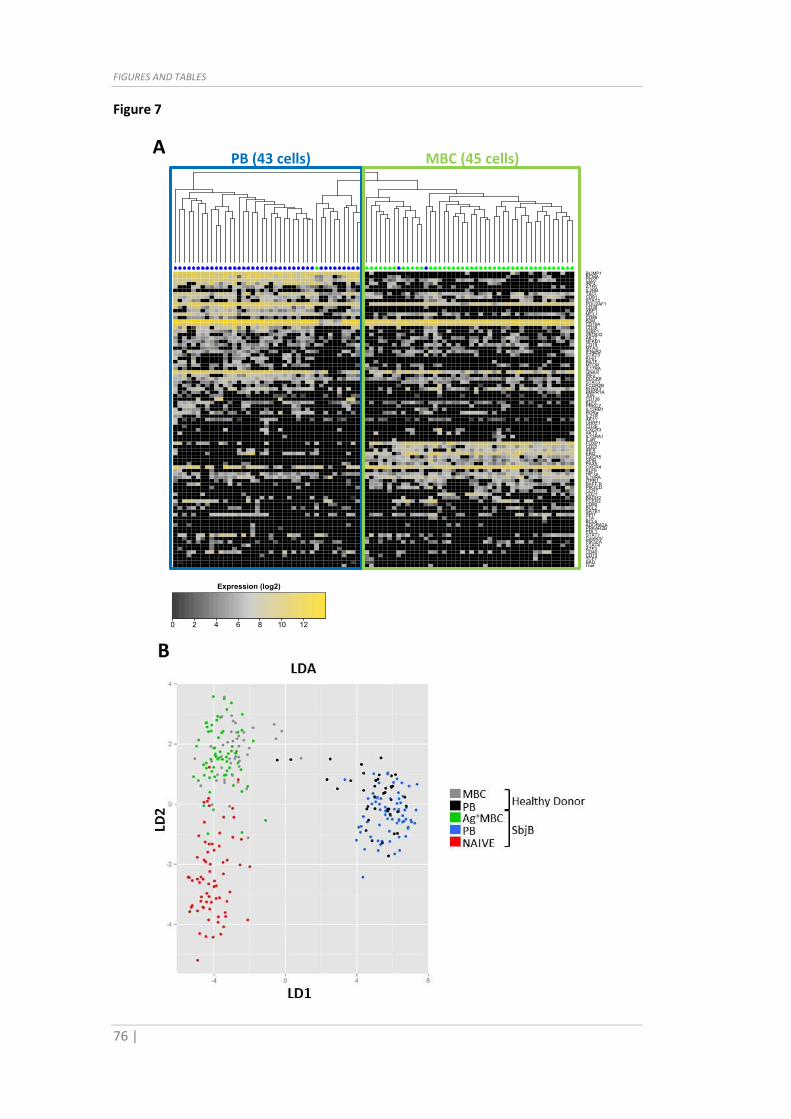
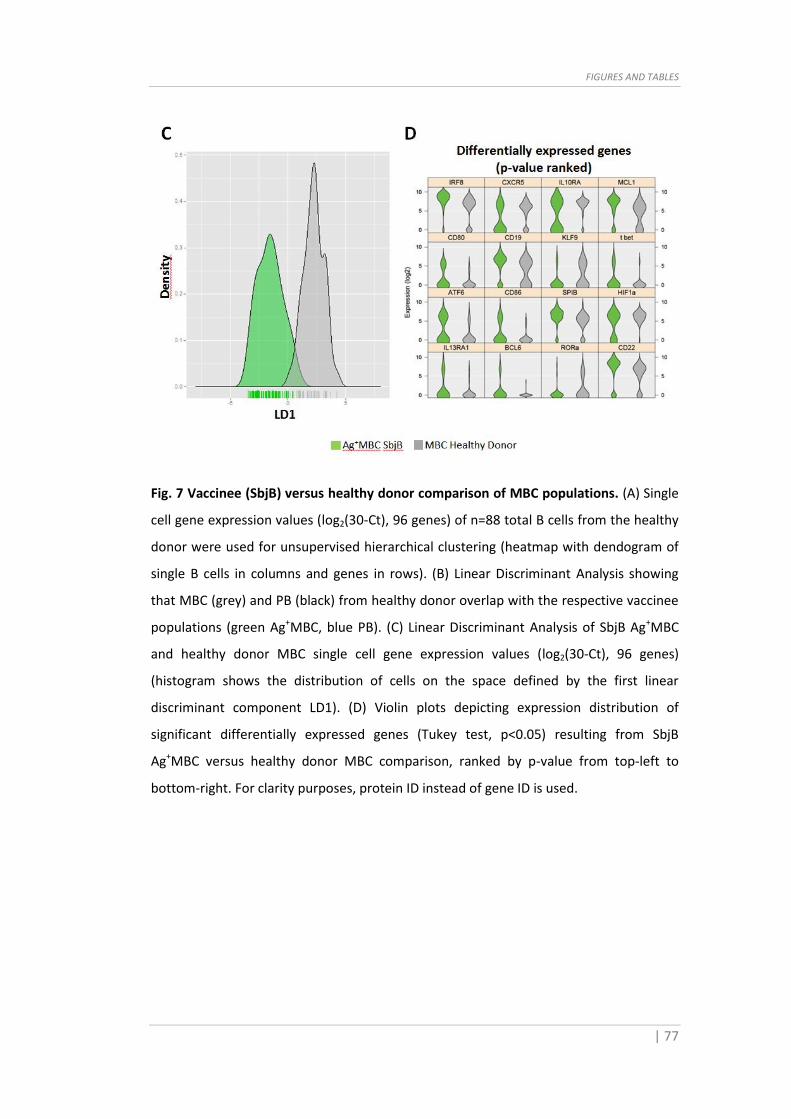
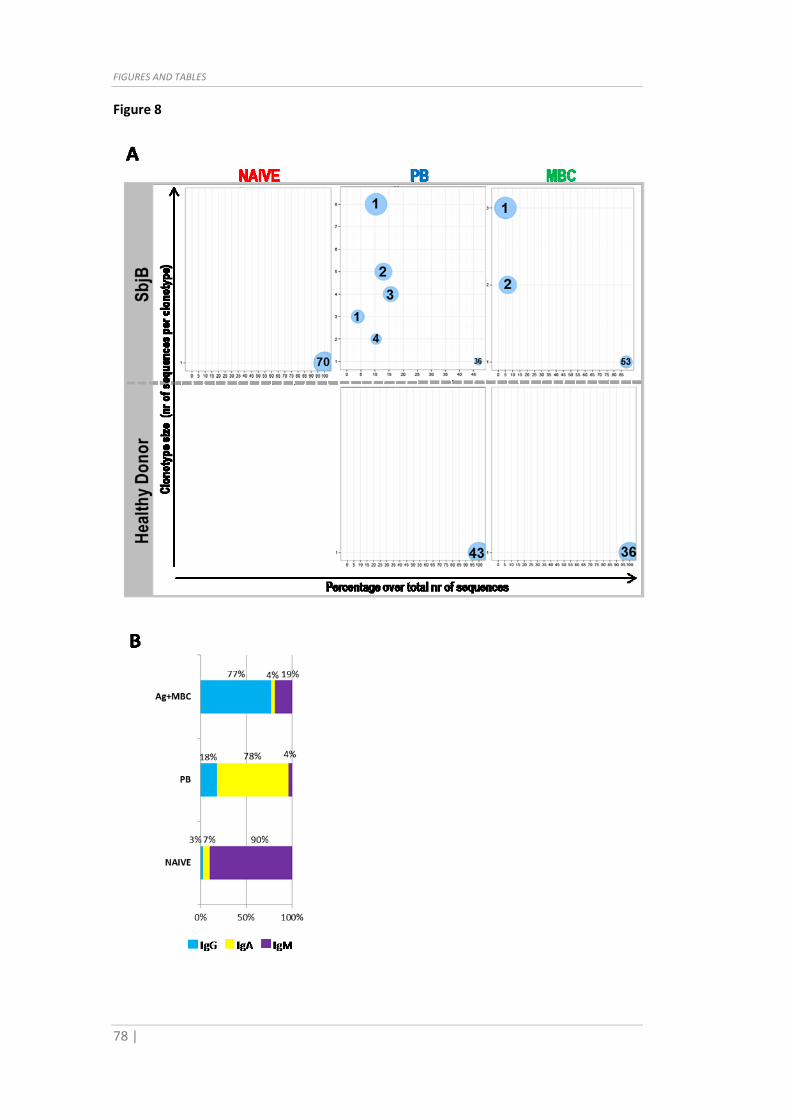
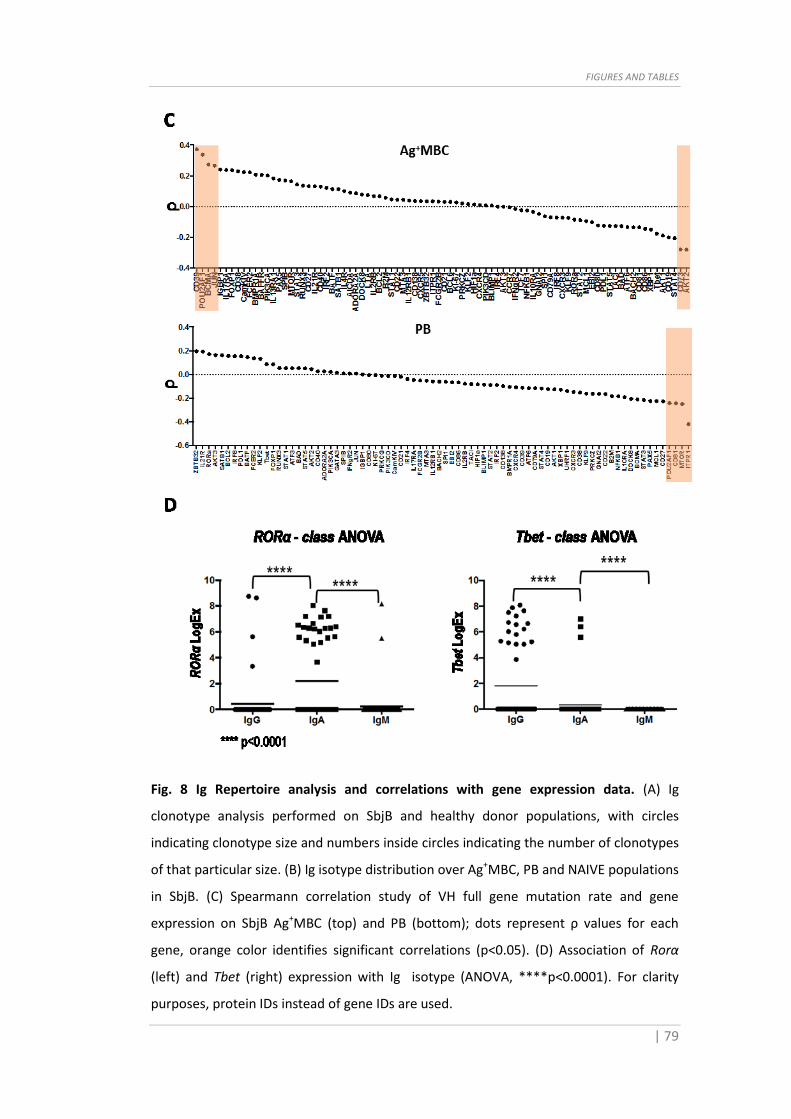
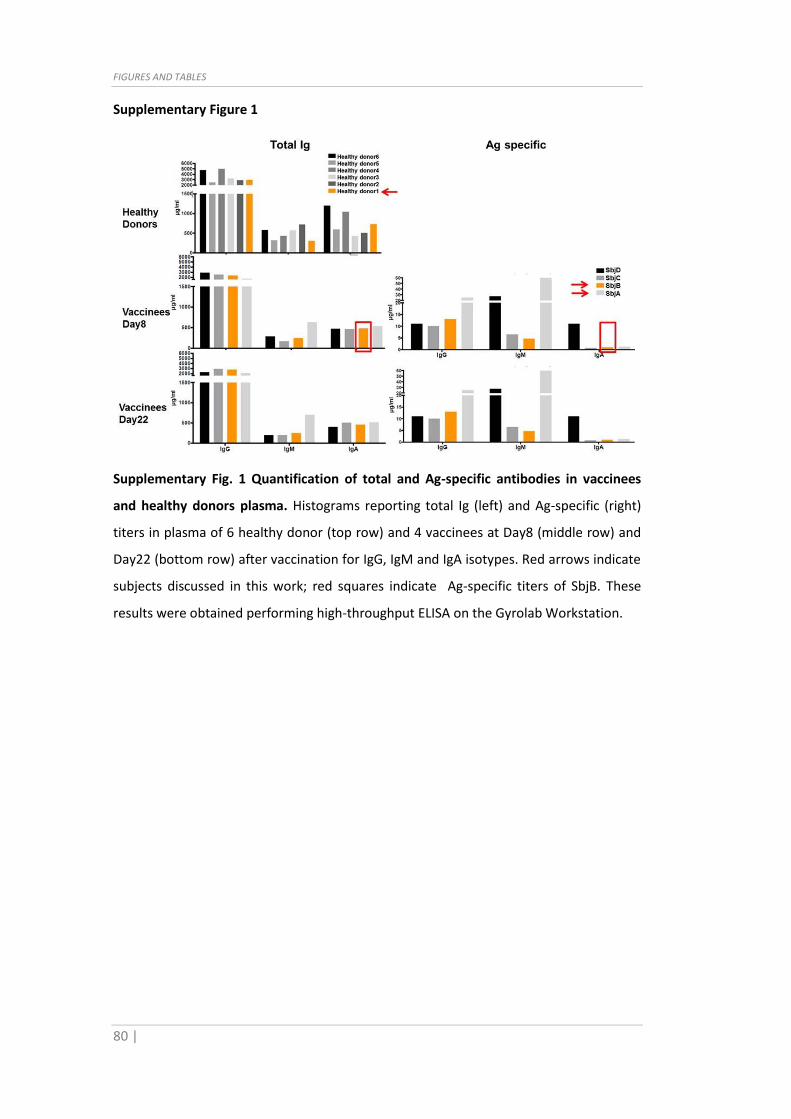

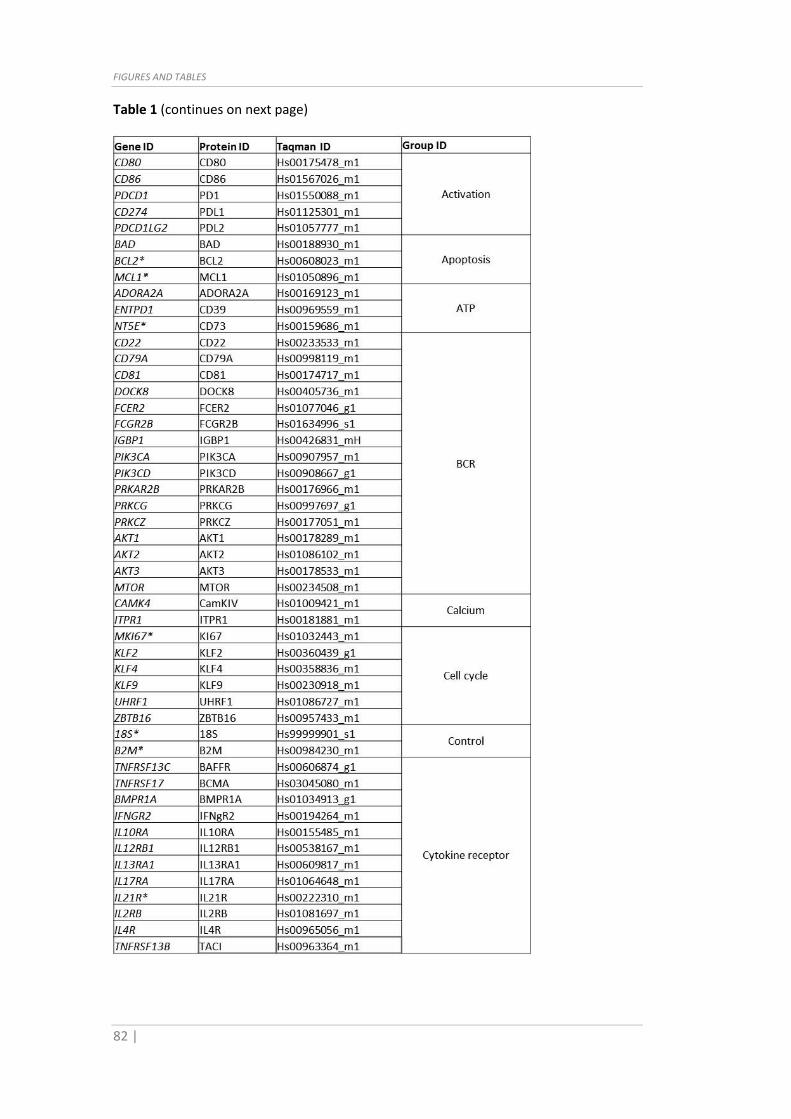
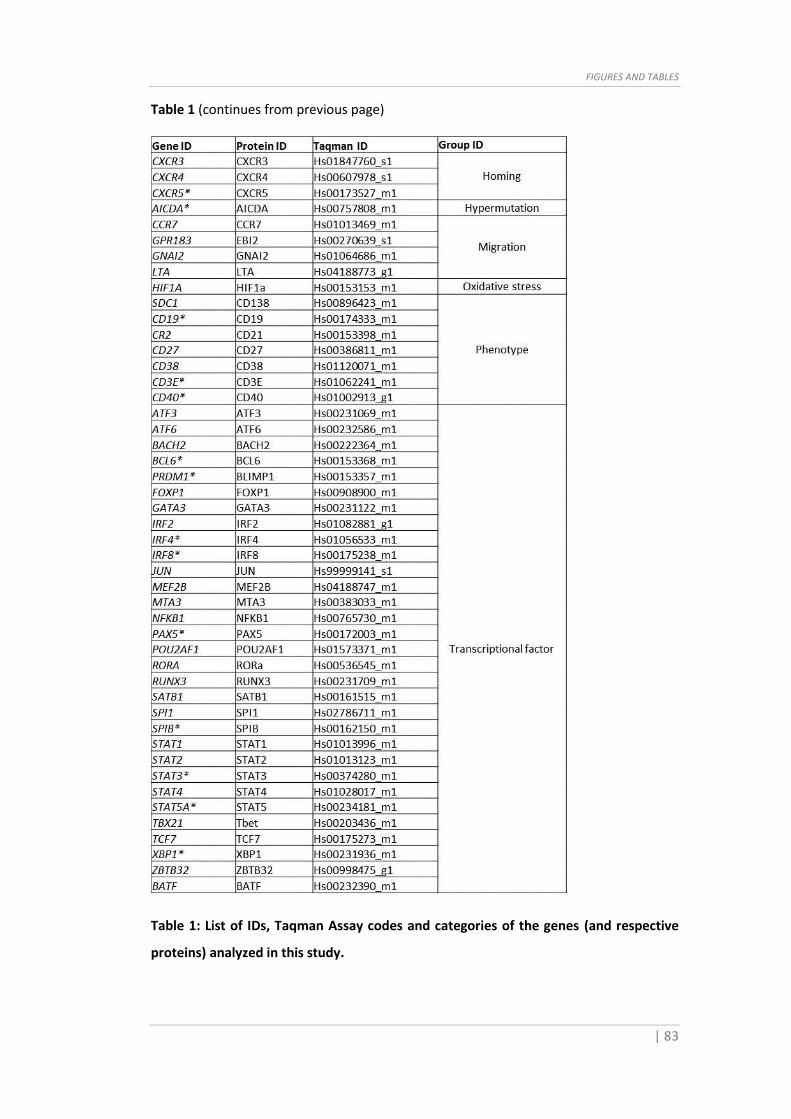
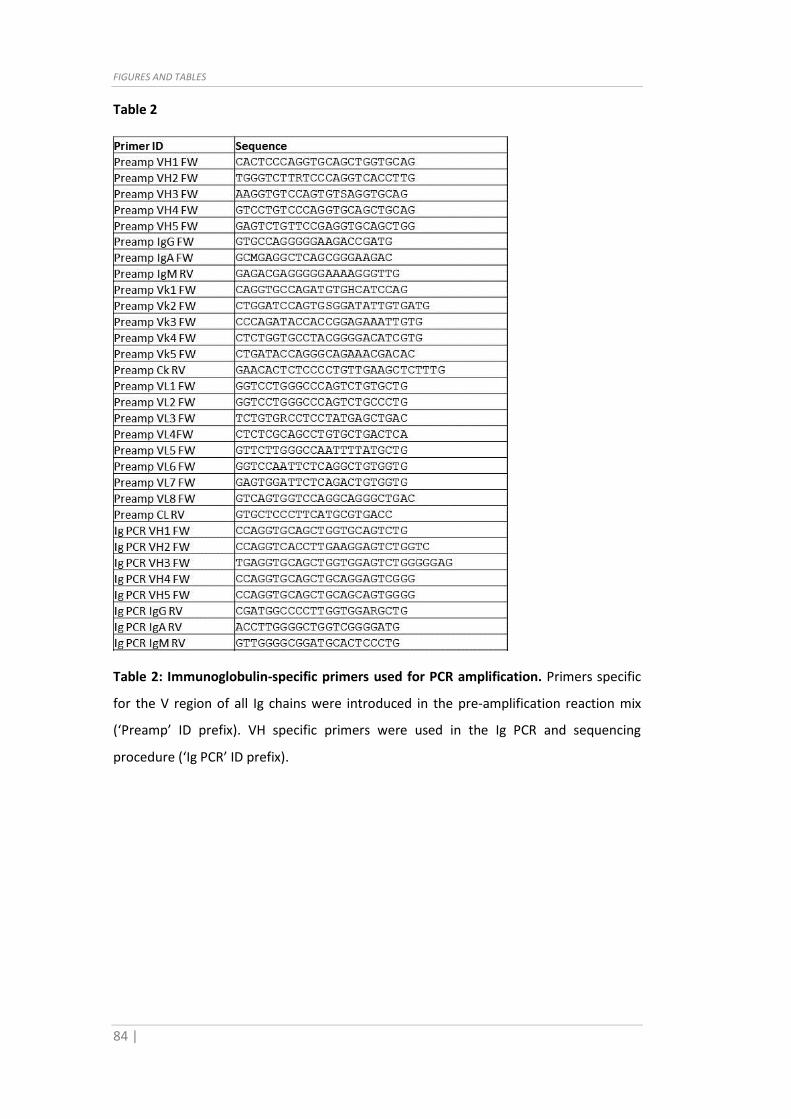


![8QLYHUVLWjGHJOL6WXGLGL1DSROL³)HGHULFR,,´ The bosons that arise from the extension of the electroweak interaction are called W0and Z0[27] in analogy to the ones of the SM. The principal](https://static.documenti.site/doc/80x56/60e92b507910cf4ccd72c1c9/8qlyhuvlwjghjol6wxglgl1dsrolhghulfr-the-bosons-that-arise-from-the-extension.jpg)


