1 Classis PMI Z I -Score Helping Italian SMEs to Fund their Success and Investors to Assess the Risk/Return Trade-off Crediamo nella supremazia della Conoscenza. Crediamo nelle forza delle Idee. Crediamo nell’Ispirazione. Dr. Edward I. Altman Dr. Gabriele Sabato Maurizio G. Esentato Milano, April 12, 2016
Transcript
1
Classis PMI ZI-Score
Helping Italian SMEs to Fund their Success and Investors to Assess the Risk/Return Trade-off
Crediamo nella supremazia della Conoscenza.
Crediamo nelle forza delle Idee.
Crediamo nell’Ispirazione.
Dr. Edward I. Altman Dr. Gabriele Sabato
Maurizio G. Esentato Milano, April 12, 2016
Evolution of Statistical Models for Predicting Financial Distress of Companies
1968 Creation of the Altman Z-Score model still used today as the most prominent
risk metric globally
1984 Creation of Risk Metrics and Returns for the U.S. High Yield (Junk Bond) market
1989 Adapting Credit Scoring models to provide an International Language of credit via
the Bond Rating Equivalent Method (BRE) and Probability of Default (PD) and
Loss Given Default (LGD)
1995 Development of a Credit Risk Model for Emerging Market Companies
1999 Introduction of Basel 2 and the universal use of credit scoring models for bank
counterparty risk
2005- Adaptation of credit scoring models for SMEs in U.S. and U.K.
2010 (See our “white paper” for relevant sources)
2016 Creation of the Classis PMI ZI-Score
2
Classis PMI ZI-Score: why and when it was conceived
2011 Formation of Classis Capital SIM SpA
& its founding members
June 2011 (FT article): Focus on Italy as critical to Euro Sovereign Debt Crisis.
The importance of Private Sector Growth
2014-2015 Conceptualisation of the role of the credit culture
for Italian SMEs & the Minibond Market.
Announcement of the launch of the venture
for the creation of the model (June 2014)
2015-Jan 2016 Development of the Classis PMI ZI-Score
The model is not probabilistic but descriptive-comparative. It should be used as a warning device rather than
as a definitive prediction tool since the score indicates the proximity of a firm to one group or the other
(Teodori, 1989).
The old "garbage in, garbage out" motto applies, however: if the company financials are misleading or
incorrect, the Z-Score will be, too.
Risk profile
• Debt capacity
• Cash flow strength
• Recovery profile
• Market outlook
3
25
Role of a Credit Culture in the
Italian Minibond market
- Greater understanding between borrowers and investors
- Create a Shadow Rating Model
Classis Approach for the Italian MinibondMarket
The importance of SMEs
• SMEs comprise a major share of economic activity in advanced economies. They account for over 95% of
enterprises, 60% of employment and over 50% of value added in the Private sector. In the EU, SMEs
have created 85% of net new jobs from 2002/2010.
•After the last financial crisis, being heavily reliant on traditional bank lending, the majority of SMEs were
faced with significant financing constraints in a deleveraging environment and with restricted credit
availability from banks. Despite recent central banks’ supportive stimulus, capital market bond financing
is increasingly attractive.
•Non-bank market-based financing increasingly appeared as an option to improve the flow of credit to
SMEs, while enhancing diversity and widening participation in the financial system.
• Since 2012, new channels have become increasingly important for SMEs to satisfy their funding needs.
Examples of these new sources of funding are crowdfunding, P2P lending, equity participation,
securitizations, and Mini-bonds. However, in Europe SME financing is still heavily reliant on bank lending.
4
After the last financial crisis, SMEs have been forced to consider new channels to finance their
growth due to the sharp decrease in bank lending.
SMEs Reliance on Bank Financing
5
After the last financial crisis, reliance on bank financing by SMEs has started to decrease. However,
European SMEs are still lagging behind US ones that are significantly less dependent on bank lending
Reliance on bank financing by SMEs (in%)
New Funding Opportunities: CROWDFUNDING
6
Crowdfunding has emerged as one of the strongest channels for SME financing
across Europe, but has achieved limited success in Italy so far.
Size of the US High-Yield Bond Market
7
1978 – 2014 (Mid-year US$ billions)
$-
$200
$400
$600
$800
$1,000
$1,200
$1,400
$1,600
19
78
19
79
19
80
19
81
19
82
19
83
19
84
19
85
19
86
19
87
19
88
19
89
19
90
19
91
19
92
19
93
19
94
19
95
19
96
19
97
19
98
19
99
20
00
20
01
20
02
20
03
20
04
20
05
20
06
20
07
20
08
20
09
20
10
20
11
20
12
20
13
20
14
$ B
illio
ns
Size of Western European HY Market (€ Billions)
8
2 5 9 12 21 30 36 37 4827 22 18 20 15 23 30 40 51
7693
116
615
25 3341
57 59 61 60 61 58
78
114
143
207
277
295
0
50
100
150
200
250
300
350
400
Ma
rke
t Siz
e €
Billio
ns
$US Mkt Size Non-$US Mkt Size
1
5.4 8.8 13.627.0
45.361.1
69.6
88.984.2 81.4
79.0 80.1 76.6 81.3
108.4
154.4
193.7
282.8
370.1
1.7
410.8
Includes non-investment grade straight corporate debt of issuers with assets located in or revenues derived from Western Europe, or the bond is denominated in a Western European currency. Floating-rate and convertible bonds and preferred stock are not included.
Source: Credit Suisse
The Italian Mini-bond Market
9
We believe “Mini-bonds” can be a success in Italy as long as the market supplies an attractive
risk/return tradeoff to investors as well as affordable and flexible financing for borrowers.
• Europe High-yield bond market is still lagging
behind the US one, but the growth has
accelerated in the last 3 years.
• In Italy, the market for SME bonds is known as
ExtraMOT PRO “Mini-bond” market.
• The new segment of the Extra-MOT market
dedicated to listing of bonds, commercial paper,
and project finance bonds started in February
2013.
• The total amount of listed issuances since
February 2013 is 160, for a total issued amount
of about Euro 6,146bn. As of March 2016, there
is Euro 4.491bn outstanding, from 130 issues.
• In Q1 2016, 17 new issues have been launched.
What are the constraints to the success of the Italian ExtraMOT PRO Mini-bond market?
All bonds face three main risks (Market, Liquidity and Credit), but it is credit risk that is perhaps most
critical for relatively unknown, smaller enterprises.
The information asymmetries generated by the uncertainty around the riskiness of SMEs are holding back
investors concerned about the real quality of the underlying assets.
On the other side, SMEs are discouraged from going directly to the market by the often inefficient pricing
and the complexity of the bond issuing process.
Similar concerns apply to all new sources of direct funding for SMEs.
Since the ExtraMOT PRO market is still quite young, there are not as yet aggregate default and recovery
statistics. We prefer, therefore, to concentrate on issuer default & return analytics based on Italian SME
experience.
Classis PMI ZI-Score model will help Italian SMEs to grow and succeed by assessing
their risk profile and suggesting what would be the best funding option for them
10
Classis PMI ZI-Score model will help portfolio managers to assess the risk-return trade
offs in investing in either individual or portfolios of Italian SME mini-bonds
Classis PMI ZI-Score: Summary of Results
• We segmented the Italian SMEs by industrial sectors and developed four default prediction models for
Manufacturing, Services, Retail and Real Estate firms.
• Models have been developed on a representative sample of more the 14.500 SMEs located in the north of
Italy and then certified for their relevance at national level.
• Prediction power of the models, measured both in terms of Type I and II errors and accuracy ratios, varies by
sector, but it is significantly high due to the innovative variables and the techniques applied.
• In addition to the score, firms/analysts/investors will also receive an estimated Bond Rating Equivalent and
Probability of Default that will allow them to compare the credit worthiness of SMEs to the rest of the
market.
• The Classis PMI ZI-Score is a powerful tool that will improve the matching of demand and supply on the
capital markets between SMEs looking for funding options and investors seeking investment opportunities.
11
The Dataset
• Initially, financial data of 15,362 active and 1,000 non-active companies were extracted from AIDA
(BvD) covering the years 2004 to 2014 (1).
• Few companies (1,852) had to be dropped due to missing financial information.
• The shape and size of the final development sample is reported below
12
(1): We thank ASSOLOMBARDA for supporting this research by providing Italian SMEs data
Number Percentage
Non - defaulted firms 13,990 96.4 . %
Defaulted firms 520 3.6 . %
Total 1 4 ,510 100%
Italian SMEs Profile
50454035302520151050
1800
1600
1400
1200
1000
800
600
400
200
0
Sales (€m)
Freq
uen
cy
Sales
1009080706050403020100
2500
2000
1500
1000
500
0
Total Assets (€m)
Freq
uen
cy
Total Assets
<15
16-25
26-50
51-100
Category51-100
2,6%26-50
7,6%
16-25
12,1%
<15
77,7%
Total Assets (€m)
<15
16-30
31-50
Category31-50
5,8%
16-30
17,5%
<15
76,7%
Sales (€m)
13
Italian SMEs Profile
<50
51-100
101-200
>200
Category>200
0,8%101-200
5,8%
51-100
15,4%
<50
78,0%
Number of employees
24521017514010570350
1800
1600
1400
1200
1000
800
600
400
200
0
Number of employees
Freq
uen
cy
Number of employees
14
Sector Analysis
Agriculture Construction & RE Financial services Manufacturing Mining PA Retail Services Total
• Consistent with a large number of studies, we choose five accounting ratio categories describing the main aspects of a company’s financial profile: liquidity, profitability, leverage, coverage and activity.
• For each one of these categories, we create a number of financial ratios identified in the literature as being most successful in predicting firms’ bankruptcy and transform them in highly predictive variables
• Next, we apply a statistical forward stepwise selection procedure to the selected variables and estimate the full model for each of the four sectors eliminating the least helpful covariates, one by one, until all the remaining input variables are efficient, i.e. their significance level is above the chosen critical level.
16
The Results
Type I error rate
Type II error rate
1- Average Error Rate
Accuracy ratio
Manufacturing Model 6.92%
(8.23%) 26.57%
(27.64%) 83.26%
(82.07%) 93.08%
(92.21%)
Retail Model 16.77%
(18.54%) 27.78%
(28.89%) 77.73%
(76.29%) 83.23%
(81.76%)
Services Model 12.05%
(14.88%) 24.54%
(26.43%) 81.70%
(79.35%) 87.94%
(84.12%)
Constructions and Real Estate
8.89% (10.12%)
26.02% (28.24%)
82.55% (80.82%)
91.11% (89.86%)
17
18
In order to provide additional measures of credit worthiness, we introduce the concept of Bond Rating
Equivalents (BRE) and Probabilities of Default (PD). Our benchmarks for determining these two critical variables
are comparisons to the financial profiles of thousands of companies rated by one of the major international
rating agencies (Standard & Poor’s) and the incidence of default given a certain bond rating when the bond was
first issued. The latter is based on updated data from E. Altman’s Mortality Rate Approach (Altman, Journal of
Finance, 1989). The actual process is a three-step approach:
The Bond Rating Equivalent
1. Build a credible and accurate credit scoring
model.
2. Assign BREs to each firm based on its proximity
to the Average Scores of the relevant bond
ratings of constituent firms, as assigned by S&P
(for each of the four sector models).
3. For mini-bonds issued in the last two years,
utilize the most recent updated marginal and
cumulative Mortality Rate Matrix of actual
Default Frequencies given the history of new
issue defaults by original bond rating over the
extended period 1971-2015. For more
seasoned issues, use the standard cumulative
default rate matrices from the rating agencies.
Source: Altman & Kuehne, NYU Salomon Centre, 2016
19
Mortality Rates by Original Rating
All Rated Corporate Bonds*
1971 - 2015
Years after Issuance
*Rated by S&P at Issuance
Based on 2,903 defaulted issues
Source: Standard & Poor’s (New York) and Author’s Compilation
1 2 3 4 5 6 7 8 9 10
AAA Ma r g i n a l 0.00% 0.00% 0.00% 0.00% 0.01% 0.02% 0.01% 0.00% 0.00% 0.00%
C u m u l a ti v e 0.00% 0.00% 0.00% 0.00% 0.01% 0.03% 0.04% 0.04% 0.04% 0.04%
AA Ma r g i n a l 0.00% 0.00% 0.21% 0.07% 0.02% 0.01% 0.01% 0.01% 0.02% 0.01%
C u m u l a ti v e 0.00% 0.00% 0.21% 0.28% 0.30% 0.31% 0.32% 0.33% 0.35% 0.36%
A Ma r g i n a l 0.01% 0.03% 0.12% 0.13% 0.10% 0.06% 0.02% 0.25% 0.08% 0.05%
C u m u l a ti v e 0.01% 0.04% 0.16% 0.29% 0.39% 0.45% 0.47% 0.72% 0.80% 0.85%
BBB Ma r g i n a l 0.33% 2.36% 1.26% 1.00% 0.50% 0.22% 0.26% 0.15% 0.15% 0.34%
C u m u l a ti v e 0.33% 2.68% 3.91% 4.87% 5.34% 5.55% 5.80% 5.94% 6.08% 6.40%
BB Ma r g i n a l 0.94% 2.02% 3.88% 1.97% 2.34% 1.51% 1.45% 1.12% 1.43% 3.13%
C u m u l a ti v e 0.94% 2.94% 6.71% 8.54% 10.68% 12.03% 13.31% 14.28% 15.51% 18.15%
B Ma r g i n a l 2.85% 7.72% 7.85% 7.80% 5.70% 4.48% 3.58% 2.08% 1.76% 0.77%
C u m u l a ti v e 2.85% 10.35% 17.39% 23.83% 28.17% 31.39% 33.85% 35.22% 36.36% 36.85%
CCC Ma r g i n a l 8.13% 12.43% 17.89% 16.32% 4.85% 11 . 6 5 % 5.44% 4.84% 0.66% 4.28%
C u m u l a ti v e 8.13% 19.55% 33.94% 44.72% 47.40% 53.53% 56.06% 58.19% 58.46% 60.24%
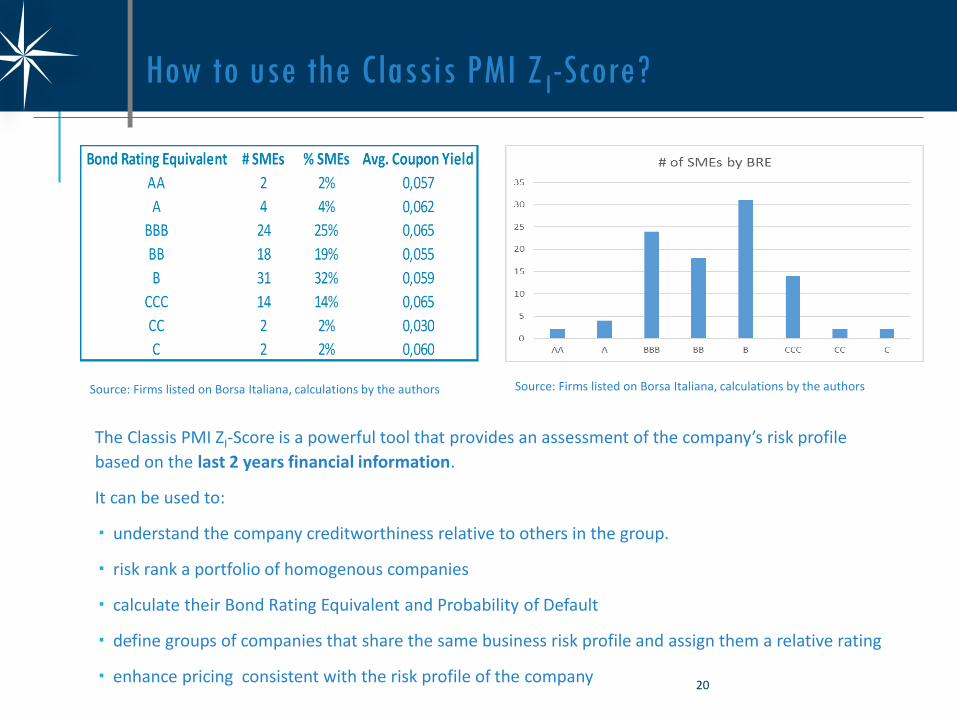
How to use the Classis PMI Z I-Score?
The Classis PMI ZI-Score is a powerful tool that provides an assessment of the company’s risk profile
based on the last 2 years financial information.
It can be used to:
understand the company creditworthiness relative to others in the group.
risk rank a portfolio of homogenous companies
calculate their Bond Rating Equivalent and Probability of Default
define groups of companies that share the same business risk profile and assign them a relative rating
enhance pricing consistent with the risk profile of the company 20
Source: Firms listed on Borsa Italiana, calculations by the authors Source: Firms listed on Borsa Italiana, calculations by the authors
Classis PMI ZI-Score Takeaways
The Classis PMI ZI-Score is not a RATING –It is not supported by a
thorough due diligence on the company, by a strict regulation in terms of
transparency, procedures and market communication: but it is critical in
today’s regulatory and analytical environment, providing a robust,
objective, and independent indication of counterparty credit risk.
Some defaults in the ExtraMOT PRO (Minibond Market) are natural,
expected and acceptable in a Portfolio context.
21
Helping Italian SMEs to succeed
We are building a web-based platform to help SME’s understanding better their risk profile and selecting the
most appropriate source of funding.
The Classis PMI ZI-Score will be one of the tools we will use together with other models to assess SME’s:
• Risk profile
• Debt capacity
• Cash flow strength
• Recovery profile
• Market outlook
These elements will help to fill the gap between SMEs and several types of lenders by equipping them with
the right tools and knowledge to have informed discussions about funding and pricing options.
We plan to deploy this platform in several countries across Europe, but Italy will be our first application.
22
Disclaimer This document is provided for informational purposes only and is not intended as investment advice or as an offer or solicitation for the purchase or sale of any financial instrument. The authors make no express or implied warranties relating to the information, provided herein or as to the consequences to the recipient from any use whatsoever of this document of the information provided herein. The authors will not be liable in any way for inaccuracies, errors in, or omissions of, or in the transmission of, any use of, information provided in this document, or for any damages arising there from. The information contained herein regarding prices and statistical data, if any, has been obtained from sources which we believe to be reliable but in no way are warranted by us to accuracy or completeness. Copyright, all rights reserved.
23
Classis Capital SIM S.p.A V. Vittor Pisani, 19
20124 Milano
www.classiscapital.it
24
Classis (classem, classì, classis) is the Latin noun for Fleet. The Classis is known as the naval fleet of the navy of ancient Rome. Its purpose was to control waters around the Roman provinces. Its job consisted mainly of providing logistics of personnel and support, while keeping communication routes open.