3 I dati adjusted del 2011 non tengono conto della plusvalenza legata all’acquisto della quota del 40% in Multiopticas Internacional nel 2009, pari a circa 19 milioni di euro, dei costi non ricorrenti legati alle iniziative per le celebrazioni del 50esimo anniversario di Luxottica, pari a 12 milioni di euro, nonché dei costi di ristrutturazione all’interno della Divisione Retail pari a circa 11 milioni di euro e di quelli legati alla riorganizzazione di OPSM pari a circa 9,5 milioni. I dati adjusted del 2010 non tenevano conto: a) di una posta non ricorrente di circa 20 milioni di euro legata all’impairment di alcuni asset in Australia; b) del rilascio nel 2010 di un accantonamento fiscale di circa 20 milioni di euro legato alla cessione della catena retail Things Remembered avvenuta nel settembre 2006. Comunicato stampa Luxottica aumenta il dividendo dell’11,4% (0,49 euro per azione) Molto positivo l’avvio del 2012: nei primi due mesi dell’anno fatturato in crescita a doppia cifra Milano, 28 febbraio 2012 – Il Consiglio di Amministrazione di Luxottica Group S.p.A. (MTA: LUX; NYSE: LUX), leader nel design, produzione, distribuzione e vendita di occhiali di fascia alta, di lusso e sportivi, riunitosi oggi, ha approvato il progetto di bilancio di esercizio 2011 e il bilancio consolidato redatto secondo i principi contabili IAS/IFRS. Esercizio 2011 1 (milioni di euro) FY11 FY10 Variazione Fatturato 6.222,5 5.798,0 +7,3% (+9,9% a parità di cambi 2 ) Utile operativo 807,1 712,2 +13,3% Adjusted 3,4 820,9 732,6 +12,0% Utile netto attribuibile al Gruppo 452,3 402,2 +12,5% Adjusted 3,4 455,6 402,7 +13,1% Utile per azione 0,98 0,88 +12,0% Adjusted 3,4 0,99 0,88 +12,7% In US$ adjusted 3,4 1,38 1,16 +18,4% Quarto trimestre 2011 1 (milioni di euro) Q411 Q410 Variazione Fatturato 1.509,0 1.346,5 +12,1% (+11,2% a parità di cambi 2 ) Utile operativo 128,4 96,1 +33,5% Adjusted 3,4 139,3 116,6 +19,5% Utile netto attribuibile al Gruppo 64,4 55,1 +16,8% Adjusted 3,4 72,7 55,6 +30,8% Utile per azione 0,14 0,08 +82,0% Adjusted 3,4 0,16 0,12 +30,2% In US$ adjusted 3,4 0,21 0,16 +29,2%
Transcript
3 I dati adjusted del 2011 non tengono conto della plusvalenza legata all’acquisto della quota del 40% in Multiopticas Internacional
nel 2009, pari a circa 19 milioni di euro, dei costi non ricorrenti legati alle iniziative per le celebrazioni del 50esimo anniversario di
Luxottica, pari a 12 milioni di euro, nonché dei costi di ristrutturazione all’interno della Divisione Retail pari a circa 11 milioni di
euro e di quelli legati alla riorganizzazione di OPSM pari a circa 9,5 milioni. I dati adjusted del 2010 non tenevano conto: a) di una
posta non ricorrente di circa 20 milioni di euro legata all’impairment di alcuni asset in Australia; b) del rilascio nel 2010 di un
accantonamento fiscale di circa 20 milioni di euro legato alla cessione della catena retail Things Remembered avvenuta nel
settembre 2006.
Comunicato stampa
Luxottica aumenta il dividendo dell’11,4% (0,49 euro per azione)
Molto positivo l’avvio del 2012: nei primi due mesi dell’anno fatturato in crescita a doppia cifra
Milano, 28 febbraio 2012 – Il Consiglio di Amministrazione di Luxottica Group S.p.A. (MTA: LUX;
NYSE: LUX), leader nel design, produzione, distribuzione e vendita di occhiali di fascia alta, di
lusso e sportivi, riunitosi oggi, ha approvato il progetto di bilancio di esercizio 2011 e il bilancio
consolidato redatto secondo i principi contabili IAS/IFRS.
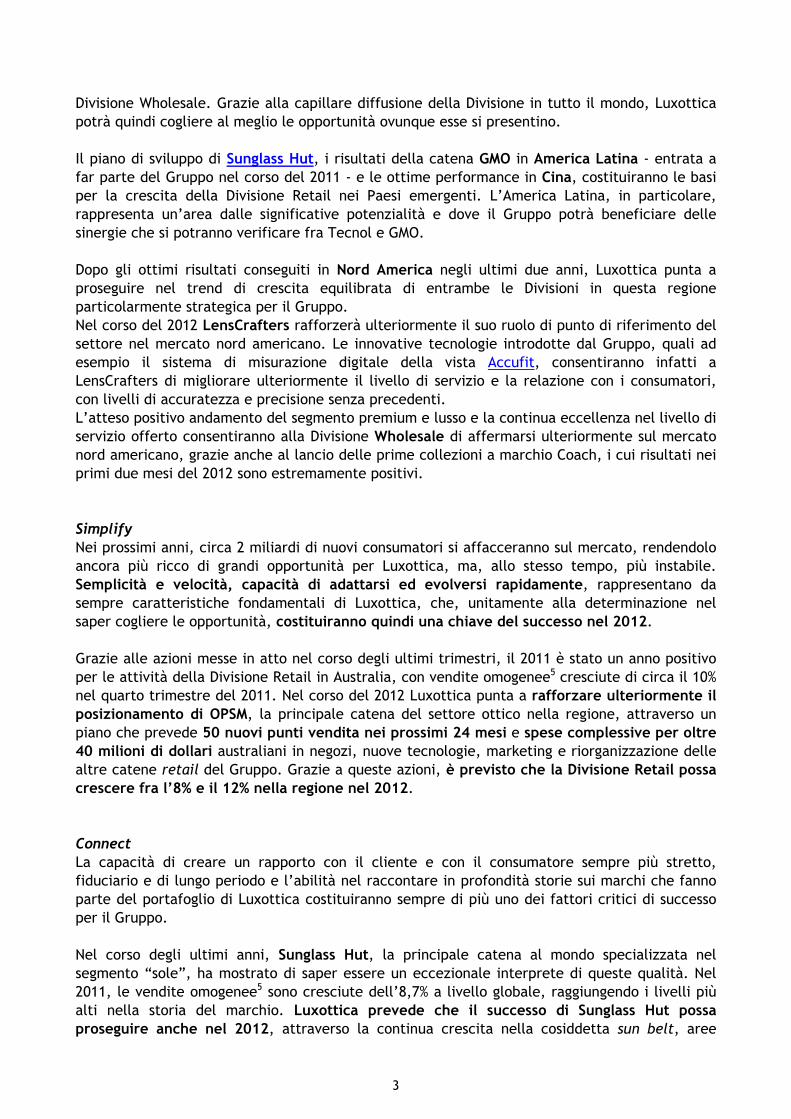
Esercizio 20111
(milioni di euro) FY11
FY10 Variazione
Fatturato 6.222,5 5.798,0 +7,3% (+9,9% a parità di cambi2)
Utile operativo 807,1 712,2 +13,3%
Adjusted3,4 820,9 732,6 +12,0%
Utile netto attribuibile al Gruppo 452,3 402,2 +12,5%
Adjusted3,4 455,6 402,7 +13,1%
Utile per azione 0,98 0,88 +12,0%
Adjusted3,4 0,99 0,88 +12,7%
In US$ adjusted3,4 1,38 1,16 +18,4%
Quarto trimestre 20111
(milioni di euro) Q411
Q410 Variazione
Fatturato 1.509,0 1.346,5 +12,1% (+11,2% a parità di cambi2)
Utile operativo 128,4 96,1 +33,5%
Adjusted3,4 139,3 116,6 +19,5%
Utile netto attribuibile al Gruppo 64,4 55,1 +16,8%
Adjusted3,4 72,7 55,6 +30,8%
Utile per azione 0,14 0,08 +82,0%
Adjusted3,4 0,16 0,12 +30,2% In US$ adjusted3,4 0,21 0,16 +29,2%
2
Nel corso del 2011 è proseguito il trend di crescita di Luxottica, con il fatturato che ha raggiunto
il livello più alto della storia del Gruppo e un miglioramento più che proporzionale della
redditività. Entrambe le Divisioni hanno contribuito in maniera significativa a questi risultati,
grazie a un lavoro eccezionale in tutte le aree geografiche in cui il Gruppo opera.
“I risultati conseguiti nel 2011, frutto del grande impegno di tutto il Gruppo, di una attenta pianificazione e di una esecuzione impeccabile, costituiscono la base per la crescita di lungo periodo di Luxottica”, ha dichiarato Andrea Guerra, Chief Executive Officer di Luxottica. “Nel corso dell’anno abbiamo infatti gettato le fondamenta per garantire il nostro successo anche nel futuro: abbiamo incrementato di circa il 30% gli investimenti nella nostra crescita attraverso l’espansione delle nostre catene di negozi, abbiamo rafforzato ulteriormente il nostro portafoglio marchi, incrementato la capacità produttiva e migliorato le nostre piattaforme tecnologiche. Abbiamo l’opportunità, nei prossimi anni, di servire 2 miliardi di potenziali nuovi consumatori in tutto il mondo ed è una sfida che puntiamo ad affrontare con grande entusiasmo e determinazione. “Ritengo che il 2012 possa essere un anno ricco di grandi soddisfazioni e che, se continueremo a essere determinati e allo stesso tempo semplici e veloci, possa essere la naturale evoluzione del 2011: numerose sono le opportunità per una solida crescita di Luxottica, sia nei mercati emergenti che in quelli più maturi. “I primi due mesi dell’anno sono stati particolarmente positivi: nei mesi di gennaio e febbraio il fatturato del Gruppo è cresciuto a doppia cifra rispetto allo stesso periodo dell’anno precedente”.
Le azioni per il 2012
Tre saranno le principali direttrici su cui Luxottica svilupperà le proprie azioni nel 2012:
Grow, Simplify e Connect.
Grow
Nel corso del 2012 Luxottica punta a proseguire nella sua crescita in tutte le principali aree
geografiche in cui il Gruppo opera. In particolare, Luxottica prevede di conseguire risultati
particolarmente significativi nelle seguenti regioni strategiche per il Gruppo:
- nei Paesi emergenti Luxottica stima per il 2012 un incremento del fatturato di Gruppo di
oltre il 30%;
- in Nord America è previsto che le vendite omogenee della Divisione Retail possano crescere
fra il 5% e il 7% nel 2012 e il fatturato della Divisione Wholesale di oltre il 15%;
- in Europa Occidentale è stimato un fatturato di Gruppo in aumento fra il 4% e il 6% nel
2012.
Anche nel 2012 i Paesi emergenti costituiranno quindi un formidabile motore di sviluppo per
entrambe le Divisioni di Luxottica. Questi Paesi, che già oggi rappresentano circa il 22% del
fatturato della divisione Wholesale, hanno registrato nel corso dell’ultimo anno una crescita di
circa il 20%. Luxottica prevede che nel 2012 il Gruppo possa proseguire nel trend di sostenuto
sviluppo, grazie anche agli investimenti effettuati dal Gruppo negli ultimi trimestri, fra cui
l’acquisizione di Tecnol, il principale operatore nel settore dell’eyewear in Brasile. E’ quindi
stimato che nel 2015 i Paesi emergenti possano rappresentare circa il 30% del fatturato delle
3
Divisione Wholesale. Grazie alla capillare diffusione della Divisione in tutto il mondo, Luxottica
potrà quindi cogliere al meglio le opportunità ovunque esse si presentino.
Il piano di sviluppo di Sunglass Hut, i risultati della catena GMO in America Latina - entrata a
far parte del Gruppo nel corso del 2011 - e le ottime performance in Cina, costituiranno le basi
per la crescita della Divisione Retail nei Paesi emergenti. L’America Latina, in particolare,
rappresenta un’area dalle significative potenzialità e dove il Gruppo potrà beneficiare delle
sinergie che si potranno verificare fra Tecnol e GMO.
Dopo gli ottimi risultati conseguiti in Nord America negli ultimi due anni, Luxottica punta a
proseguire nel trend di crescita equilibrata di entrambe le Divisioni in questa regione
particolarmente strategica per il Gruppo.
Nel corso del 2012 LensCrafters rafforzerà ulteriormente il suo ruolo di punto di riferimento del
settore nel mercato nord americano. Le innovative tecnologie introdotte dal Gruppo, quali ad
esempio il sistema di misurazione digitale della vista Accufit, consentiranno infatti a
LensCrafters di migliorare ulteriormente il livello di servizio e la relazione con i consumatori,
con livelli di accuratezza e precisione senza precedenti.
L’atteso positivo andamento del segmento premium e lusso e la continua eccellenza nel livello di
servizio offerto consentiranno alla Divisione Wholesale di affermarsi ulteriormente sul mercato
nord americano, grazie anche al lancio delle prime collezioni a marchio Coach, i cui risultati nei
primi due mesi del 2012 sono estremamente positivi.
Simplify
Nei prossimi anni, circa 2 miliardi di nuovi consumatori si affacceranno sul mercato, rendendolo
ancora più ricco di grandi opportunità per Luxottica, ma, allo stesso tempo, più instabile.
Semplicità e velocità, capacità di adattarsi ed evolversi rapidamente, rappresentano da
sempre caratteristiche fondamentali di Luxottica, che, unitamente alla determinazione nel
saper cogliere le opportunità, costituiranno quindi una chiave del successo nel 2012.
Grazie alle azioni messe in atto nel corso degli ultimi trimestri, il 2011 è stato un anno positivo
per le attività della Divisione Retail in Australia, con vendite omogenee5 cresciute di circa il 10%
nel quarto trimestre del 2011. Nel corso del 2012 Luxottica punta a rafforzare ulteriormente il
posizionamento di OPSM, la principale catena del settore ottico nella regione, attraverso un
piano che prevede 50 nuovi punti vendita nei prossimi 24 mesi e spese complessive per oltre
40 milioni di dollari australiani in negozi, nuove tecnologie, marketing e riorganizzazione delle
altre catene retail del Gruppo. Grazie a queste azioni, è previsto che la Divisione Retail possa
crescere fra l’8% e il 12% nella regione nel 2012.
Connect
La capacità di creare un rapporto con il cliente e con il consumatore sempre più stretto,
fiduciario e di lungo periodo e l’abilità nel raccontare in profondità storie sui marchi che fanno
parte del portafoglio di Luxottica costituiranno sempre di più uno dei fattori critici di successo
per il Gruppo.
Nel corso degli ultimi anni, Sunglass Hut, la principale catena al mondo specializzata nel
segmento “sole”, ha mostrato di saper essere un eccezionale interprete di queste qualità. Nel
2011, le vendite omogenee5 sono cresciute dell’8,7% a livello globale, raggiungendo i livelli più
alti nella storia del marchio. Luxottica prevede che il successo di Sunglass Hut possa
proseguire anche nel 2012, attraverso la continua crescita nella cosiddetta sun belt, aree
4
geografiche con un elevato numero di giorni di sole all’anno ed elevata propensione al consumo,
compresa l’Europa, e alle opportunità nel segmento del travel retail e dei grandi magazzini.
Dopo le acquisizioni in Messico, l’avvio delle attività in Brasile e Cina e lo sviluppo in India il
Gruppo stima che Sunglass Hut possa proseguire nella sua espansione globale, con l’obiettivo di
raggiungere 4.000 punti vendita al 2015.
Il 2012 sarà un anno particolarmente importante per Oakley, dopo il sesto anno consecutivo di
crescita a doppia cifra, trend che è previsto possa proseguire anche nel 2012: il marchio,
che ha saputo costruire un eccezionale rapporto con i principali atleti di tutte le discipline
sportive, potrà infatti beneficiare delle opportunità offerte dalle Olimpiadi di Londra, di cui
Oakley è sponsor.
Saranno inoltre colti ulteriori benefici dall’espansione del programma OCP (Oakley Custom
Program), che è diventato un motore di business importante e generatore di opportunità per
tutta la piattaforma digitale di Oakley. Proseguiranno inoltre gli investimenti in India, Cina,
Brasile ed Europa, regioni che sono previste crescere significativamente, grazie anche al
rafforzamento degli investimenti nella politica commerciale, nello stile e nella tecnologia per il
segmento “vista”.
Andamento del Gruppo nel 2011
Grazie alla buona crescita in tutti i trimestri dell’anno, il fatturato dell’intero 2011 ha
superato i 6,2 miliardi di euro, livello più alto della storia di Luxottica, rispetto ai 5,8 miliardi
del 2010 (+7,3% a cambi correnti e 9,9% a cambi costanti2).
Le performance operative dell’anno hanno a loro volta confermato la validità delle azioni messe
in atto da Luxottica per incrementare la redditività. In particolare, l’EBITDA adjusted3,4 del
2011 ha registrato una significativa crescita (+9,8% rispetto al 2010), attestandosi a 1.135,9
milioni di euro. Il margine EBITDA adjusted3,4 è quindi cresciuto dal 17,8% del 2010 al 18,3%. Nel
quarto trimestre del 2011, l’EBITDA adjusted3,4 ha mostrato un incremento del 16,6% rispetto
allo stesso periodo dell’anno precedente a 224,7 milioni di euro, con un margine EBITDA adjusted3,4 del 14,9% (14,3% nel quarto trimestre 2010).
La crescita del risultato operativo adjusted3,4 del 2011, pari a 820,9 milioni di euro, è stata del
12% rispetto al dato di fine 2010. Il margine operativo adjusted3,4 del Gruppo è quindi passato
dal 12,6% del 2010 al 13,2%. Nel quarto trimestre dell’anno, il risultato operativo adjusted3,5 si è
attestato a 139,3 milioni di euro rispetto ai 116,6 milioni dello stesso periodo dell’anno
precedente (+19,5%), con un margine operativo adjusted3,4 cresciuto dall’8,7% al 9,2%, a
conferma della bontà delle azioni volte al miglioramento della redditività.
Il risultato operativo della Divisione Wholesale nel 2011 è stato pari a 529,1 milioni di euro
(+14,6% rispetto al 2010), con un margine operativo del 21,5% (+80 bps rispetto all’anno
precedente).
Nel 2011 la Divisione Retail ha fatto registrare un risultato operativo adjusted3,4 di 448,7 milioni
di euro, in crescita del 5,7% rispetto al 2010, con un margine operativo adjusted3,4 dell’11,9%, in
linea con il dato dell’anno precedente.
L’utile netto adjusted3,4 dell’anno si è quindi attestato a 455,6 milioni, in crescita del 13,1%
rispetto ai 402,7 milioni dell’anno precedente, corrispondente a un Earning per Share (EPS)
adjusted3,4 di 0,99 euro. Nel quarto trimestre del 2011 l’utile netto adjusted3,4 è passato da 55,6
milioni di euro a 72,7 milioni (+30,8%).
5
Grazie al costante controllo del capitale circolante, il Gruppo ha ottenuto una forte
generazione di cassa4, che è stata pari a circa 500 milioni di euro nell’anno. Di conseguenza,
l’indebitamento netto4 al 31 dicembre 2011 si è ridotto a 2.032 milioni di euro (2.111 milioni a
fine 2010), con un rapporto indebitamento netto/EBITDA adjusted3,4 pari a 1,7 rispetto a 2,0 a
fine 2010. Per il 2012 è prevista un’ulteriore riduzione della leva finanziaria.
§
Il Consiglio di Amministrazione proporrà all’Assemblea degli Azionisti la distribuzione di un
dividendo di 0,49 euro per azione ordinaria. Il monte dividendi è quindi pari a circa 225 milioni
di euro, con un payout di circa il 50% dell’utile netto consolidato.
Il Consiglio ha deliberato di convocare per il 27 aprile in prima convocazione e per il 28 aprile in
seconda convocazione l’Assemblea Ordinaria degli Azionisti per l’approvazione del Bilancio di
esercizio 2011; il dividendo verrà posto in pagamento il 24 maggio 2012 (data stacco cedola 21
maggio 2012). Per quanto riguarda gli American Depositary Shares (ADS) quotati al New York
Stock Exchange, la data di stacco del dividendo coinciderà con il 21 maggio, mentre la data di
pagamento del dividendo in dollari da parte di Deutsche Bank Trust Americas (DB), banca
intestataria delle azioni a fronte delle quali sono stati emessi gli American Depositary Receipts
(ADR) ed incaricata al pagamento in oggetto, è stata prevista da DB per il 31 maggio 2012, al
tasso di cambio Euro / Dollaro del 24 maggio 2012. L’assemblea sarà inoltre chiamata a
deliberare la nomina dei componenti del Consiglio di Amministrazione e del Collegio Sindacale, i
cui rispettivi mandati termineranno con l’Assemblea, l’integrazione del corrispettivo per
l’incarico di revisione legale dei conti nonché a esaminare la politica in materia di
remunerazione.
§
Il Consiglio di Amministrazione, inoltre, su proposta del Comitato Risorse Umane, verificato il
massimo raggiungimento degli obiettivi di EPS cumulato nel triennio di riferimento 2009-2011, in
esecuzione del Piano Performance Share 2009 attribuito il 7 maggio 2009, ha
assegnato 1.505.400 azioni Luxottica Group, pari al numero massimo attribuibile in virtù del
raggiungimento del livello massimo degli obiettivi fissati dal Piano, a 31 beneficiari del Piano. Le
informazioni di dettaglio sull’assegnazione, come previsto dall’articolo 84 bis del Regolamento
Emittenti, saranno riportate nella relazione sulla remunerazione da pubblicarsi ai sensi
dell’articolo 123-ter del D.lgs 58/1998.
§
Il Consiglio di Amministrazione ha infine deliberato di procedere all’emissione, entro il 2012, di
un prestito obbligazionario destinato ai soli investitori qualificati. Il prestito obbligazionario avrà
un ammontare nominale massimo di 500 milioni di euro. I termini finali dell'emissione saranno
determinati al momento del pricing in base alle condizioni di mercato.
§
I risultati del 2011 saranno illustrati domani 29 febbraio 2012 a partire dalle ore 9:30 (GMT) nel
corso di una presentazione alla comunità finanziaria che si terrà a Milano. La presentazione sarà
disponibile in web cast in diretta sul sito Internet www.luxottica.com.
6
Il Dirigente Preposto alla redazione dei documenti contabili societari Enrico Cavatorta dichiara ai sensi del comma 2 articolo 154 bis del Testo Unico della Finanza che l’informativa contabile contenuta nel presente comunicato corrisponde alle risultanze documentali, ai libri e alle scritture contabili.
CONSOLIDATED FINANCIAL HIGHLIGHTSFOR THE TWELVE-MONTH PERIODS ENDED
- SEGMENTAL INFORMATION -
Luxottica Group 4Q11, Table 6 of 6
Non-IAS/IFRS Measures: Adjusted measures
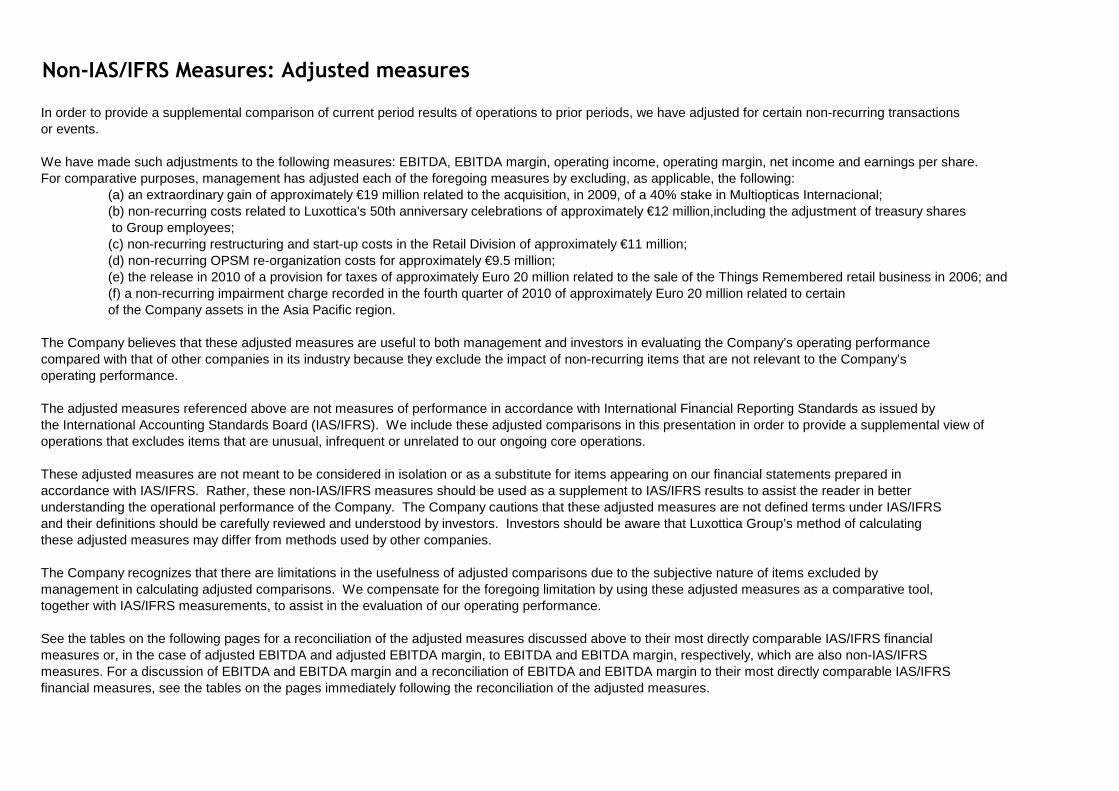
In order to provide a supplemental comparison of current period results of operations to prior periods, we have adjusted for certain non-recurring transactions or events.
We have made such adjustments to the following measures: EBITDA, EBITDA margin, operating income, operating margin, net income and earnings per share. For comparative purposes, management has adjusted each of the foregoing measures by excluding, as applicable, the following:
(a) an extraordinary gain of approximately €19 million related to the acquisition, in 2009, of a 40% stake in Multiopticas Internacional;(b) non-recurring costs related to Luxottica's 50th anniversary celebrations of approximately €12 million,including the adjustment of treasury shares to Group employees; (c) non-recurring restructuring and start-up costs in the Retail Division of approximately €11 million;(d) non-recurring OPSM re-organization costs for approximately €9.5 million;(e) the release in 2010 of a provision for taxes of approximately Euro 20 million related to the sale of the Things Remembered retail business in 2006; and(f) a non-recurring impairment charge recorded in the fourth quarter of 2010 of approximately Euro 20 million related to certain of the Company assets in the Asia Pacific region.
The Company believes that these adjusted measures are useful to both management and investors in evaluating the Company’s operating performance compared with that of other companies in its industry because they exclude the impact of non-recurring items that are not relevant to the Company’soperating performance.
The adjusted measures referenced above are not measures of performance in accordance with International Financial Reporting Standards as issued by the International Accounting Standards Board (IAS/IFRS). We include these adjusted comparisons in this presentation in order to provide a supplemental view of operations that excludes items that are unusual, infrequent or unrelated to our ongoing core operations.
These adjusted measures are not meant to be considered in isolation or as a substitute for items appearing on our financial statements prepared in accordance with IAS/IFRS. Rather, these non-IAS/IFRS measures should be used as a supplement to IAS/IFRS results to assist the reader in better understanding the operational performance of the Company. The Company cautions that these adjusted measures are not defined terms under IAS/IFRSand their definitions should be carefully reviewed and understood by investors. Investors should be aware that Luxottica Group’s method of calculating these adjusted measures may differ from methods used by other companies.
The Company recognizes that there are limitations in the usefulness of adjusted comparisons due to the subjective nature of items excluded by management in calculating adjusted comparisons. We compensate for the foregoing limitation by using these adjusted measures as a comparative tool, together with IAS/IFRS measurements, to assist in the evaluation of our operating performance.
See the tables on the following pages for a reconciliation of the adjusted measures discussed above to their most directly comparable IAS/IFRS financial measures or, in the case of adjusted EBITDA and adjusted EBITDA margin, to EBITDA and EBITDA margin, respectively, which are also non-IAS/IFRSmeasures. For a discussion of EBITDA and EBITDA margin and a reconciliation of EBITDA and EBITDA margin to their most directly comparable IAS/IFRSfinancial measures, see the tables on the pages immediately following the reconciliation of the adjusted measures.
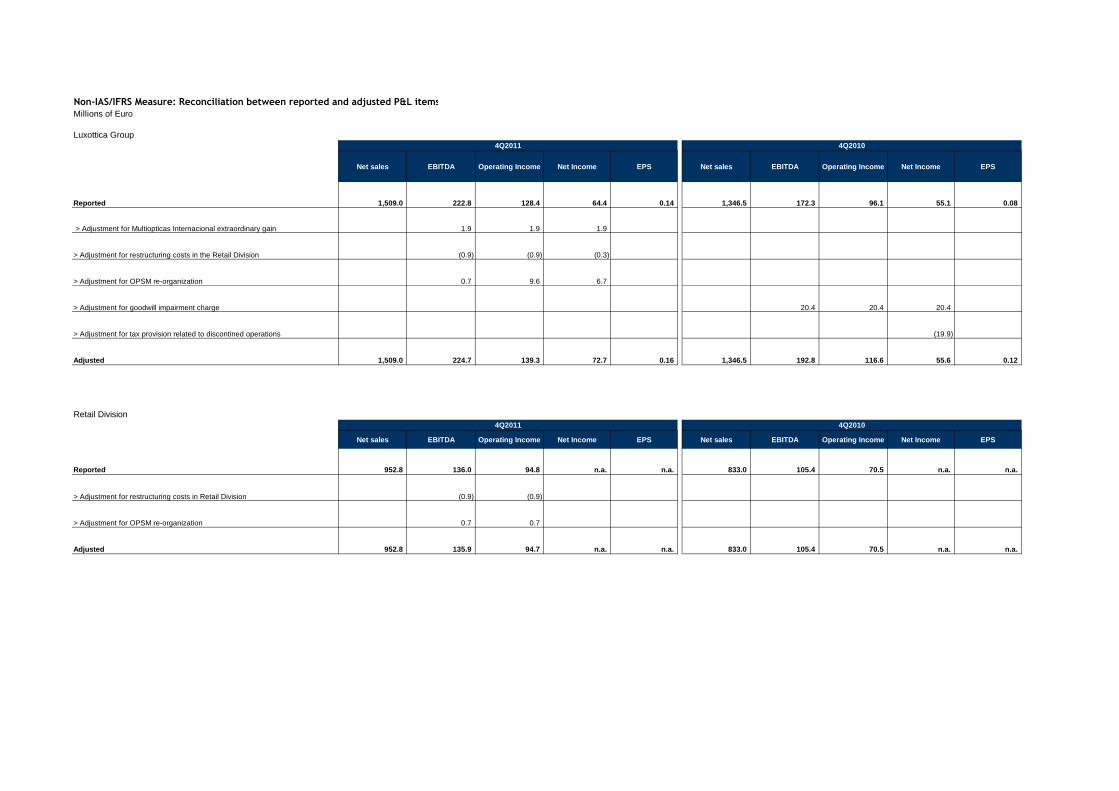
Non-IAS/IFRS Measure: Reconciliation between reported and adjusted P&L items
Millions of Euro
Luxottica Group
Net sales EBITDA Operating Income Net Income EPS Net sales EBITDA Operating Income Net Income EPS
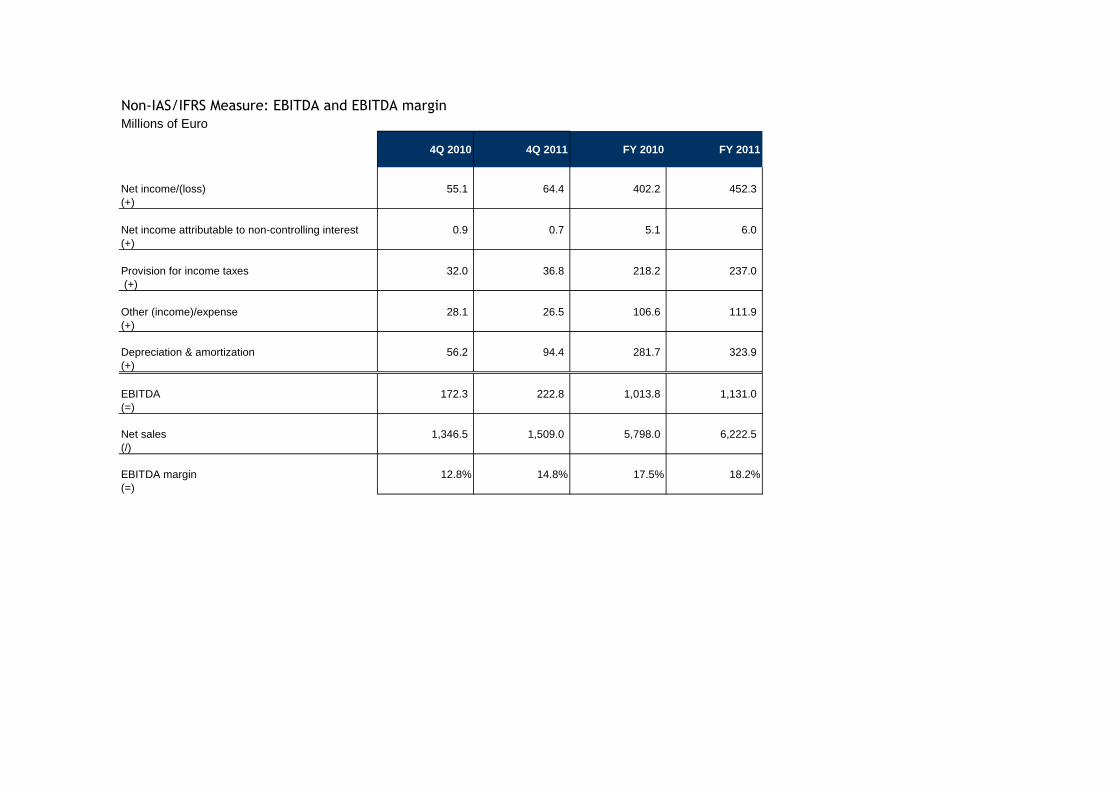
EBITDA represents net income before non-controlling interest, taxes, other income/expense, depreciation and amortization. EBITDA margin means EBITDA divided by net sales.
The Company believes that EBITDA is useful to both management and investors in evaluating the Company’s operating performance compared with that of other companies in its industry. Our calculation of EBITDA allows us to compare our operating results with those of other companies without giving effect to financing, income taxes and the accounting effects of capital spending, which items may vary for different companies for reasons unrelated to the overall operating performance of a company’s business.
EBITDA and EBITDA margin are not measures of performance under International Financial Reporting Standards as issued by the International Accounting Standards Board (IAS/IFRS).
We include them in this presentation in order to:
* improve transparency for investors;* assist investors in their assessment of the Company’s operating performance and its ability to refinance its debt as it matures and incur additional indebtedness to invest in new business opportunities;* assist investors in their assessment of the Company’s cost of debt;* ensure that these measures are fully understood in light of how the Company evaluates its operating results and leverage;* properly define the metrics used and confirm their calculation; and* share these measures with all investors at the same time.
EBITDA and EBITDA margin are not meant to be considered in isolation or as a substitute for items appearing on our financial statements prepared in accordance with IAS/IFRS. Rather, these non-IAS/IFRS measures should be used as a supplement to IAS/IFRS results to assist the reader in better understanding the operational performance of the Company. The Company cautions that these measures are not defined terms under IAS/IFRS and their definitions should be carefully reviewed and understood by investors. Investors should be aware that Luxottica Group’s method of calculating EBITDA may differ from methods used by other companies. The Company recognizes that the usefulness of EBITDA has certain limitations, including:
* EBITDA does not include interest expense. Because we have borrowed money in order to finance our operations, interest expense is a necessary element of our costs and ability to generate profits and cash flows. Therefore, any measure that excludes interest expense may have material limitations;
* EBITDA does not include depreciation and amortization expense. Because we use capital assets, depreciation and amortization expense is a necessary element of our costs and ability to generate profits. Therefore, any measure that excludes depreciation and expense may have material limitations;
* EBITDA does not include provision for income taxes. Because the payment of income taxes is a necessary element of our costs, any measure that excludes tax expense may have material limitations;* EBITDA does not reflect cash expenditures or future requirements for capital expenditures or contractual commitments;* EBITDA does not reflect changes in, or cash requirements for, working capital needs; and* EBITDA does not allow us to analyze the effect of certain recurring and non-recurring items that materially affect our net income or loss.
We compensate for the foregoing limitations by using EBITDA as a comparative tool, together with IAS/IFRS measurements, to assist in the evaluation of our operating performance and leverage.
See the table on the following page for a reconciliation of EBITDA to net income, which is the most directly comparable IAS/IFRS financial measure, as well as the calculation of EBITDA margin on net sales.
Non-IAS/IFRS Measure: EBITDA and EBITDA margin
Millions of Euro
4Q 2010 4Q 2011 FY 2010 FY 2011
Net income/(loss) 55.1 64.4 402.2 452.3 (+)
Net income attributable to non-controlling interest 0.9 0.7 5.1 6.0 (+)
Provision for income taxes 32.0 36.8 218.2 237.0 (+)
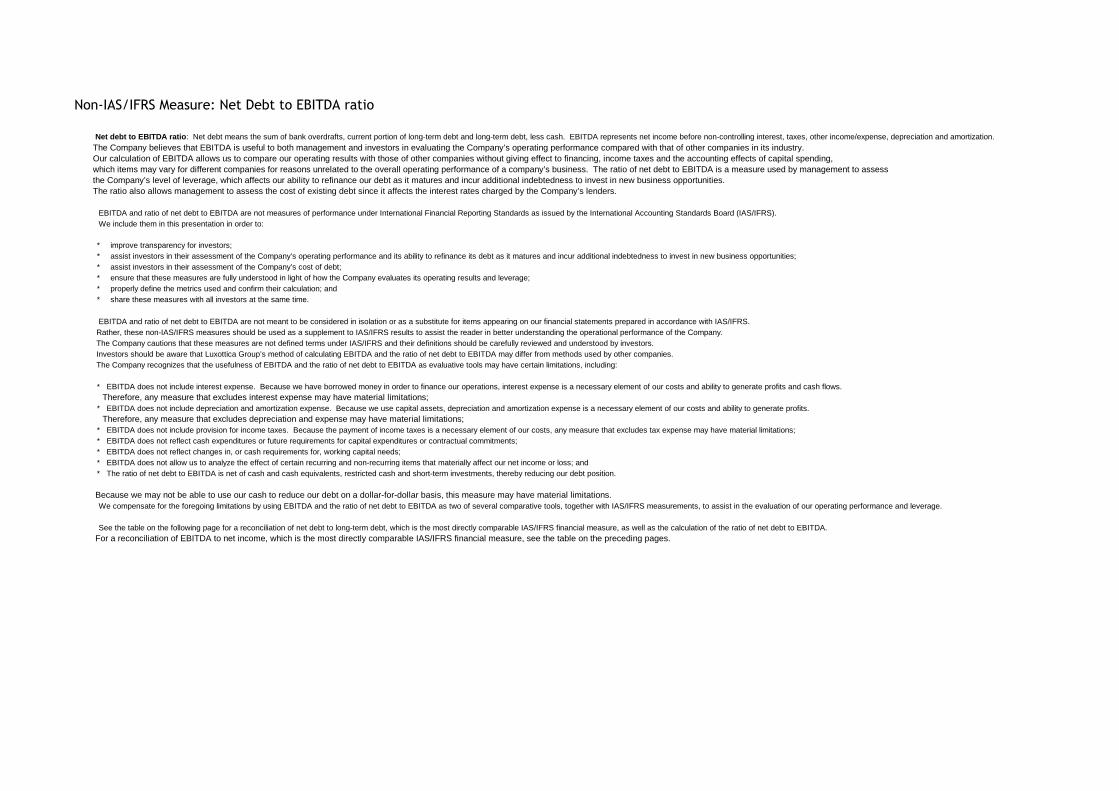
Net debt to EBITDA ratio: Net debt means the sum of bank overdrafts, current portion of long-term debt and long-term debt, less cash. EBITDA represents net income before non-controlling interest, taxes, other income/expense, depreciation and amortization. The Company believes that EBITDA is useful to both management and investors in evaluating the Company’s operating performance compared with that of other companies in its industry. Our calculation of EBITDA allows us to compare our operating results with those of other companies without giving effect to financing, income taxes and the accounting effects of capital spending, which items may vary for different companies for reasons unrelated to the overall operating performance of a company’s business. The ratio of net debt to EBITDA is a measure used by management to assess the Company’s level of leverage, which affects our ability to refinance our debt as it matures and incur additional indebtedness to invest in new business opportunities. The ratio also allows management to assess the cost of existing debt since it affects the interest rates charged by the Company’s lenders.
EBITDA and ratio of net debt to EBITDA are not measures of performance under International Financial Reporting Standards as issued by the International Accounting Standards Board (IAS/IFRS). We include them in this presentation in order to:
* improve transparency for investors; * assist investors in their assessment of the Company’s operating performance and its ability to refinance its debt as it matures and incur additional indebtedness to invest in new business opportunities; * assist investors in their assessment of the Company’s cost of debt; * ensure that these measures are fully understood in light of how the Company evaluates its operating results and leverage; * properly define the metrics used and confirm their calculation; and * share these measures with all investors at the same time.
EBITDA and ratio of net debt to EBITDA are not meant to be considered in isolation or as a substitute for items appearing on our financial statements prepared in accordance with IAS/IFRS. Rather, these non-IAS/IFRS measures should be used as a supplement to IAS/IFRS results to assist the reader in better understanding the operational performance of the Company. The Company cautions that these measures are not defined terms under IAS/IFRS and their definitions should be carefully reviewed and understood by investors. Investors should be aware that Luxottica Group’s method of calculating EBITDA and the ratio of net debt to EBITDA may differ from methods used by other companies. The Company recognizes that the usefulness of EBITDA and the ratio of net debt to EBITDA as evaluative tools may have certain limitations, including:
* EBITDA does not include interest expense. Because we have borrowed money in order to finance our operations, interest expense is a necessary element of our costs and ability to generate profits and cash flows. Therefore, any measure that excludes interest expense may have material limitations; * EBITDA does not include depreciation and amortization expense. Because we use capital assets, depreciation and amortization expense is a necessary element of our costs and ability to generate profits.
Therefore, any measure that excludes depreciation and expense may have material limitations; * EBITDA does not include provision for income taxes. Because the payment of income taxes is a necessary element of our costs, any measure that excludes tax expense may have material limitations; * EBITDA does not reflect cash expenditures or future requirements for capital expenditures or contractual commitments; * EBITDA does not reflect changes in, or cash requirements for, working capital needs; * EBITDA does not allow us to analyze the effect of certain recurring and non-recurring items that materially affect our net income or loss; and * The ratio of net debt to EBITDA is net of cash and cash equivalents, restricted cash and short-term investments, thereby reducing our debt position.
Because we may not be able to use our cash to reduce our debt on a dollar-for-dollar basis, this measure may have material limitations. We compensate for the foregoing limitations by using EBITDA and the ratio of net debt to EBITDA as two of several comparative tools, together with IAS/IFRS measurements, to assist in the evaluation of our operating performance and leverage.
See the table on the following page for a reconciliation of net debt to long-term debt, which is the most directly comparable IAS/IFRS financial measure, as well as the calculation of the ratio of net debt to EBITDA. For a reconciliation of EBITDA to net income, which is the most directly comparable IAS/IFRS financial measure, see the table on the preceding pages.
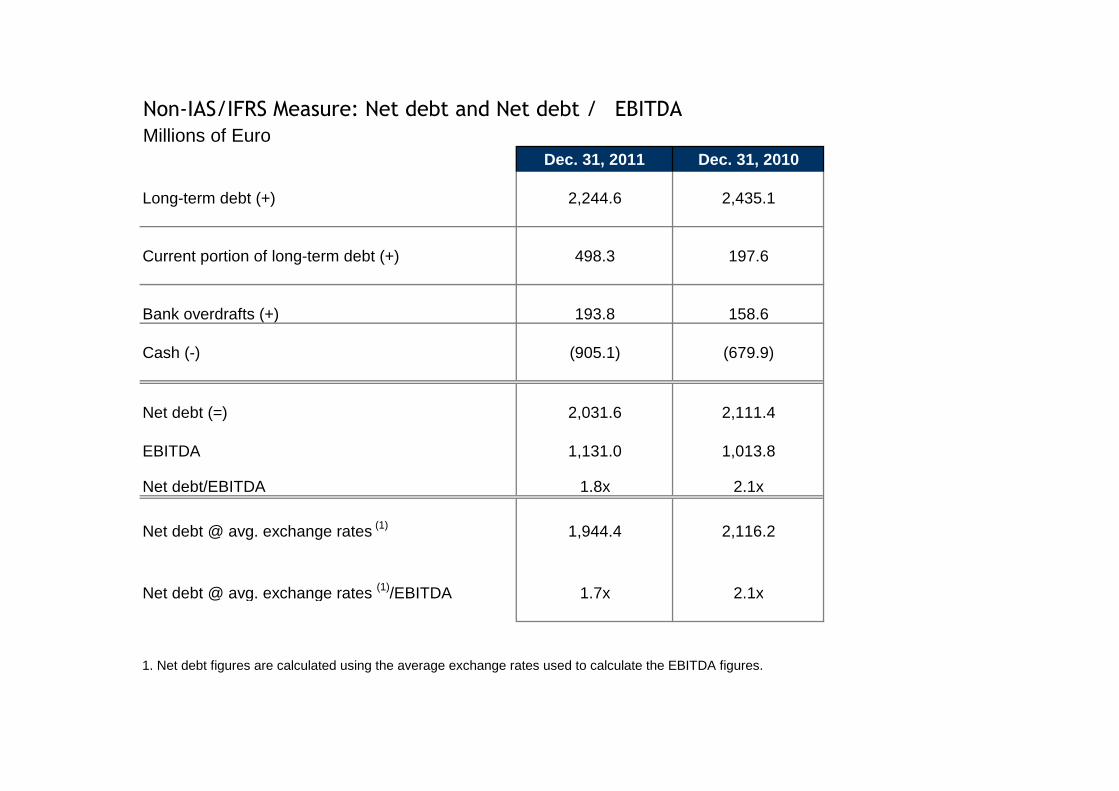
Non-IAS/IFRS Measure: Net debt and Net debt / EBITDA
Millions of EuroDec. 31, 2011 Dec. 31, 2010
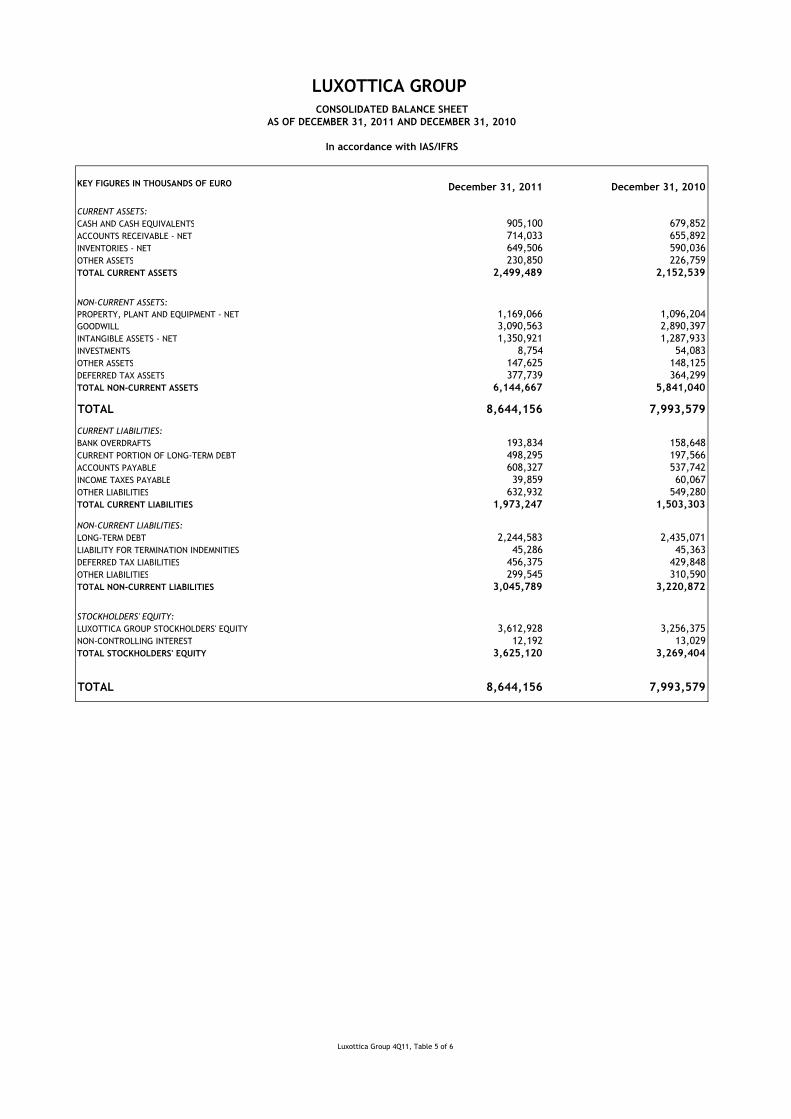
Long-term debt (+) 2,244.6 2,435.1
Current portion of long-term debt (+) 498.3 197.6
Bank overdrafts (+) 193.8 158.6
Cash (-) (905.1) (679.9)
Net debt (=) 2,031.6 2,111.4
EBITDA 1,131.0 1,013.8
Net debt/EBITDA 1.8x 2.1x
Net debt @ avg. exchange rates (1) 1,944.4 2,116.2
Net debt @ avg. exchange rates (1)/EBITDA 1.7x 2.1x
1. Net debt figures are calculated using the average exchange rates used to calculate the EBITDA figures.
Non-IAS/IFRS Measure: Net debt and Net debt / Adjusted EBITDA
Millions of EuroDec. 31, 2011 Dec. 31, 2010
Long-term debt (+) 2,244.6 2,435.1
Current portion of long-term debt (+) 498.3 197.6
Bank overdrafts (+) 193.8 158.6
Cash (-) (905.1) (679.9)
Net debt (=) 2,031.6 2,111.4
LTM EBITDA ADJ 1,135.9 1,034.2
Net debt/LTM EBITDA 1.8x 2.0x
Net debt @ avg. exchange rates (1) 1,944.4 2,116.2
Net debt @ avg. exchange rates (1)/LTM EBITDA 1.7x 2.0x
1. Net debt figures are calculated using the average exchange rates used to calculate the EBITDA figures.
Non-IAS/IFRS Measures: Free Cash Flow
Free cash flow net represents net income before non-controlling interest, taxes, other income/expense, depreciation and amortization (i.e. EBITDA – see table on the earlier page) plus or minus the decrease/(increase) in working capital over the prior period, less capital expenditures, plus or minus interest income/(expense) and extraordinary items, minus taxes paid. The Company believes that free cash flow is useful to both management and investors in evaluating the Company’s operating performance compared with other companies in its industry. In particular, our calculation of free cash flow provides a clearer picture of the Company’s ability to generate net cash from operations, which is used for mandatory debt service requirements, to fund discretionary investments, pay dividends or pursue other strategic opportunities.
Free cash flow is not a measure of performance under International Financial Reporting Standards as issued by the International Accounting Standards Board (IAS/IFRS). We include it in this presentation in order to:
* Improve transparency for investors; * Assist investors in their assessment of the Company’s operating performance and its ability to generate cash from operations in excess of its cash expenses; * Ensure that this measure is fully understood in light of how the Company evaluates its operating results; * Properly define the metrics used and confirm their calculation; and * Share this measure with all investors at the same time.
Free cash flow is not meant to be considered in isolation or as a substitute for items appearing on our financial statements prepared in accordance with IAS/IFRS. Rather, this non-IAS/IFRS measure should be used as a supplement to IAS/IFRS results to assist the reader in better understanding the operational performance of the Company. The Company cautions that this measure is not a defined term under IAS/IFRS and its definition should be carefully reviewed and understood by investors. Investors should be aware that Luxottica Group’s method of calculation of free cash flow may differ from methods used by other companies. The Company recognizes that the usefulness of free cash flow as an evaluative tool may have certain limitations, including:
• The manner in which the Company calculates free cash flow may differ from that of other companies, which limits its usefulness as a comparative measure; • Free cash flow does not represent the total increase or decrease in the net debt balance for the period since it excludes, among other things, cash used for funding discretionary investments and to pursue strategic opportunities during the period and any impact of the exchange rate changes; and • Free cash flow can be subject to adjustment at the Company’s discretion if the Company takes steps or adopts policies that increase or diminish its current liabilities and/or changes to working capital.
We compensate for the foregoing limitations by using free cash flow as one of several comparative tools, together with IAS/IFRS measurements, to assist in the evaluation of our operating performance.
See the table on the following page for a reconciliation of free cash flow to EBITDA and the table on the earlier page for a reconciliation of EBITDA to net income, which is the most directly comparable IAS/IFRS financial measure.
Non-IAS/IFRS Measure: Free cash flow
Millions of Euro
FY 2011EBITDA (1) 1,136 ∆ working capital 13 Capex (307)
Operating cash flow 842
Financial charges (2) (109) Taxes (229)
Extraordinary charges (3) (8)
Free cash flow 496
1. EBITDA is not an IAS/IFRS measure; please see table on the earlier page for a reconciliation of EBITDA to net income
2. Equals interest income minus interest expense
3. Equals extraordinary income minus extraordinary expense
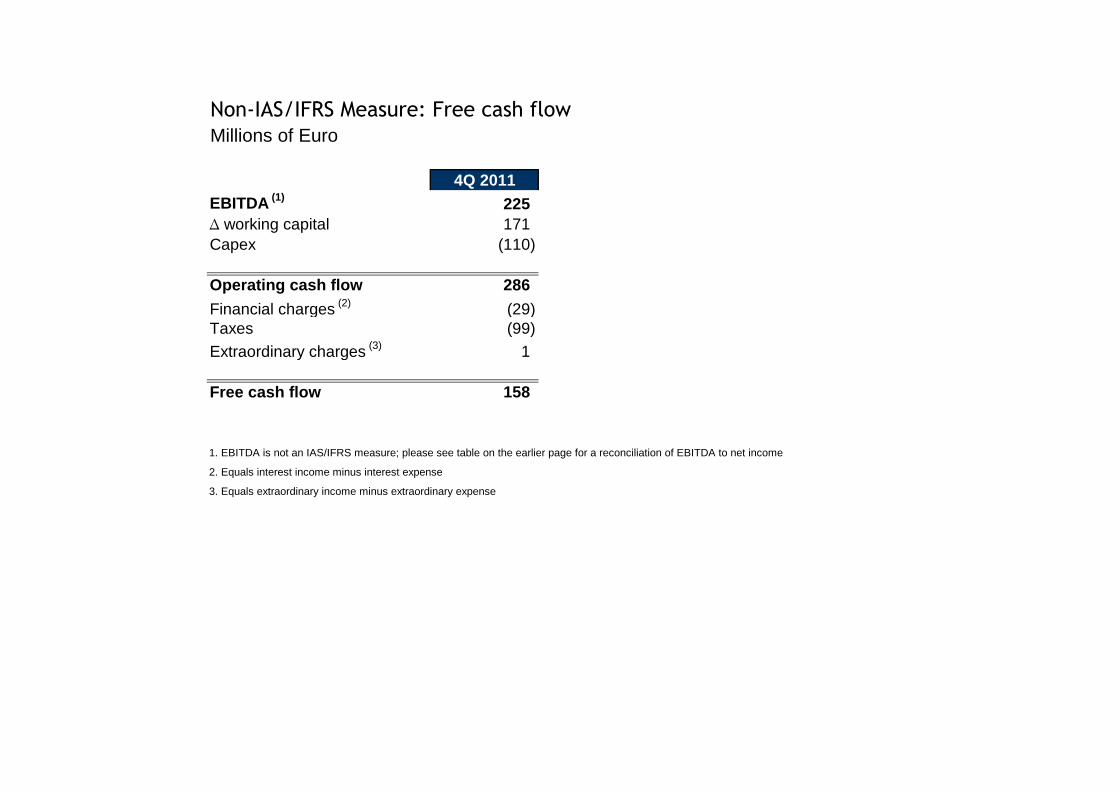
Non-IAS/IFRS Measure: Free cash flow
Millions of Euro
4Q 2011EBITDA (1) 225 ∆ working capital 171 Capex (110)
Operating cash flow 286
Financial charges (2) (29) Taxes (99)
Extraordinary charges (3) 1
Free cash flow 158
1. EBITDA is not an IAS/IFRS measure; please see table on the earlier page for a reconciliation of EBITDA to net income
2. Equals interest income minus interest expense
3. Equals extraordinary income minus extraordinary expense
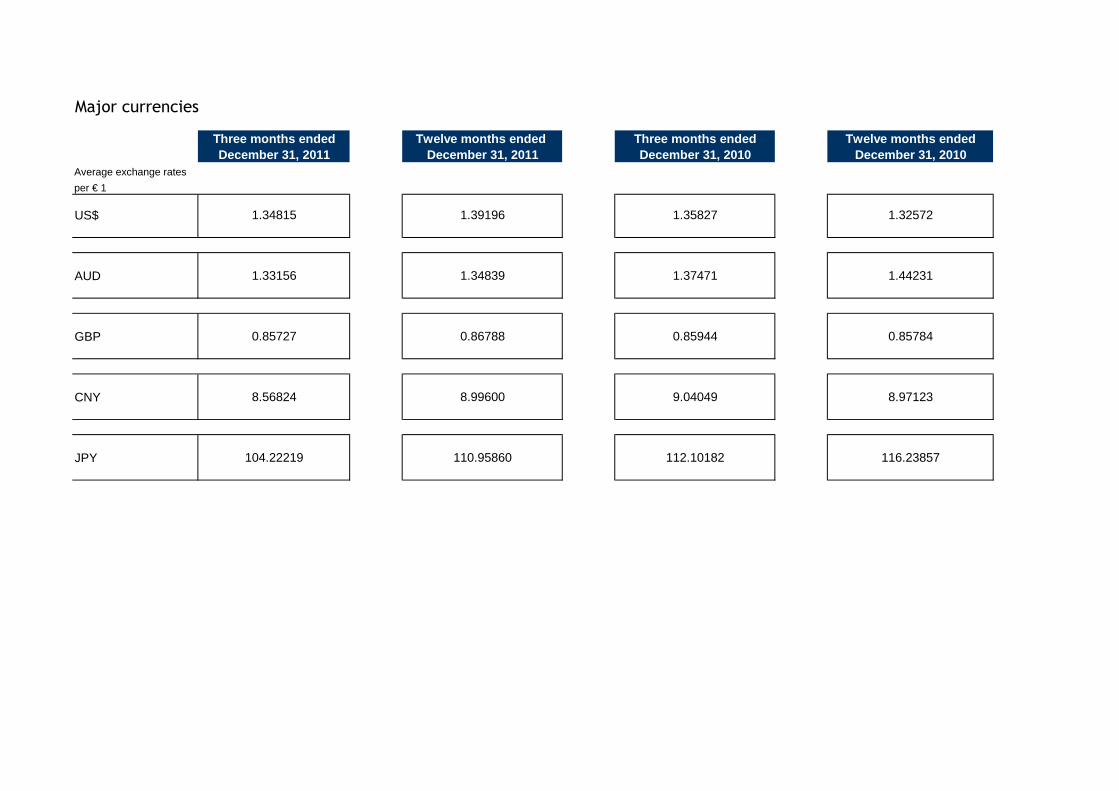
Major currencies
Three months ended Twelve months ended Three months ended Twelve months endedDecember 31, 2011 December 31, 2011 December 31, 2010 December 31, 2010