

Analisi di reti sociali - Aprile 2011
Analisi delle Reti Sociali http://didawiki.cli.di.unipi.it/doku.php/dm/sna.ingegneria2011
Grafi e Proprietà delle reti
Fosca Giannotti & Michele Berlingerio, KDD Lab. ISTI-CNR
kdd.isti.cnr.it/
[email protected], [email protected]
http://didawiki.cli.di.unipi.it/doku.php/wma/start

Analisi di reti sociali - Aprile 2011
Class Outline
Basic network measures - recall Basic network measures in Real network vs Random network
social, technological, business, economic, content,… First Social science hypotheses confirmed by large scale experiments
Small world: by Leskovec & Watts Second Social science hypotheses confirmed by large scale experiments
Weak & strong ties Clustering coefficent, triadic closure, bridges
Centrality Measures: betweness

Analisi di reti sociali - Aprile 2011
Biblio
1. Onnela 2007: Structure and tie strengths in mobile communication networksJ.-
2. Planetary-Scale Views on an Instant-Messaging Network∗Jure Leskovec
3. The strenght of Weak Ties, Mrk Ganovetter† 4. An Experimental Study of Search in Global Social
NetworksPeter Sheridan Dodds,1 Roby Muhamad,2 Duncan J. Watts1,2*
5. An ExperimentalStudy of the Small World Problem*JEFFREY TRAVERS Harvard UniversityAND STANLEY MILGRAM

Basic measures
Analisi di reti sociali - Aprile 2011

Degree distribution: ! ! P(k)!
Path length: ! ! ! ! l! ! ! !
Clustering coefficient:
Network Science: Graph Theory January 24, 2011!
KEY MEASURES!

Degree distribution "P(k): probability that a randomly chosen vertex has degree k"
Nk = # nodes with degree k!P(k) = Nk / N ➔ plot!
k!
P(k)
1! 2! 3! 4!
0.1!0.2!0.3!0.4!0.5!0.6!
Network Science: Graph Theory January 24, 2011!
DEGREE DISTRIBUTION!

Diameter: the maximum distance between any pair of nodes in the graph.
Average path length/distance for a direct connected graph (component)
or a strongly connected (component of a) digraph.
where lij is the distance from node i to node j
In an undirected (symmetrical) graph lij =lji, we only need to count them once
€
l ≡ 12Lmax
liji, j≠ i∑
€
l ≡ 1Lmax
liji, j> i∑
Network Science: Graph Theory January 24, 2011!
NETWORK DIAMETER AND AVERAGE DISTANCE!
€
Lmax =N2⎛
⎝ ⎜ ⎞
⎠ ⎟ =
N(N −1)2
Analisi di reti sociali - Aprile 2011

" Clustering coefficient: ! what portion of your neighbors are connected?"
" Node i with degree ki"
" Ci in [0,1]"
Network Science: Graph Theory January 24, 2011!
CLUSTERING COEFFICIENT!
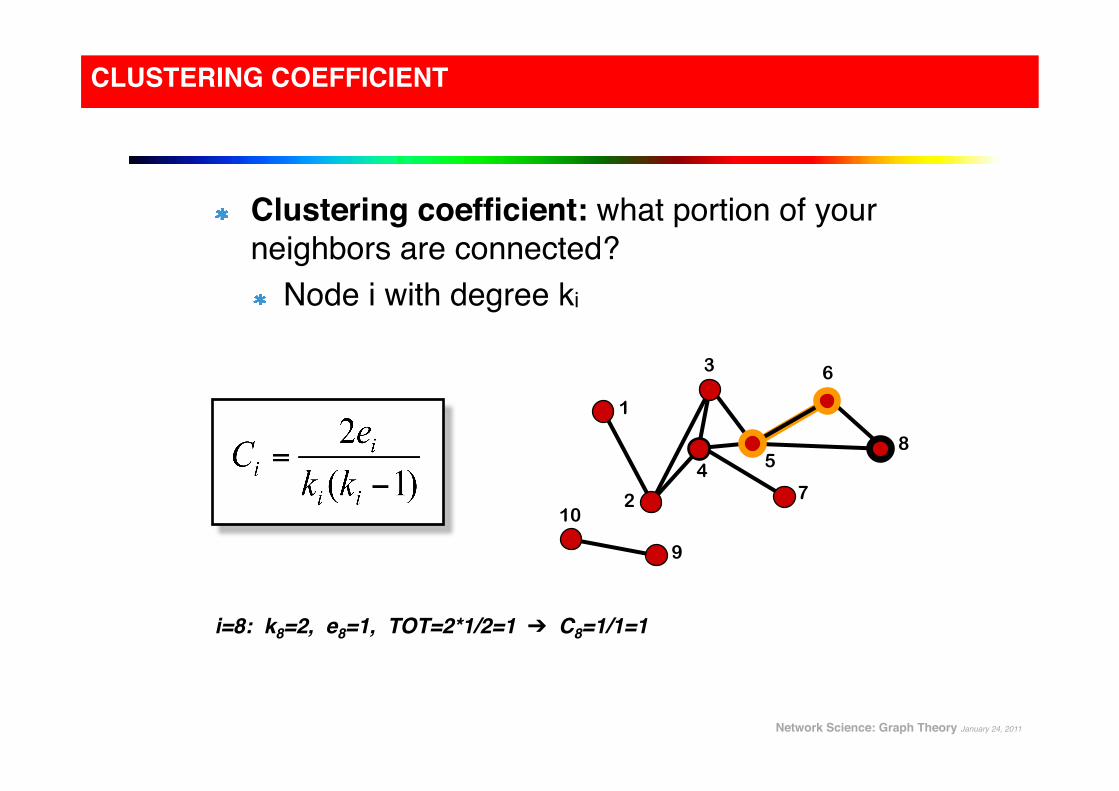
" Clustering coefficient: what portion of your neighbors are connected?"" Node i with degree ki"
2
1
3
4 5
7
6
8
9
10
i=8: k8=2, e8=1, TOT=2*1/2=1 ➔ C8=1/1=1!
Network Science: Graph Theory January 24, 2011!
CLUSTERING COEFFICIENT!

" Clustering coefficient: what portion of your neighbors are connected?"" Node i with degree ki"
i=4: k4=4, e4=2, TOTAL=4*3/2=6 ➔ C4=2/6=1/3!
Network Science: Graph Theory January 24, 2011!
CLUSTERING COEFFICIENT!
2
1
3
4 5
7
6
8
9
10

Analisi di reti sociali - Aprile 2011

Analisi di reti sociali - Aprile 2011

Analisi di reti sociali - Aprile 2011
Analisi di reti sociali - Aprile 2011

Real networks vs random networks
Analisi di reti sociali - Aprile 2011

RANDOM NETWORK MODEL!
Network Science: Random Graphs January 31, 2011!
Erdös-Rényi model (1960)!
Connect with probability p"
p=1/6 N=10 "〈k〉 ~ 1.5"
Pául Erdös!(1913-1996)"

RANDOM NETWORK MODEL!
Network Science: Random Graphs January 31, 2011!
Definition: A random graph is a graph of N labeled nodes where each pair of nodes is connected by a preset probability p."
A!
B!L!
I!
F!
E!G!
C!
H! D!

RANDOM NETWORK MODEL!
Network Science: Random Graphs January 31, 2011!
N and p do not uniquely define the network– we can have many different realizations of it. How many?"
€
P(G(N,L)) = pL (1− p)N (N−1)2
−L
N=10 !p=1/6!
The probability to form a particular graph G(N,L) is" That is, each graph G(N,L) appears with probability" P(G(N,L))."
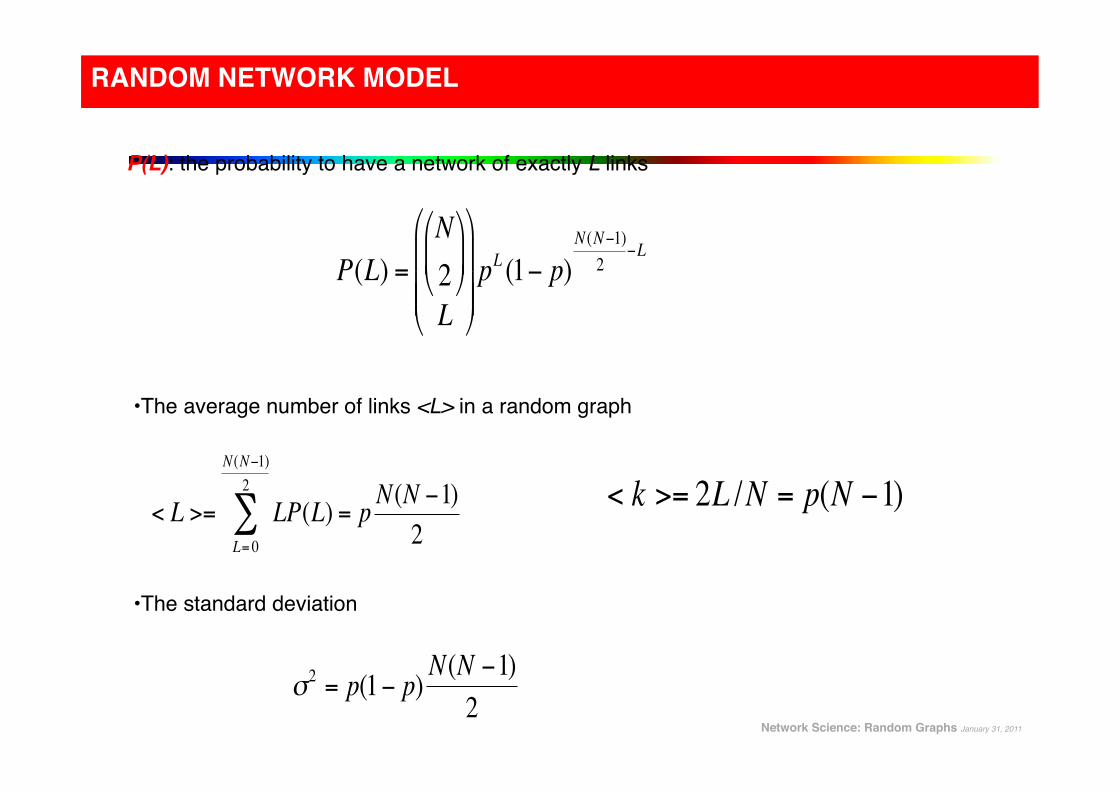
RANDOM NETWORK MODEL!
P(L): the probability to have a network of exactly L links"
Network Science: Random Graphs January 31, 2011!
€
P(L) =N2⎛
⎝ ⎜ ⎞
⎠ ⎟
L
⎛
⎝
⎜ ⎜ ⎜
⎞
⎠
⎟ ⎟ ⎟ pL (1− p)
N (N−1)2
−L
€
< L >= LP(L) = p N(N −1)2L= 0
N (N−1)2
∑
• The average number of links <L> in a random graph"
• The standard deviation"
€
σ2 = p(1− p) N(N −1)2€
< k >= 2L /N = p(N −1)

RANDOM NETWORK MODEL!
P(L): the probability to have exactly L links in a network of N nodes and probability p:"
Network Science: Random Graphs January 31, 2011!
€
P(L) =N2⎛
⎝ ⎜ ⎞
⎠ ⎟
L
⎛
⎝
⎜ ⎜ ⎜
⎞
⎠
⎟ ⎟ ⎟ pL (1− p)
N (N−1)2
−L
The maximum number of links in a network of N nodes."
Number of different ways we can choose L links among all potential links."
Binomial distribution...

DEGREE DISTRIBUTION OF A RANDOM GRAPH!
Network Science: Random Graphs January 31, 2011!
As the network size increases, the distribution becomes increasingly narrow—we are increasingly confident that the degree of a node is in the vicinity of <k>."
Select k "nodes from N-1"
probability of "having k edges"
probability of "missing N-1-k"edges"
€
P(k) =N −1k
⎛
⎝ ⎜
⎞
⎠ ⎟ pk (1− p)(N −1)−k
€
< k >= p(N −1)
€
σk2 = p(1− p)(N −1)
€
σk
< k >=1− pp
1(N −1)
⎡
⎣ ⎢
⎤
⎦ ⎥
1/ 2
≈1
(N −1)1/ 2

DISTANCES IN RANDOM GRAPHS!
Random graphs tend to have a tree-like topology with almost constant node degrees."
Network Science: Random Graphs January 31, 2011!
• nr. of first neighbors:"
• nr. of second neighbors:"
• nr. of neighbours at distance d: "
• estimate maximum distance:"
€
Nd ≅ k d

Given the huge differences in scope, size, and average degree, the agreement is excellent."
DISTANCES IN RANDOM GRAPHS compare with real data!
Network Science: Random Graphs January 31, 2011!

• Degree distribution!" " Binomial, Poisson (exponential tails)!
• Clustering coefficient!" " Vanishing for large network sizes!
• Average distance among nodes!" " Logarithmically small !
Erdös-Rényi MODEL (1960) !
Network Science: Random Graphs January 31, 2011!

Are real networks like random graphs?!
Network Science: Random Graphs January 31, 2011!
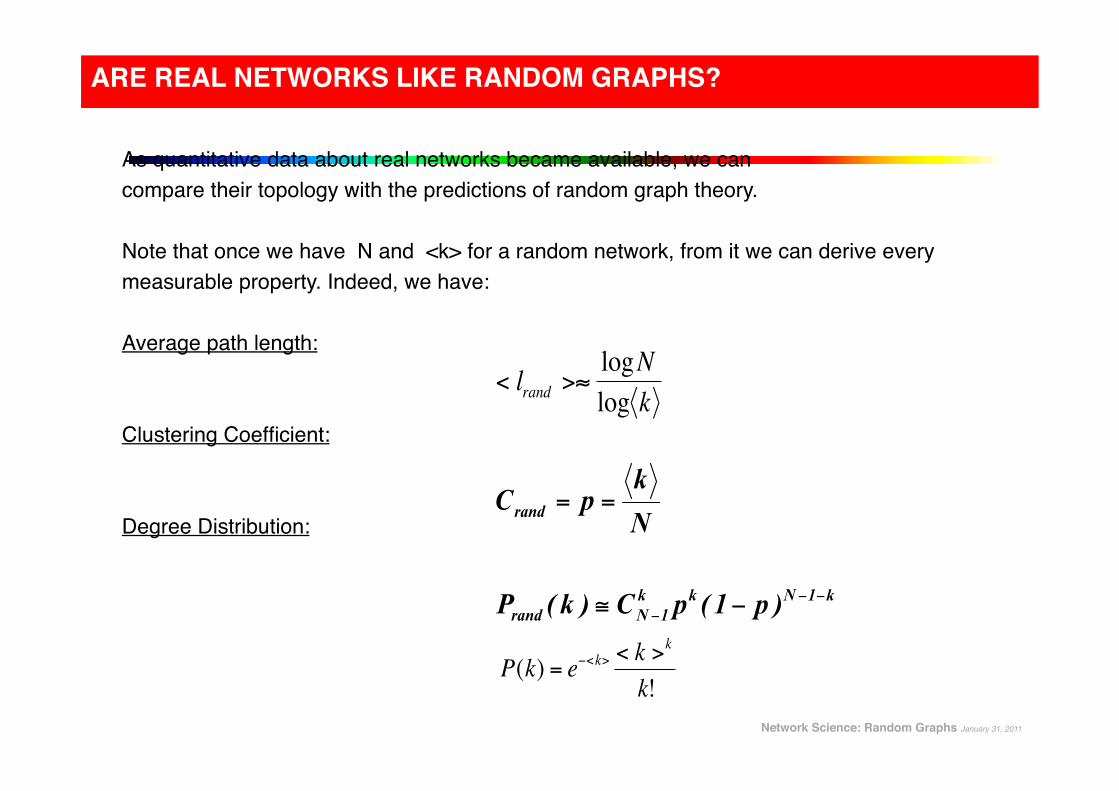
As quantitative data about real networks became available, we can"compare their topology with the predictions of random graph theory."
Note that once we have N and <k> for a random network, from it we can derive every measurable property. Indeed, we have:"
Average path length:"
Clustering Coefficient: "
Degree Distribution:" €
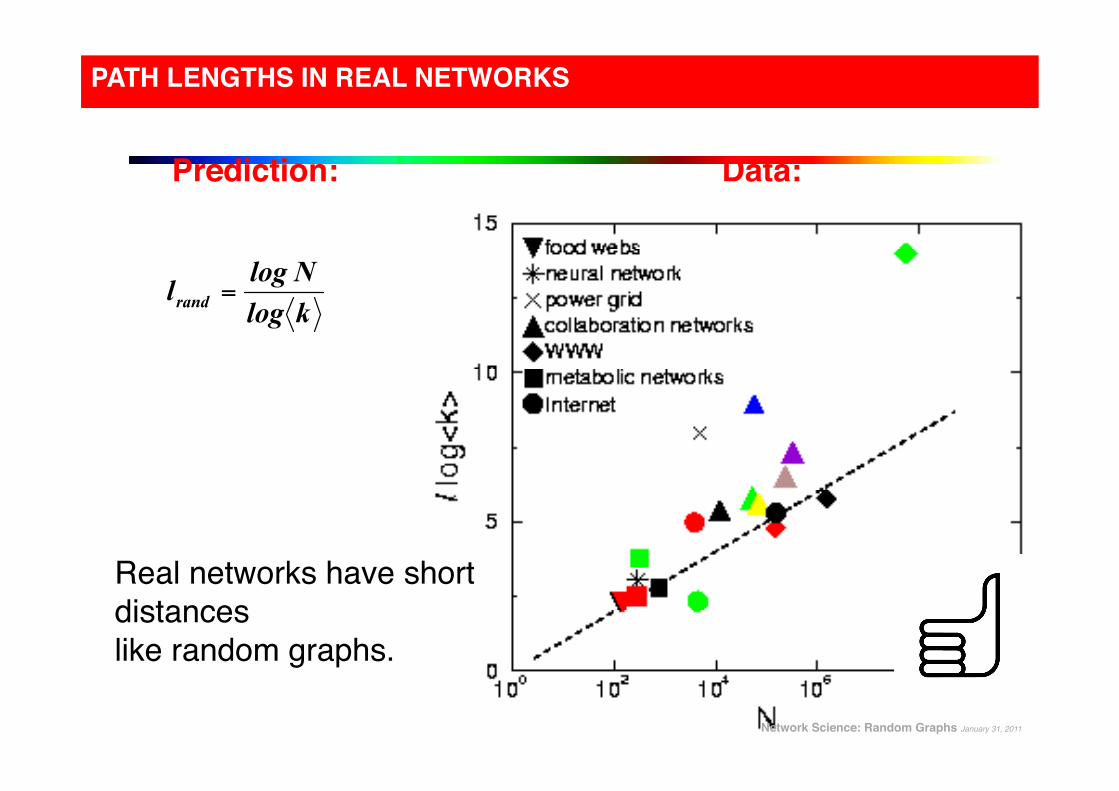
< lrand >≈logNlog k
ARE REAL NETWORKS LIKE RANDOM GRAPHS?!
Network Science: Random Graphs January 31, 2011!
€
P(k) = e−<k> < k >k
k!
100 102 104 106 108 1010
N0
5
10
15
l log
<k>
food websneural networkpower gridcollaboration networksWWWmetabolic networksInternet
Real networks have short distances"like random graphs. "
Prediction: ! Data:!
PATH LENGTHS IN REAL NETWORKS!
Network Science: Random Graphs January 31, 2011!

100 102 104 106 108
N10-8
10-6
10-4
10-2
100
C/<
k> food websneural networkmetabolic networkspower gridcollaboration networksWWW
Prediction: ! Data:!
Crand underestimates with orders of magnitudes the clustering coefficient of real networks. !
CLUSTERING COEFFICIENT!
Network Science: Random Graphs January 31, 2011!
€
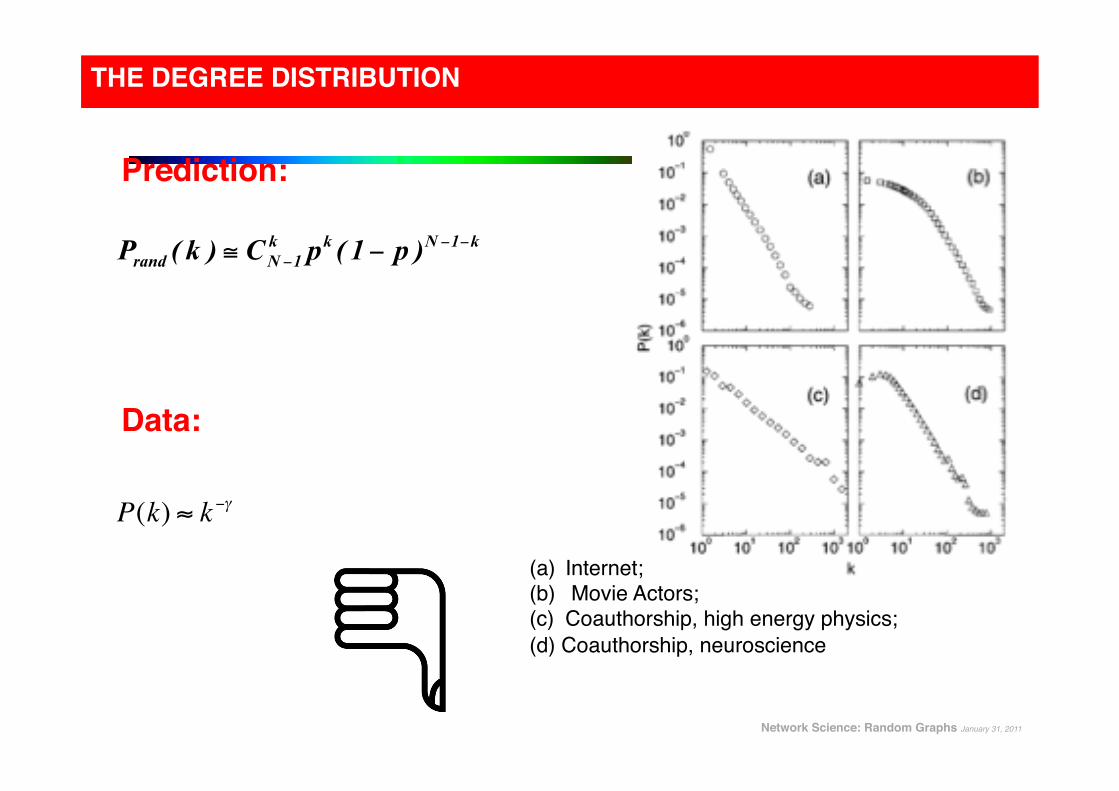
P(k) ≈ k −γ
Prediction: !
Data:!
(a) Internet;"(b) Movie Actors;"(c) Coauthorship, high energy physics;"(d) Coauthorship, neuroscience "
THE DEGREE DISTRIBUTION!
Network Science: Random Graphs January 31, 2011!

As quantitative data about real networks became available, we can"compare their topology with the predictions of random graph theory."
Note that once we have N and <k> for a random network, from it we can derive every measurable property. Indeed, we have:"
Average path length:"
Clustering Coefficient: "
Degree Distribution:" €
< lrand >≈logNlog k
ARE REAL NETWORKS LIKE RANDOM GRAPHS?!
Network Science: Random Graphs January 31, 2011!

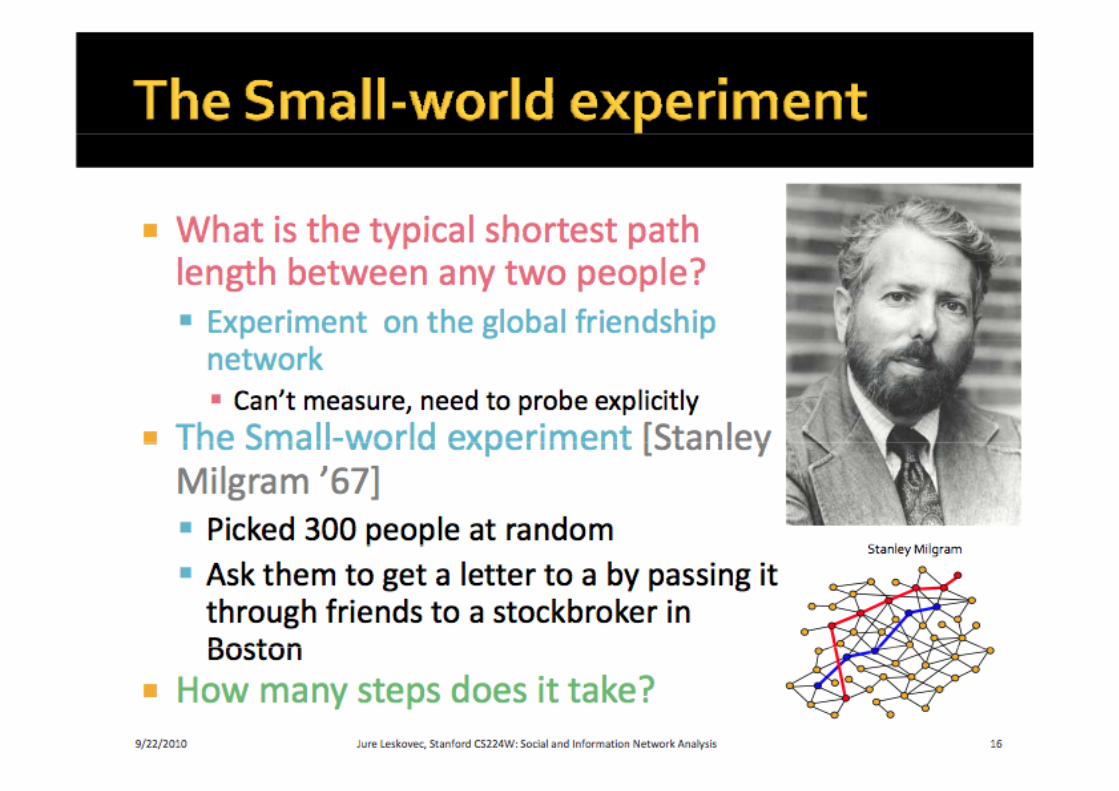
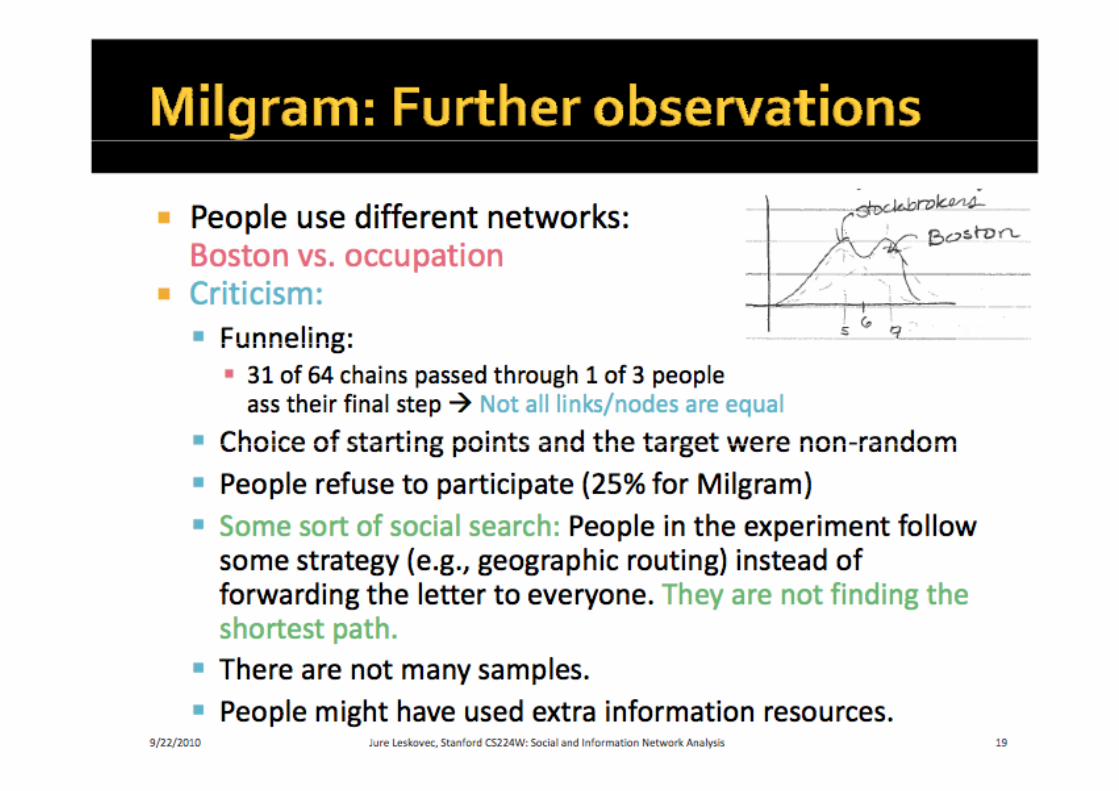
Social network as Small World
Analisi di reti sociali - Aprile 2011

Analisi di reti sociali - Aprile 2011

Analisi di reti sociali - Aprile 2011
Analisi di reti sociali - Aprile 2011

Analisi di reti sociali - Aprile 2011
Analisi di reti sociali - Aprile 2011

Analisi di reti sociali - Aprile 2011
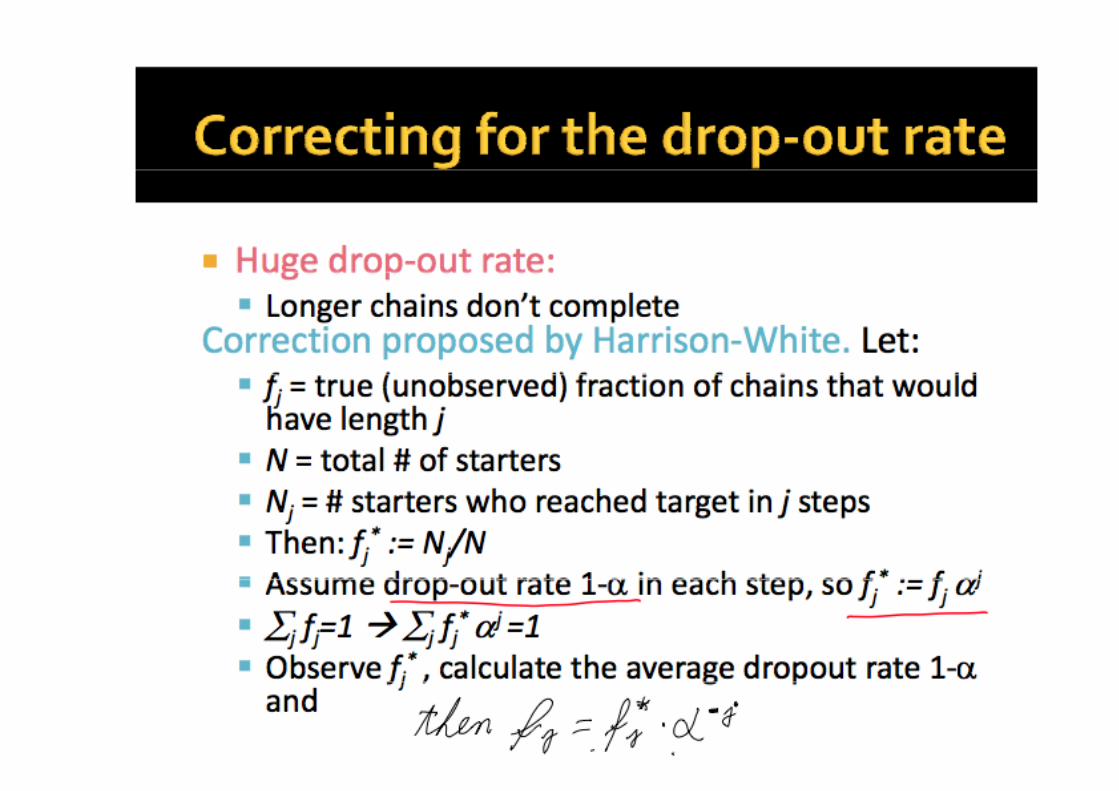
Analisi di reti sociali - Aprile 2011
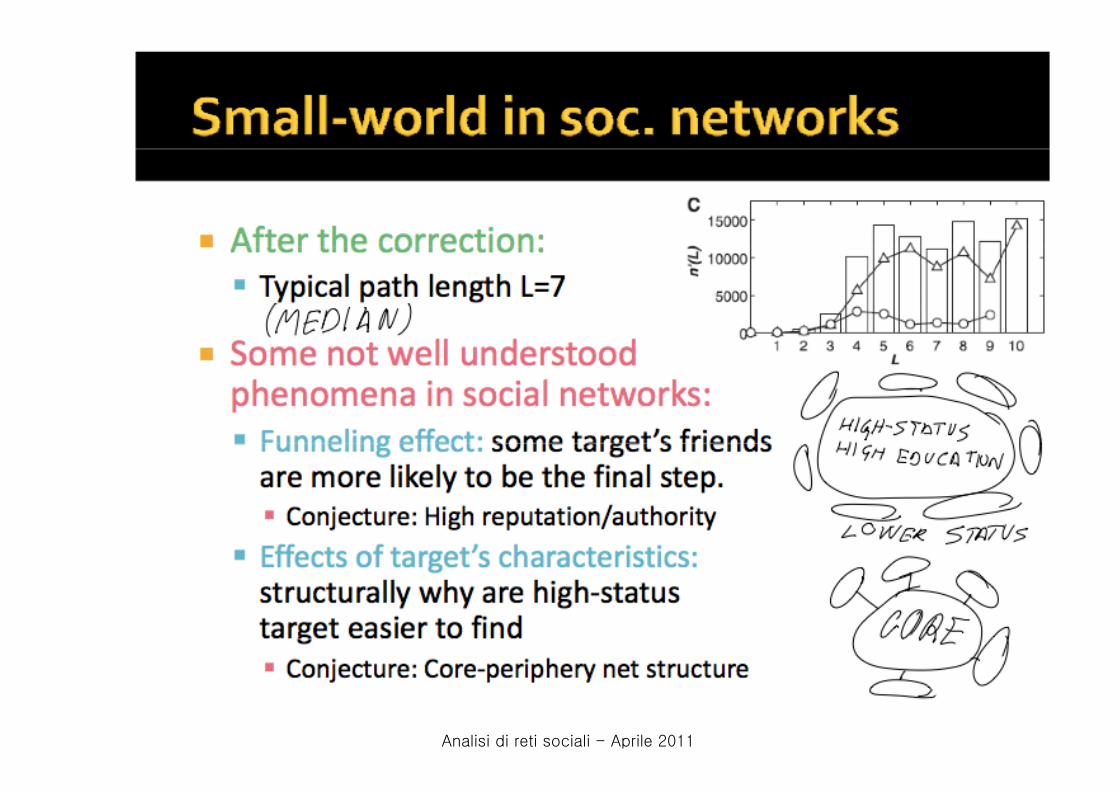
Analisi di reti sociali - Aprile 2011

Analisi di reti sociali - Aprile 2011

Analisi di reti sociali - Aprile 2011

Analisi di reti sociali - Aprile 2011

Planetary-Scale Views on an Instant-Messaging Network
∗Jure Leskovec† Machine Learning DepartmentCarnegie Mellon University
Pittsburgh, PA, USAEric HorvitzMicrosoft Research Redmond, WA, USAMicrosoft Research Technical Report MSR-
TR-2006-186June 2007
Analisi di reti sociali - Aprile 2011

IM experiment
Analisi di reti sociali - Aprile 2011

Data statistics
Analisi di reti sociali - Aprile 2011

Data statistics: typical day
Analisi di reti sociali - Aprile 2011
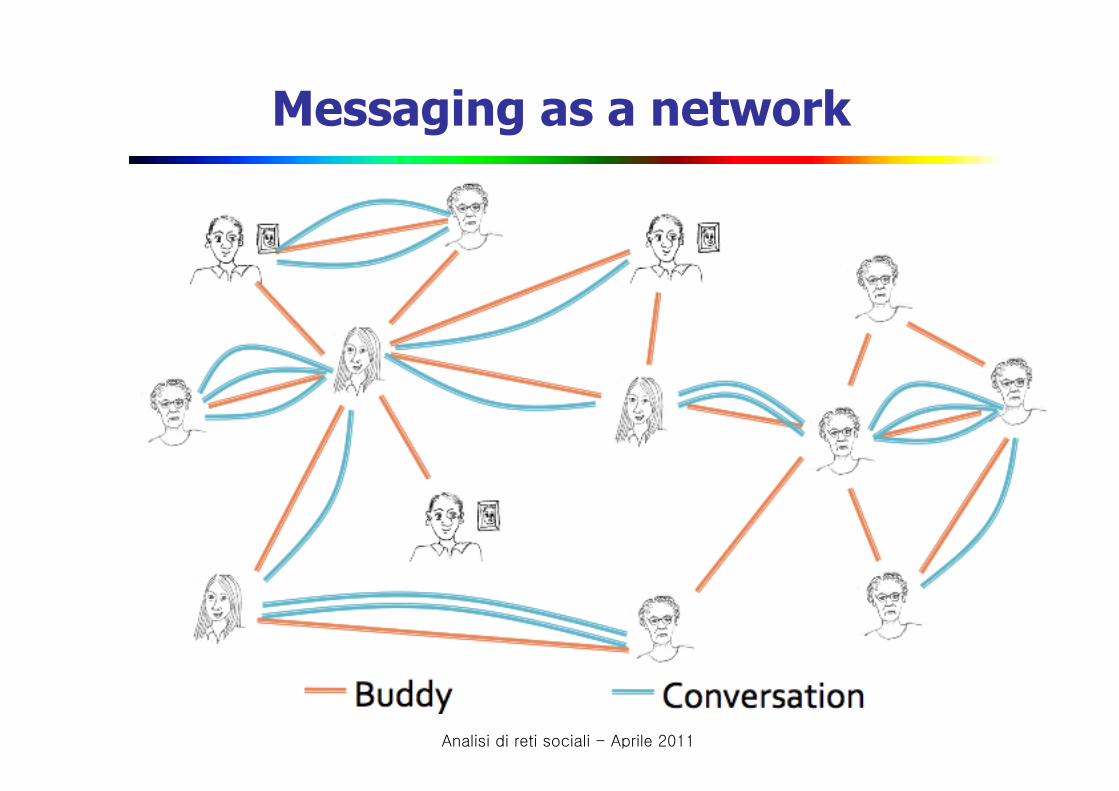
Messaging as a network
Analisi di reti sociali - Aprile 2011

IM communication network
Analisi di reti sociali - Aprile 2011

Network connectivity
Analisi di reti sociali - Aprile 2011

Network connectivity
Analisi di reti sociali - Aprile 2011

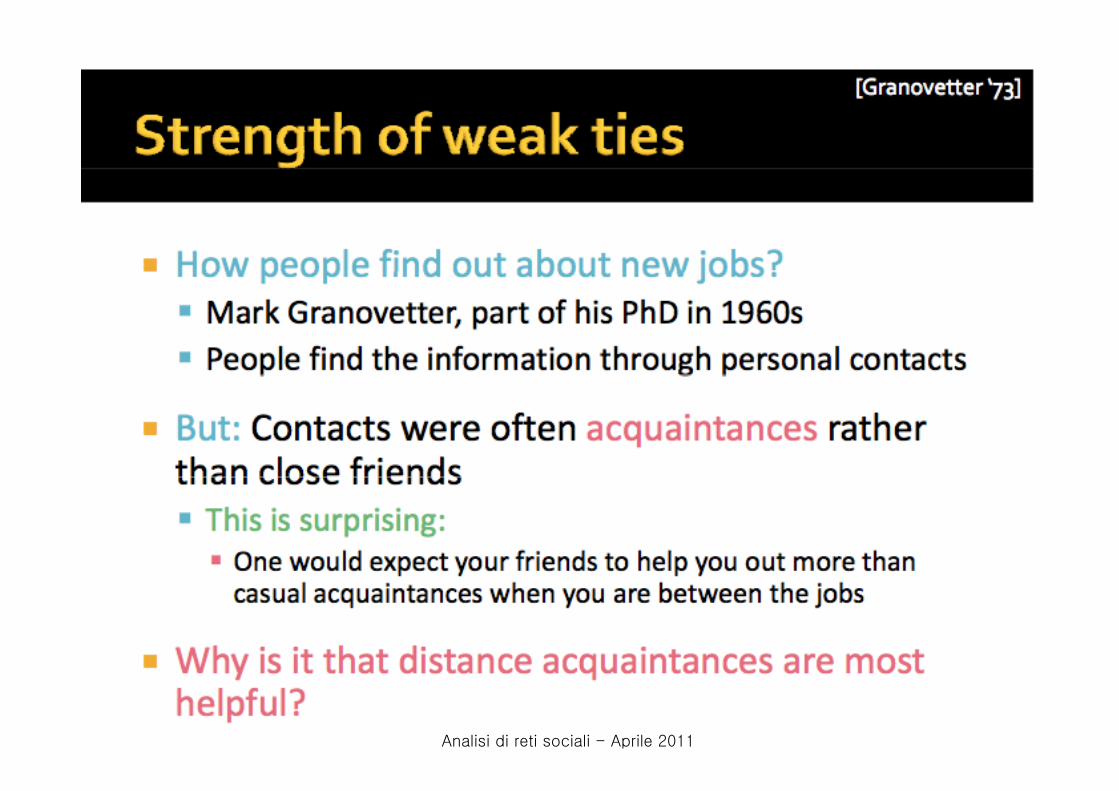
Strenght of weak ties in Social Networks
Analisi di reti sociali - Aprile 2011
Analisi di reti sociali - Aprile 2011
Analisi di reti sociali - Aprile 2011

Analisi di reti sociali - Aprile 2011

Analisi di reti sociali - Aprile 2011

Analisi di reti sociali - Aprile 2011

Analisi di reti sociali - Aprile 2011

Analisi di reti sociali - Aprile 2011

Analisi di reti sociali - Aprile 2011

Analisi di reti sociali - Aprile 2011

Analisi di reti sociali - Aprile 2011

Analisi di reti sociali - Aprile 2011

Analisi di reti sociali - Aprile 2011

Analisi di reti sociali - Aprile 2011

Analisi di reti sociali - Aprile 2011

Analisi di reti sociali - Aprile 2011

Analisi di reti sociali - Aprile 2011

Analisi di reti sociali - Aprile 2011

Analisi di reti sociali - Aprile 2011

Analisi di reti sociali - Aprile 2011
Centrality Measures
Measures of the “importance” of a node in a network
Analisi di reti sociali - Aprile 2011

Analisi di reti sociali - Aprile 2011
Analisi di reti sociali - Aprile 2011

Analisi di reti sociali - Aprile 2011

Analisi di reti sociali - Aprile 2011

Analisi di reti sociali - Aprile 2011
Analisi di reti sociali - Aprile 2011

Analisi di reti sociali - Aprile 2011

Analisi di reti sociali - Aprile 2011

Analisi di reti sociali - Aprile 2011

Analisi di reti sociali - Aprile 2011

Analisi di reti sociali - Aprile 2011

A path is a sequence of nodes in which each node is adjacent to the next one"
Pi0,in of length n between nodes i0 and in is an ordered collection of n+1 nodes and n links "
€
Pn = {i0,i1,i2,...,in}
€
Pn = {(i0 ,i1),(i1,i2 ),( i2 ,i3 ),...,( in−1,in )}
• A path can intersect itself and pass through the same link repeatedly. Each time a link is crossed, it is counted separately "
• A legitimate path on the graph on the right: ABCBCADEEBA!
• In a directed network, the path can follow only the direction of an arrow. "
PATHS!
A!
B!
C!
D!
E!
Analisi di reti sociali - Aprile 2011


